Your browser does not fully support modern features. Please upgrade for a smoother experience.
Please note this is a comparison between Version 1 by ZHENYA LIU and Version 2 by Vivi Li.
Members of the leucine-rich repeat (LRR) superfamily play critical roles in multiple biological processes. As the LRR unit sequence is highly variable, accurately predicting the number and location of LRR units in proteins is a highly challenging task in the field of bioinformatics. Existing methods still need to be improved, especially when it comes to similarity-based methods. We introduce our DeepLRR method based on a convolutional neural network (CNN) model and LRR features to predict the number and location of LRR units in proteins. We compared DeepLRR with six existing methods using a dataset containing 572 LRR proteins and it outperformed all of them when it comes to overall F1 score.
- deep learning
- LRR domain
- plant disease-resistance genes
1. Introduction
The plant immune system is mainly composed of two mechanisms [1]. The first deploys a large number of receptor-like kinases (RLKs) and receptor-like proteins (RLPs) as plasma membrane pattern recognition receptors (PRRs) that detect microbe-associated molecular patterns (MAMPs). This mechanism is named PAMP-triggered immunity or PTI [2]. Among them, the leucine-rich repeats containing RLKs (LRR-RLKs) and leucine-rich repeats containing RLPs (LRR-RLPs) play crucial roles in plant growth, development, signal transduction, immunity and stress response [3][4][3,4]. Plant LRR-RLKs are plasma membrane proteins composed of an extracellular domain (LRR domain), a single-pass transmembrane domain and a cytoplasmic kinase domain. On the other hand, a LRR-RLP is essentially a LRR-RLK lacking a cytoplasmic kinase domain [5]. The other mechanism relies on the specific recognition and interaction behavior between plant disease resistance (R) proteins and pathogen effectors. This mechanism is called effector-triggered immunity (ETI) [6]. The nucleotide binding leucine-rich repeat proteins (NLRs) encoded by plant R genes can recognize the pathogen effector, thereby triggering a plant immune response [7]. Plant NLRs usually contain a C-terminal LRR domain and a central NB-ARC domain (nucleotide-binding adaptor shared by Apaf-1, resistance proteins and CED-4) [8]. In addition, plant NLRs are roughly divided into two groups, depending on whether their N-terminal contains a Toll/interleukin-1 receptor (TIR) domain, TNLs or non-TNLs. Some non-TNLs have a coiled coil domain composed of CNLs [9][10][9,10]. Proteins with two or more LRR units form a LRR superfamily, including intracellular, extracellular and membrane-bound proteins with diverse functions involving multiple biological processes [11].
Plants use LRR-RLKs residing on the cell surface to sense different external and internal cues and elicit distinct biological responses. The signaling pathway mediated by LRR-RLKs enlists a small group of co-receptors, such as somatic embryogenesis receptor kinases (SERKs), through ligand-induced heterodimerization and transphosphorylation. In Arabidopsis, receptor and co-receptor pairs mainly regulate signal transduction in plant cell differentiation, growth and immunity. Brassinosteroid insensitive 1 (BRI1) interacts with SERK1, SERK3/BAK1 and SERK4/BKK1 to sense plant hormone brassinosteroids (BRs) for regulation of plant growth [12][13][14][15][12,13,14,15]. LRR-RLK PSKR1 interacts with SERK3/BAK1 and PSK-induced root growth as well as cell expansion are inhibited in SERK3/BAK1 mutants [16][17][16,17]. The secreted EPF peptides interact with LRR-RLK ER and its homologue ER-LIKE1 (ERL1) to negatively regulate the stomatal pattern [18]. The study showed all four functional SERKs were necessary, but their genetic contribution to stomatal patterns decreased from SERK3, SERK2, SERK1 and finally to SERK4 [19]. Floral organ abscission is regulated by the secreted peptides IDA, LRR-RLK HAE, HAE-LIKE 2 (HSL2) and the downstream MAP kinase (MAPK) cascade signaling pathway in Arabidopsis [20]. Genetic analysis of SERK mutants showed that SERKs redundantly regulated HAE and HSL2-mediated floral organ abscission. SERK1, SERK2, SERK3 and SERK1, SERK3 and SERK4 mutants exhibit floral organ shedding defects [21][22][21,22]. SERK1 and SERK2 redundantly regulate male gametophyte development [23][24][23,24]. It has been proposed that the LRR-RLK excess microsporocytes 1 (EMS1)/extra sporogenous cells (EXS) form a complex with SERK1 and SERK2. This senses the secreted peptide tapetum determinant 1 (TPD1) to regulate male gametophyte development [25]. Among well-characterized MAMPs, a conserved 22-aa peptide (flg22) and an 18-aa peptide (elf18) are perceived by LRR-RLK FLS2 and EFR, respectively [26][27][26,27]. SERK3/BAK1 interacts with FLS2 or EFR to sense flg22 or elf18 [28][29][30][28,29,30]. Genetic data revealed that SERK3/BAK1 is the main player, while SERK4 only works in SERK3/BAK1 mutants. The role of SERK1 and SERK2 is negligible in plant immunity, although all four functional SERKs form complexes with FLS2 and EFR [31]. Endogenous plant elicitor peptides (Peps) serve as damage-associated molecular patterns (DAMPs) to enhance defense responses [32]. LRR-RLK PEP1 receptors 1 and 2 (PEPR1 & PEPR2) interact with SERK3/BAK1 to sense AtPep1 in a manner similar to FLS2 and EFR. SERK3/BAK1 and SERK4 redundantly regulate the AtPep1 signal pathway because ethylene accumulation and ROS production triggered by AtPep1 are eliminated in the SERK3/BAK1 double mutants, but not in the single mutant [33][34][35][33,34,35].
LRR is a conserved domain with characteristic hydrophobic leucine residues present in the majority of immune receptors such as NLR, RLK and RLP [36]. Each LRR unit usually consists of 20 to 30 amino acids (aa) divided into a highly conserved segment (HCS) and a highly variable segment (HVS). The HCS usually contains a characteristic eleven aa pattern “LxxLxLxxNxL” where x represents any aa. Other hydrophobic residues replace L with certain probability at each conserved position [37].
Due to their high level of sequence variability necessitated by the diverse functions of LRR domains, it is a challenging task in bioinformatics research field to predict the exact position and number of LRR units in a protein. Current LRR prediction tools can be divided into two categories: sequence similarity-based and de novo prediction tools. Sequence similarity-based tools usually build the HMM model or PSSM matrix via sequence alignment, such as Pfam [38], SMART [39], Prosite [40], LRRfinder [41] and LRR search [42]. De novo prediction tools like LRRpredictor [43] are based on supervised learning models (e.g., SVM, MLP and AdaBoost). De novo prediction methods based on traditional machine learning algorithms usually have low prediction power. This is because their ability to extract hidden sequence characteristics is weak and the training dataset provides a limited representation of actual data.
Recently, the application of deep learning algorithm in bioinformatics increased exponentially [44] and its great potential was demonstrated in many research fields. These include prediction of gene expression [45], prediction of binding sites in RNA binding proteins [46] and interaction sites between proteins [47]. Due to the powerful capability of deep learning and importance of LRR repeats in biological activities, we developed DeepLRR. This is a deep learning-based web server that can predict potential LRR domains and units in protein sequences as well as characterize plant NLR, RLK and RLP resistance proteins and their non-canonical domains. Using DeepLRR, this study re-annotated LRR-RLK genes in Arabidopsis, rice and tomato. It further explored the distribution of known receptor and co-receptor pairs on the phylogenetic tree and provides a new perspective for identification of potential receptors and co-receptors.
2. DeepLRR Overview
DeepLRR predicts potential LRR domains and units in a protein sequence through concerted local and global analyses. In the local analysis phase, LRR protein sequences are retrieved from the Swiss-Prot database and annotated LRR unit sequences in these proteins are collected to form the positive sample dataset. To construct the negative sample dataset, we predict the highly conserved segment pattern (HSCP) of LRR units on the basis of the constructed positive sample dataset. The negative sample dataset was then artificially generated by eliminating HSCP. Thereafter, we use positive and negative sample datasets to build training, validation and testing datasets to train and test our CNN model. This is then used to evaluate any peptide sequences between 20 to 30 aa in length and to give a LRR unit probability score (LPS) for each peptide sequence. A given protein sequence is divided into 11 groups of short sequences based on a 20 to 30 aa-long sliding window and each short sequence is evaluated based on whether its LPS is a LRR unit. In the global analysis, we combined the CNN model and LRR features to set the dynamically adjustable parameters Lscp, Ldcp and Lncp, respectively. These parameters help us determine whether the multiple LRR units predicted by the CNN model can form a LRR domain. In addition, we have integrated the identification process of NLR, RLK and RLP resistance proteins and their non-canonical domains to improve the applicability of DeepLRR.3. Characterization of Highly Conserved Segment Pattern in LRR Units
Although the LRR HCSP has been documented in previous work based on a limited number of LRR proteins, it is necessary to reestablish a new LRR HCSP with the discovery of more and more LRR units. We built an LRR unit HCS pattern “LxxLxLxxNxL” based on the DeepLRR CNN positive sample dataset. In the HCSP, L at the first position can be substituted with hydrophobic aa: I, V, M, T, F; L at the fourth position can be substituted with I, V, F, M; L at the sixth position can be replaced by V, I, F, M, A, C; N at the ninth position can be replaced by C, T, S; L at the 11th position can be replaced by I, F, V, M, S or N with certain probability (Supplementary Table S1). Through this new HSCP, we artificially created the negative sample dataset required for the DeepLRR method.
4. Comparison of LRR Unit Prediction Performance for Different Models
To evaluate the overall performance of CNN models in LRR unit prediction, three additional machine learning models were also set up, including supported vector machine (SVM), random forest (RF) and naïve Bayes (NB) models. Five-fold cross validation was conducted to adjust the parameters for these models. The four models were evaluated using an independent testing dataset based on their precision, sensitivity, F1-score and MCC (Figure 2) performance. During this test, the CNN model obtained the highest F1-score of 0.9405, which is 0.01, 0.0452 and 0.0886 higher than that of SVM, RF and NB, respectively. The MCC value of CNN is 0.8831, which is 0.0203, 0.0938 and 0.1751 higher than that of SVM, RF and NB, respectively (Supplementary Table S2). These results showed that the CNN model is more stable and has more robust capability to predict LRR units compared to the other three models.
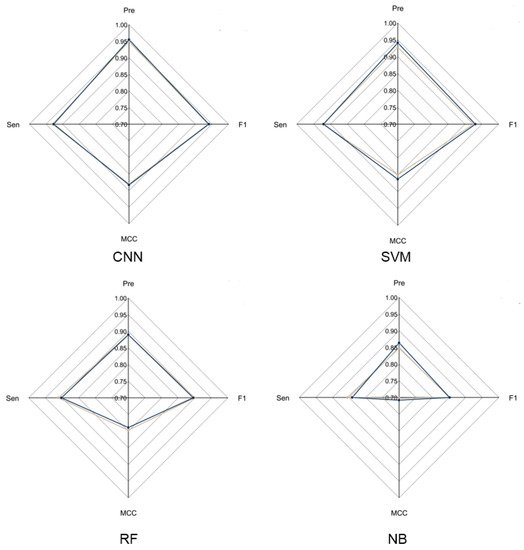
Figure 2. Radar chart of CNN model and three machine learning models. The radar chart shows four evaluation indicators: Precision, Sensitivity, F1-score and MCC. The brown line represents the average performance of the 5-fold cross validation for each model and the dark blue line represents the performance of each model using the test dataset.
5. Optimization of DeepLRR Parameters for LRR Domain Characterization
DeepLRR has three adjustable parameters: Lscp, Ldcp and Lncp. It is essential to understand the impact of these parameters on the performance of DeepLRR. For this, CD-HIT is used to remove the redundancy of 1748 LRR proteins with 80% as the threshold and 1144 non-redundant LRR proteins are divided into two groups. One group was used to evaluate the impact of different combinations for these parameters on DeepLRR performance. The other was used to compare the performance between DeepLRR and six LRR predicting tools currently in use. Based on the overall performance of DeepLRR in the test on the first group of LRR proteins, we found that when parameters Lscp and Ldcp were fixed, the Lncp gradually increased from 2 to 10. The precision in the prediction results of DeepLRR gradually increased and the sensitivity gradually decreased, while the F1-score firstly increased and then decreased. When parameters Lscp and Lncp were fixed, the Ldcp gradually increased from 1 to 20, while the precision in the prediction of DeepLRR firstly increased and then decreased. Sensitivity and F1-score firstly increased and then remained basically unchanged. Finally, when parameters Ldcp and Lncp (Lncp ≤ 4) were fixed, Lscp gradually increased from 1 to 4 and the precision as well as F1-score in the prediction results of DeepLRR gradually increased while the sensitivity was gradually decreased. However, when Lscp gradually increased from 4 to 11, the precision, sensitivity and F1-score in the prediction results of DeepLRR remained basically unchanged. When parameters Ldcp and Lncp (Lncp ≥ 5) were fixed, changing the value of Lscp has almost no effect on the performance of DeepLRR (Supplementary Figure S3). We performed further analysis and found when Lncp was set at 3 or 4, the largest F1-score could be obtained. When Lncp was set at 3 and Lscp [4][11][4,11] as well as Ldcp were set [8][13][8,13], the F1-scores were all greater than 0.820 with an average value of 0.825 and a maximum value of 0.827 (Lscp = 4, Ldcp = 9–11, Lncp = 3). When Lncp was set at 4, Lscp [4][11][4,11] and Ldcp [8][13][8,13] were set, the F1-scores were all greater than 0.809 with an average value of 0.817 and a maximum value of 0.828 (Lscp = 4, Ldcp = 11, 12, Lncp = 4). The above results tell us that we should adjust the parameters of DeepLRR depending on research focus. For example, if we pay more attention to the precision of DeepLRR, we need to calibrate the increase in Lscp and Lncp while decreasing Ldcp. Similarly, the trend runs opposite for sensitivity. Some fixed parameter combinations may maximize balance in the prediction performance of the DeepLRR method, such as Lscp/Ldcp/Lncp = 4/9/3 or 4/11/4.
6. Comparison of DeepLRR Performance with Existing Tools on LRR Domain Characterization
It is necessary to compare the proposed method with other existing state-of-the-art tools. We compared the performance of DeepLRR (Lscp = 4, Ldcp = 9, Lncp = 3) with the six existing tools using the second group of LRR proteins, which have not been used before. Our results showed that the F1-score with DeepLRR is 0.701, 0.241, 0.528, 0.035, 0.024 and 0.071 higher than that with Pfam, Prosite, SMART, LRRfinder, LRRsearch and LRR predictor, respectively. In addition, DeepLRR is the only tool whose precision and sensitivity are both greater than 0.740 (Table 1). This result showed that DeepLRR has better comprehensive performance in LRR unit prediction at protein level compared to the six existing tools.
Table 1. Performance of DeepLRR and six existing tools in predicting LRR units for 572 test protein sequences.
| Method | Precision | Sensitivity | F1 |
|---|---|---|---|
| LRRpredictor | 0.582 | 0.854 | 0.692 |
| LRRsearch | 0.676 | 0.813 | 0.739 |
| LRRfinder | 0.798 | 0.669 | 0.728 |
| Pfam | 0.192 | 0.037 | 0.062 |
| Prosite | 0.836 | 0.379 | 0.522 |
| Smart | 0.398 | 0.167 | 0.235 |
| DeepLRR | 0.744 | 0.783 | 0.763 |
Prosite has the highest precision of 0.836 while LRRpredictor has the highest sensitivity of 0.854. The prediction result of DeepLRR achieves a great balance between precision and sensitivity (0.744, 0.783) and it has the highest F1-score of 0.763.
7. Webserver Implementation
To implement the proposed DeepLRR method, we have developed a user-friendly online webserver which is freely available at (http://lifenglab.hzau.edu.cn/DeepLRR/; accessed on 28 November 2021) (Figure 3). If users only need to analyze a single protein sequence, they can paste it in the sequence window in the FASTA format. In order to meet the needs of users, we also provide a multi-sequence analysis button where users can upload their own protein sequence files. The file size is limited to 10 MB. The generated prediction results for all the submitted jobs will be presented in a page and a download link with detailed information about the sequence and the prediction result is provided. In addition, we provide a complete solution for implementing DeepLRR on Linux if users need large-scale and fast analyses.
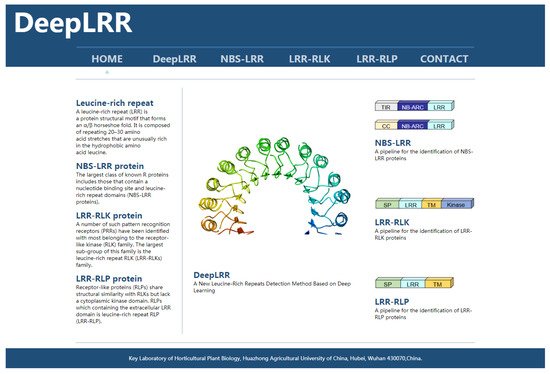
Figure 3. The homepage of the DeepLRR website. The left side of the main body of the website briefly introduces the research focus of DeepLRR while the right side shows the main functional modules of DeepLRR.
8. Re-Annotation of LRR-RLK Genes in Arabidopsis, Rice and Tomato Genomes
Using the LRR-RLK identification pipeline provided by the DeepLRR website service, 223 LRR-RLK genes were identified from Arabidopsis reference genome ITAG10.1. Comparing the annotation results of LRR-RLK genes from DeepLRR, reference genome ITAG10.1 and a representative paper [48][64], we found that the intersection of these three annotation results contain 126 LRR-RLK genes. DeepLRR and the representative paper have the largest intersection with 192 LRR-RLK genes while only 25 LRR-RLK genes were identified by DeepLRR. We then further analyzed 30 LRR-RLK genes that were not annotated by DeepLRR, with 17 LRR-RLK genes lacking the signal peptide, 6 LRR-RLK genes lacking the transmembrane domain, 5 LRR-RLK genes lacking the LRR and 1 LRR-RLK gene lacking the kinase domain (Figure 4A). Similarly, we re-annotated and analyzed the LRR-RLK genes in rice and tomato reference genomes. DeepLRR identified 191 and 183 LRR-RLK genes in the rice reference genome IRGSP-1.0 and tomato reference genome ITAG4.1 respectively. 14 and 23 LRR-RLK genes have not been included in the reference genome and the representative paper [49][50][65,66] respectively. There are 125 LRR-RLK genes in the rice genome that cannot be annotated by DeepLRR. Among them, 34 LRR-RLK genes lack the signal peptide, 8 LRR-RLK genes lack the transmembrane domain, 29 LRR-RLK genes lack the leucine-rich repeat, 43 LRR-RLK gene lack the kinase domain and 10 LRR-RLK genes lack four typical features or domains (Supplementary Figure S4A). It is worth noting that as the rice reference genome version was updated, 40 LRR-RLK genes identified in the representative paper cannot be found in the updated IRGSP-1.0 version. Meanwhile, 114 LRR-RLK genes in the tomato genome cannot be identified using DeepLRR. Among them, 47 LRR-RLK genes lack the signal peptide, 6 LRR-RLK genes lack the transmembrane domain, 11 LRR-RLK genes lack the leucine-rich repeat, 40 LRR-RLK genes lack the kinase domain and 5 LRR-RLK genes lack four typical features or domains at the same time (Supplementary Figure S5A).
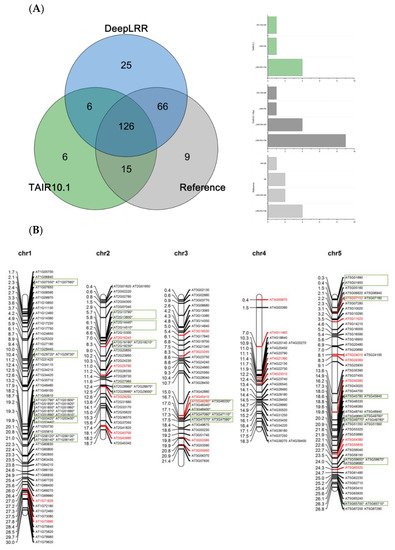
Figure 4. Re-annotation of the LRR-RLK gene in the Arabidopsis genome, chromosome mapping, gene cluster analysis and phylogenetic analysis. (A) The Venn diagram on the left shows the annotated results of the LRR-RLK gene in the Arabidopsis genome for DeepLRR, reference genome TAIR10.1 and the representative paper respectively. The histogram on the right shows the domain composition of the LRR-RLK gene that DeepLRR could not successfully annotate, including three datasets. One is unique to TAIR10.1, the other is shared by TAIR10.1 and the representative paper and the last is unique to the representative paper. (B) The distribution of LRR-RLK genes was re-annotated by DeepLRR on the chromosomes of Arabidopsis. The green rectangles represent different gene clusters, tandem repeat genes are marked with an asterisk and gene names marked in red are LRR-RLK genes annotated only by DeepLRR. (C) An unrooted phylogenetic tree of LRR-RLK genes was re-annotated by DeepLRR in Arabidopsis. The phylogenetic tree was established with amino acid sequences of the kinase domains using the neighbor-joining (NJ) method. The circles with different colors on the sub-nodes of the phylogenetic tree show different ranges of bootstrap values. The red circle shows bootstrap values from 0.9 to 1, the gold circle shows bootstrap values from 0.7 to 0.9 and the dark grey circle shows bootstrap values from 0.5 to 0.7. The different background colors of the leaf nodes indicate that the number of LRR units contained covers different ranges. Dark red indicates that the number of LRR units is greater than or equal to 20, dark yellow indicates that the number of LRR units is greater than or equal to 10 and less than 20, and dark blue indicates that the number of LRR units is less than 10. The histogram outside the leaf node shows the number of corresponding LRR units in detail. In addition, the phylogenetic tree shows the receptor and co-receptor pairs that have been experimentally verified so far. The circle represents a receptor, the triangle represents a co-receptor and the same color indicates that there is an interaction. Finally, the domain composition of each LRR-RLK gene is shown in detail.