Currently it is difficult to predict the outcome of spinal cord injuries and neurodegenerative diseases diagnosed in the early stages. These difficulties can be solved with the help of biomarkers - molecules that play an important role in these pathological processes. Small non-coding RNAs, such as microRNAs have the potential to act as biomarkers. Micro-RNAs are short RNAs of ~ 22 nucleotides, which are not translated into proteins, but instead act directly to regulate the translation of protein coding messenger RNAs. Isolation of microRNAs from biological fluids, in particular CSF, is problematic. As such, our work focuses on the methodological aspects as well as reviewing both the animal and patient studies used to determine potential miRNA biomarkers. In addition, we propose possible solutions for the existing technical problems. Thus, this review combines the available knowledge, drawing conclusions that can be useful for neuroscientists in developing a unified strategy for transcriptome analysis of CSF.
1. Introduction
1. Введение
Neurological disorders include a wide range of diseases that affect the brain, spinal cord and nerves, leading to various symptomatic manifestations. For most neurological diseases, the effectiveness and outcome of treatment depends on early diagnosis. Currently, diagnosis, especially in the case of neurodegenerative diseases, is based on detection of clinical symptoms and detection of structural changes by neuroimaging. However, manifestation of the first clinical symptoms often occurs in the later stages of the disease, when pathological processes have led to irreversible molecular and cellular shifts. These molecular changes that occur during the course of the disease could be tracked much earlier
[1][2][1,2]. In this regard, studies that search for early biomarkers of the pre-symptomatic stages of neurological disorders are highly relevant, not only for diagnostics but also in the staging of disease and choice of therapeutic intervention
[3].
Spinal cord injuries (SCI), which lead to impaired sensory, motor and autonomic functions that affect the physical, psychological and social state of the patient, are one example of where effective molecular biomarkers would have a marked clinical benefit [4][5]. The number of cases of SCI is growing, often associated with car accidents and various types of falls [6]. The neuroregenerative potential of the central nervous system (CNS) is rather low; nevertheless, some patients with SCI manage to fully or partially restore lost functions. [7][8]. Currently, clinical manifestations of SCI are assessed and classified using functional neurological examination, stratifying injury severity using the American Spinal Injury Association (ASIA) Impairment Scale (AIS). The reliability of the developed scale is well-tested, but nevertheless, the variability of spontaneous recovery within each AIS grade is high [9]. Establishing a panel of biomarkers that would objectively classify the severity of SCI and have a prognostic value would enable the optimal therapeutic strategy and better management of each patient’s condition [10][11].Повреждения спинного мозга (SCI), которые приводят к нарушению сенсорных, моторных и вегетативных функций, влияющих на физическое, психологическое и социальное состояние пациента, являются одним из примеров того, где эффективные молекулярные биомаркеры могут иметь заметную клиническую пользу [ 4 , 5 ]. Растет число случаев ТСМ, часто связанных с автомобильными авариями и различными видами падений [ 6 ]. Нейрорегенеративный потенциал центральной нервной системы (ЦНС) невысок; тем не менее у части пациентов с ТСМ удается полностью или частично восстановить утраченные функции. [ 7 , 8]. В настоящее время клинические проявления ТСМ оценивают и классифицируют с помощью функционального неврологического обследования, стратифицируя тяжесть травмы по шкале нарушений (AIS) Американской ассоциации травм позвоночника (ASIA). Надежность разработанной шкалы хорошо проверена, но, тем не менее, вариабельность спонтанного выздоровления в пределах каждой степени AIS высока [ 9 ]. Создание панели биомаркеров, которые бы объективно классифицировали тяжесть ТСМ и имели прогностическое значение, позволили бы выбрать оптимальную терапевтическую стратегию и улучшить ведение состояния каждого пациента [ 10 , 11 ].
With the development of high-throughput methods of genomic and transcriptome analysis, researchers have sorted genes, the expression change of which triggers inflammatory and degenerative processes in SCI [12][13]. Among the known post-transcriptional regulators that affect gene expression, miRNAs are considered to be important factors, as they are able to regulate more than half of all genes in the human genome [14]. These endogenous, small, non-coding RNAs of 18–24 nucleotides in length [15] have been shown to change under different physiological and pathological conditions and can be detected in biological fluids [16]. miRNAs have already been identified as being involved in the development of several neurological disorders, including central nervous system (CNS) injuries and neurodegenerative diseases [12][17].С развитием высокопроизводительных методов геномного и транскриптомного анализа исследователи отсортировали гены, изменение экспрессии которых запускает воспалительные и дегенеративные процессы при ТСМ [ 12 , 13 ]. Среди известных посттранскрипционных регуляторов, влияющих на экспрессию генов, микроРНК считаются важными факторами, поскольку они способны регулировать более половины всех генов в геноме человека [ 14 ]. Было показано, что эти эндогенные малые некодирующие РНК длиной 18–24 нуклеотидов [ 15 ] изменяются при различных физиологических и патологических состояниях и могут быть обнаружены в биологических жидкостях [ 16].]. miRNAs уже идентифицированы как участвующие в развитии нескольких неврологических расстройств, включая повреждения центральной нервной системы (ЦНС) и нейродегенеративные заболевания [ 12 , 17 ].
2. Methods for Isolation of miRNAs from Cerebrospinal FluidМетоды выделения микроРНК из спинномозговой жидкости
Quantification of circulating miRNAs is difficult due to their low concentration, effects of cell contamination and the absence of endogenous elements for normalization [18]. Body fluids, such as blood serum, plasma and
Количественное определение циркулирующих микроРНК затруднено из-за их низкой концентрации, эффектов загрязнения клеток и отсутствия эндогенных элементов для нормализации [ 27 ]. Жидкости организма, такие как сыворотка крови, плазма и спинномозговая жидкость, содержат низкие концентрации общей РНК, из которых микроРНК составляют лишь небольшую часть. Кроме того, изучение профиля микроРНК в ЦСЖ затруднено из-за небольшого объема полученных образцов [ 58 ]. Несмотря на сложности выделения РНК из спинномозговой жидкости, описанные выше, были предприняты значительные усилия по разработке более эффективных методов выделения РНК.
В исследовании Burgos et al. (2013) была протестирована эффективность выделения РНК с помощью девяти коммерческих наборов, определяющих концентрацию тотальной РНК, полученной из образцов сыворотки, плазмы и ЦСЖ человека с неуточненным диагнозом. Образцы спинномозговой жидкости готовили в виде аликвот от 500 до 1500 мкл, к которым добавляли известное количество синтетических экзогенных малых РНК (называемых впрыскиванием) в качестве положительного контроля. Во всех тест-наборах использовались смеси гуанидин-тиоцианат и/или фенол-хлороформ, позволяющие разделить образец на водную фазу с РНК и органическую фазу, содержащую белки и ДНК. Для выделения РНК из водной фазы используются некоторые наборы (Max Recovery Bioopure RNA, TRI Reagent RT, TRI RT Blood, TRI Reagent RT — Liquid Samples и RNAzol) были основаны на осаждении РНК этанолом (или изопропанолом), в то время как другие (mirVana, mirVana Paris и miRNeasy) использовали твердофазную экстракцию и последующую адсорбцию на стекловолоконной мембране. Предполагается, что использование наборов для выделения РНК в водной фазе с последующим осаждением позволяет получить более высокий выход РНК по сравнению с колоночными наборами для выделения. Поскольку считается, что РНК с фильтров на колонках может не полностью вымываться, возможны потери в общем количестве суммарной РНК. Несмотря на эти предположения, три из четырех наиболее эффективных наборов были основаны на колонках с мембранным фильтром для выделения РНК. Наборы для выделения РНК продемонстрировали выход общей РНК из спинномозговой жидкости от 15 до 30 нг на мл. Кроме того, было показано, что концентрация РНК различалась среди технических повторов при использовании всех наборов. Несмотря на то, что авторы определили наиболее эффективные наборы для выделения РНК из ЦСЖ (MaxRecovery BiooPure RNA Isolation Reagent, mirVana miRNA Isolation Kit, mirVana PARIS), количество полученной РНК было слишком мало для последующего секвенирования.C
SF, co
ntain low concentrations of total RNA, of which miRNAs constitute only a small part. In addition, the study of the miRNA profile in CSF is hampered by the small volume of samples obtained [19]. Despite the complexities of RNA isolation from CSF described above, there has been sinsidering
nificant effort in the development of more efficient methods of RNA isolation.
In a study the ab
y Burgos et al. (2013), the efficiency of RNA isolation using nine commercial kits was tested, determining the concentration of the total RNA obtained fro
m serum, plasma and CSF samples from a person with an unspecified diagnosis. CSF samples were prepared in 500 to 1500 μL aliquots, to which a known amount of synthetic exogenous small RNAs (referred to as a spike-in) was added as a positive control. In all the test kits, mixtures of guanidinium-thiocyanate and/or phenol-chloroform were used, allowing the sample to be separated into an aqueous phase with RNA and an organic phase containing proteins and DNA. For the extraction of RNA from the aqueous phase, some of the kits (Max Recovery Bioopure RNA, TRI Reagent RT, TRI RT Blood, TRI Reagent RT—Liquid Samples and RNAzol) were based on the precipitation of RNA with ethanol (or isopropanol), while others (mirVana, mirVana Paris and miRNeasy) used solid-phase extraction and subsequent adsorption on a fiberglass membrane. It is assumed that the use of kits for the extraction of RNA in the aqueous phase with subsequent precipitation allows a higher yield of RNA to be obtained compared to columnar kits for extraction. Since it is believed that RNA from the filters on the columns may not be completely washed out, losses in the total amount of total RNA are possible. Despite these assumptions, three of the four most effective kits were based on columns with a membrane filter for RNA isolation. RNA extraction kits demonstrated a yield of total RNA from CSF of 15 to 30 ng per mL. In addition, it was shown that the concentration of RNA varied among the technical repeats using all of the kits. Despite the fact that the authors identified the most efficient kits for RNA isolation from CSF (MaxRecovery BiooPure RNA Isolation Reagent, mirVana miRNA Isolation Kit, mirVana PARIS), the amount of RNA obtained was too low for subsequent sequencing.
Considering the above, Burgos et al. (ve, Burgos et al. (2013) further optimized RNA extraction from plasma and CSF samples by rehydrating the interfacial and organic phases and re-extracting the RNA. It was found that with repeated extraction with phenol-chloroform, it is possible to increase the yield of miRNA by almost two times. However, repeating this step a third or fourth time did not lead to a significant increase in the amount of miRNA isolated. A volume of 500 μL of CSF was found to be sufficient for the extraction of RNA required to obtain reproducible miRNA analysis results
[19][58]. Subsequent studies have sought to further enhance the yield of recovered RNA through the use of glycogen or exogenous RNA (east + RNA or MS2 phage RNA) to act as a carrier to increase the RNA yield at the isolation stage
[20][21][59,60]. The results obtained were somewhat ambiguous, as the increase in the concentration of RNA after the addition of glycogen only occurred with some of the extraction kits
[20][59].
In Akers et al. (2017) the authors investigated extracellular vesicle (EV) -derived miRNA from tumor tissue and CSF of patients with glioblastoma. The EV fraction from the CSF was isolated by a differential centrifugation method. EV pellets were resuspended in PBS; then, miRNA was isolated using the miRCURY RNA Isolation Kit. The amount of obtained miRNAs was estimated using real-time PCR since the concentration of the isolated RNA did not exceed 20 ng/μL. In addition to EV-derived miRNA, the authors examined miRNA from whole CSF and found that more miRNA species were found in whole CSF compared to the EV-enriched fraction. The authors also identified, for the first time, nine miRNAs from CSF as potential biomarkers of glioblastoma
[22][61]. A similar study was carried out by Kopkova et al. (2018a)
[23][62], who compared several approaches for the isolation of miRNA from CSF patients with glioblastoma and identified the most efficient miRNA purification kit as Norgen Biotek.
In a study by Gui et al. (2015) EV-derived miRNA from the CSF of patients with AD and PD obtained by differential centrifugation were extracted using the Qiagen miRNeasy Serum/Plasma Kit according to the manufacturer’s instructions. The authors tried to profile the expression of 746 miRNAs using TaqMan arrays. However, only 132 miRNAs (17.7%) were found, of which 27 and 6 miRNAs were differentially expressed in PD and AD, respectively, compared to the control group
[24][52].
Circulating and EV-derived miRNAs in the CSF (1 mL samples) of patients with various neurological disorders were investigated by Saugstad et al. (2017). For comparative analysis of the efficiency of isolation of total and EV-derived miRNA, four commercial kits were used. As expected, the RNA yield was higher when using kits specific to the isolation of total miRNA. The greatest difference was observed in CSF samples from patients with glioblastoma multiforme, where the total RNA obtained using the mirVana and miRCURY kits was in the range of 1.5–3.2 ng/μL, compared to 0.00–2.22 ng/μL of total RNA isolated using exoRNeasy and Total Exosome
[25][63].
To determine biomarkers in acute ischemic stroke, next-generation sequencing was performed using miRNAs isolated from 100 μL CSF using TRIzol reagent
[26][64] and compared to real-time PCR analysis of miRNAs isolated from 200 μL of CSF from a similar sample set using the miRCURY RNA Isolation kit for biofluids or the Norgen Biotek Total RNA Purification kit. The two analysis platforms, sequencing and real-time PCR, did not lead to identical results. The authors considered the reasons for this to be the relatively small sample set and a heterogeneous control group. Patients in the control group had different diagnoses, which may have influenced the changes calculated in relation to the group of people with stroke. The authors were also unable to confirm the results of their earlier pilot study
[27][65], highlighting the importance of further research, especially with a small sample of patients.
Obviously, obtaining high-quality RNA is the first step in studying miRNAs in CSF. The stage of RNA isolation from CSF plays an important role because it determines how complete the understanding of the miRNA profile will be. Since the concentration of miRNA in CSF is low, its isolation is difficult. Despite the fact that a fairly large number of different commercial kits for the isolation of RNA from various tissues and biological fluids have been developed, researchers are constantly looking for new protocols with good reproducibility and efficiency. Until now, there is no single standard, well-proven protocol for the isolation of RNA from CSF, which can lead to low interlaboratory reproducibility of the results and the objectivity of the data obtained.
3. Assessment of the Quality of the Obtained miRNA
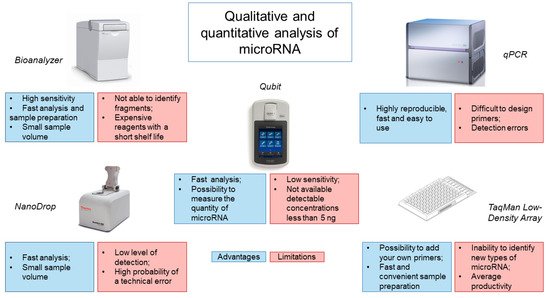
Analysis of the obtained miRNA isolated from CSF is most often performed using the Bioanalyzer capillary electrophoresis system (
Figure 1). This system has a high sensitivity of 50 pg/μL for RNA and requires minimal sample volumes (1 μL) to obtain accurate results
[28][66]. In addition, the system requires a minimum number of manipulations from the operator and is economical in terms of analysis time (25–45 min), depending on the number of samples and the chip used
[29][67]. However, the Bioanalyzer only shows the size of the RNA but does not identify RNA fragments, which may be disrupted rRNA, mRNA or long non-coding RNA. It is also worth noting the high cost of the device and reagents, which have a short shelf life, making this type of analysis less accessible.
Figure 1.
Analysis of methods for determining the quantity and quality of microRNA from CSF.
Evaluation of the isolated miRNA is also possible using spectrophotometers, such as the NanoDrop. However, the NanoDrop is rather limited in its ability to detect the low levels of miRNA obtained from CSF. Our experience has shown that NanoDrop measurement accuracy depends on the frequency of instrument use/calibration and the nature of the samples being analyzed. A common alternative to the NanoDrop is the Qubit fluorometer. It works by adding a fluorescent probe to the sample, which specifically binds the target molecule to form a fluorescent complex. The light source produces an intensity of fluorescence that is proportional to the concentration of the analyte. The device measures the intensity of the glow and calculates the concentration. Using a fluorometer, the concentration of RNA can be quickly and accurately determined, while new models of the device allow for measurement of the amount of miRNA. However, the sensitivity of the instrument is low and the range of quantitation starts at 5 ng. Use of a spectrophotometer, a fluorimeter and microfluidic electrophoresis can provide information on the integrity and the amount of miRNAs, but unfortunately, there is a possibility of obtaining data with significant variability
[30][31][32][25][38,42,48,63].
The low sensitivity of the above systems for assessing the quantity and quality of miRNA from CSF has led to the use of other microfluidic technologies, such as TaqMan Low-Density Array (TLDA), based on real-time PCR (
Figure 1). TLDA uses single-plex PCR with mapped primers for analysis. In this case, it is possible to add your own primers and probes, as well as to use a ready-made calibration curve. The advantage of this system is the speed and convenience of sample preparation, since reagents for each assay are already applied to the well
[33][68]. The disadvantage of this system is the inability to identify and measure new types of miRNAs and the average productivity by the criterion of the number of samples analyzed per day
[29][67].
The use of qRT-PCR is an alternative method. When used with a known amount of control miRNAs, it is possible to establish the efficiency of RNA extraction
[29][67]. This method is highly reproducible, fast and easy to use
[34][69]. However, existing commercial qRT-PCR kits use a strategy based on reverse transcription of mature miRNA molecules, which can lead to various detection errors. Another obstacle to qRT-PCR is that reaction conditions can vary and miRNA primers are difficult to design
[35][70]. The latter is associated with the length of mature miRNAs, which is insufficient for annealing with traditional primers designed for reverse transcription and PCR. In addition, miRNAs do not have a common sequence, for example, as poly (A) tail, which can be used for enrichment or as a universal primer-binding site for reverse transcription
[29][67].
Of course, the analysis of miRNA obtained after RNA extraction from CSF is very important since inaccurate assessment can greatly affect the diagnostic ability of these molecules
[34][69]. Therefore, further development of the most efficient and reproducible method for quantitative and qualitative assessment of the obtained miRNA is required.
4. Methods for Studying the miRNA Expression Profile
There are several approaches to studying miRNA expression. It is possible to study the expression of one or several specific miRNAs or perform total genome-wide profiling of miRNAs. To date, the expression of specific types of miRNA in CSF is measured using real-time PCR
[34][69]. The most common method is specific reverse transcription with stem-loop primers and measurement of real-time PCR expression using a probe-based detection system, such as TaqMan
[30][36][19][37][38][38,43,58,71,72]. Another method for measuring miRNA expression is based on universal reverse transcription, followed by SYBR Green quantitative PCR with specific forward and reverse primers
[39][21][47,60]. Digital PCR can also be used with the TaqMan chemical protocol to analyze the level of miRNA expression
[23][40][62,73]. Digital PCR data were confirmed using next-generation sequencing analysis
[40][73]. The above technologies based on qRT-PCR are effective methods for determining the level of miRNA expression in samples with low RNA content, such as CSF and serum. Real-time PCR is also used as the main method for validating sequencing- and microarray-based analyses discussed below
[29][41][67,74].
One of the first methods for simultaneous analysis of a large number of specific miRNAs was based on hybridization with microarrays. The advantage of miRNA microarrays lies in their low cost and in the possibility of simultaneous analysis of a large number of samples. The disadvantages of this method are the limited range of quantification, imperfect specificity for miRNAs that differ from each other by one nucleotide and the inability to perform an absolute quantification of the miRNA profile. Thus, the optimal field of application of microarray technology is considered to be in determination of the relative amounts of specific miRNAs between two different states
[29][67].
The NanoString nCounter multiplex system uses oligonucleotide tags for barcoding, followed by target detection by hybridization with color-coded probes. The system can quantify up to 800 different targets. The advantages of the NanoString nCounter system are the direct measurement of the expression levels of molecules without amplification and the ability to investigate the expression of formalin-fixed and paraffin-embedded samples
[42][75]. One of the main advantages of this method is the ability to discriminate miRNAs differing in one nucleotide with high accuracy. However, data analysis using the NanoString nCounter system is more expensive than using existing counterparts
[29][43][67,76].
For total profiling of miRNA expression, next-generation RNA-seq sequencing technology is used. The initial stage is the preparation of a cDNA library from small RNAs of the test sample, followed by sequencing. Bioinformatic analysis of sequence reads identifies both known and new miRNAs within the sample and provides relative quantification. The main advantages of next-generation sequencing for miRNA profiling are the ability to identify new miRNAs and the precise differentiation of miRNAs that differ by one nucleotide
[44][77]. Limitations of next-generation sequencing can be the high cost and limited amount of “barcoding” cDNA, which does not allow for the loading of multiple samples in one run
[29][67]. Sorensen et al. (2017) concluded that the study of miRNA expression in CSF using RNA-seq is less sensitive when compared with qPCR. At the same time, Tigchelaar et al. (2019) confirmed the relationship between the severity of SCI and the level of miR-10b-5p expression in CSF using both NGS RNA-seq and qPCR
[45][26][19,64].
TheВыбор choice of a method for studying the profile and expression of miRNA dependsметода изучения профиля и экспрессии микроРНК зависит от количества и качества выделенной РНК. onЧипы the quantity and quality of the isolated RNA. Chips for hybridization, technologies based on real-time PCR, the nCдля гибридизации, технологии на основе ПЦР в реальном времени, платформа nCounter platform and next-generation sequencing differ in the concentration and volume of the miRNA sample required for analysis, as well asи секвенирование нового поколения отличаются концентрацией и объемом образца микроРНК, необходимым для анализа, а также чувствительностью, специфичностью и стоимостью. inВ sensitivity, specificity and cost. Whilst all aspects of profiling should be consideredто время как все аспекты профилирования должны быть рассмотрены перед платформой [ before69 a], platformмы [34]предполагаем, weчто propose that the use of использование технологии miRNA-Seq technology to detect для обнаружения miRNAs and their subsequent validation usingи их последующей проверки с использованием qPCR can act as effective method for establishing reliable biomarkers of SCI and neurodegeneration diseasesможет действовать как эффективный метод для установления надежных биомаркеров SCI и нейродегенеративных заболеваний.