Your browser does not fully support modern features. Please upgrade for a smoother experience.
Please note this is a comparison between Version 2 by Bruce Ren and Version 1 by Guofu Yang.
As the spaces for dialogue between the past and the future, museums are essential to human well-being and social sustainability. We take China as a case study to explore the increasing trends of the number of museums as well as spatial inequities at both the provincial and city level.
- Gini coefficient
- cultural facility
- public attention
- agglomeration effect
- sustainable development
1. Introduction
A museum is a permanent non-profit institution in the service of society and its development that is open to the public [1]. Museums hold archives of ideas, carry abundant cultural connotations, and promote diffusion of knowledge. Culture and heritage can be considered key factors for sustainable development [2]. Since the first modern public museum was established in 1683 in the United Kingdom [3], people have increasingly appreciated the contribution of museums to a sustainable society [1]. Until now, museums have mainly been distributed among developed countries. The development of museums is a new topic in developing countries, where cultural facilities are receiving attention along with economic development. For example, most museums in China were established in the past three decades. However, with China having been the world’s second-largest economy since 2010 [4], the number of museums per million people in 2019 was 4.03, only ~1/5 that of France [5], 1/9 that of the United Kingdom [6], and 1/23 that of the United States [7]. Understanding the growth trend of museums and its relationship with city development has become a primary issue in formulating corresponding development policies.
The equitable distribution of public facilities is one of the major concerns of planners [8], and the distribution of museums is regarded as a matter of social justice [9]. Recently, some studies [10] have noticed the inequality caused by mismatching of the spatial distribution of populations and museums within cities, similar to inequality studies on other types of cultural relics [11,12][11][12]. Most museums are located in large cities [10]. Owing to the distance decay effect of public facilities [13[13][14],14], museums mainly serve local people [15]. This means that the uneven spatial distribution of the number of museums results in inequality of opportunities for people to visit museums in different regions. For example, in the United States of America Vermont has nine times more museums per million people than Florida. This inequality relates to the economic level of a region [16,17][16][17], with rich areas having a higher level of participation in cultural activities [18]. These inequalities in many aspects are recognized as a barrier to sustainable urban development and the improvement of human well-being [19]. Reducing inequalities and eliminating disparities in accessibility are central to sustainable development goals [20].
Accurately measuring inequity is a necessary premise on the way to proposing potential solutions. The Gini coefficient was first used in economics to measure income inequality within a population [21,22][21][22]. It has also been used in many other fields, and provides a quantitative measure of the inequality in different socioeconomic conditions among areas [23,24][23][24] while also evaluating the mismatch between the spatial distributions of facilities and populations [22,25][22][25]. For example, some studies have quantified the Gini coefficients of the accessibility of public facilities such as walking roads, public transport facilities and cars [8], hospitals in cities [26], and the spatial inequality of museums in different parts of a city [10]. The Gini coefficient can be used by policymakers to measure the equality of cultural facilities in order to maintain social vitality and sustainable development. These pioneering studies quantified the inequality of cultural facilities; however, they were mainly limited to the interiors of cities. Using the Gini coefficient to quantify the spatial inequalities of the number of museums in different cities and regions of a country is crucial to investigating cultural resource allocation and optimization.
In contrast to the negative effects of inequality, the uneven spatial distribution of city facilities can promote the efficient use of facilities due to the agglomeration effect [27]. The agglomeration effect with respect to museums is conducive to the vitality and sustainable development of cities [28] because it heightens the demand of consumers and enhances a perception for quality [29,30][29][30]. Leisure and tourism are increasingly important beyond museums’ basic functions [31]. The positive externalities of the agglomeration effect such as knowledge spillovers, labor sharing and economies of scale [32,33][32][33] enlarge the gap in city development and well-being between large cities and small cities. Yet, the promotion of the agglomeration effect of museums on economic activities and human well-being is still lacking exploration.
2. The Museum Boom Still Lags behind Population and Economic Development
Industrialization needs the support of knowledge and inspiration provided by museums. Consequently, cultural development is promoted by economic development in many regions [18]. China remained an agricultural country for thousands of years and transitioned to an industrial nation at the end of the 19th century. The first museum in China was built in 1902 in Jiangsu Province, a rich region, at the beginning of industrialization in China. However, the progress was very slow, and there were only 137 museums until 1980 in the whole country. Since the 1980s, the reform and opening-up in China have promoted economic development. A dramatic increase occurred in the number of museums, and a boom in the late 1990s (Figure 1). All provinces, except for a few in western China, exhibited a sudden increase in museums in the 1980s, revealing a synergistic effect between the number of museums and economic development (Figure 2). However, although China became the second-largest economy in the world in 2010 [4], the number of museums per million people in China in 2019 was only 4.03 (Figure 1c), while it was 92.29 in the United States in 2018 [7], 37.43 in the United Kingdom in 2020 [6], and 18.18 in France in 2020 [5]. This reveals a time lag in the number of museums between developing and developed countries.
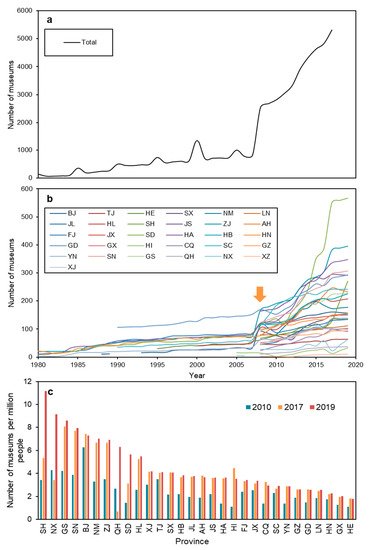
Figure 1. Historical trend of the number of museums in 31 provinces of China mainland from 1980 to 2019. (a) Total number of museums in mainland China; (b) the number of museums in 31 provinces; (c) changes in the number of museums in provinces of China in 2010, 2017 and 2019. Blue—2010, orange—2017, red—2019. The provinces on the horizontal axis are ranked according to the number of museums per million people in 2019 from high to low. BJ—Beijing City, TJ—Tianjin City, HE—Hebei Province, SX—Shanxi Province, NM—Inner Mongolia Autonomous Region, LN—Liaoning Province, JL—Jilin Province, HL—Heilongjiang Province, SH—Shanghai City, JS—Jiangsu Province, ZJ—Zhejiang Province, AH—Anhui Province, FJ—Fujian Province, JX—Jiangxi Province, SD—Shandong Province, HA—Henan Province, HB—Hubei Province, HN—Hunan Province, GD—Guangdong Province, GX—Guangxi Province, HI—Hainan Province, CQ—Chongqing City, SC—Sichuan Province, GZ—Guangzhou Province, YN—Yunnan Province, SN—Shaanxi Province, GS—Gansu Province, QH—Qinghai Province, NX-—Ningxia Autonomous Region, XZ—Tibet Autonomous Region, and XJ—Xinjiang Province. The orange arrow denotes a national policy (Notice on the free opening of national museums and memorials) boost in 2008.
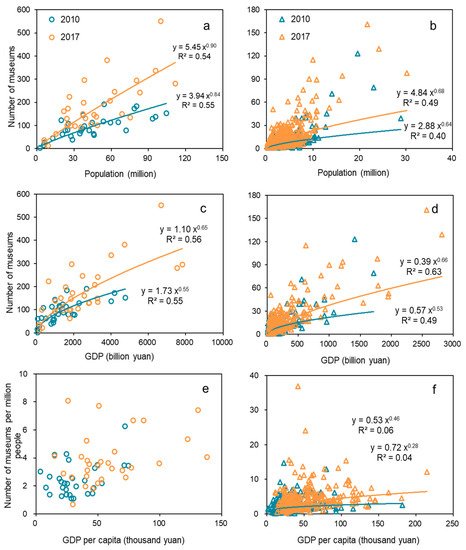
Figure 2. Relationships between the number of museums and population and economic level. (a,c,e) at the provincial level: (a) population, (c) total GDP, and (e) per capita GDP; (b,d,f) at the city level: (b) population, (d) total GDP, and (f) per capita GDP. Blue—2010, orange—2017.
The return on investment provided by cultural facilities takes time to realize [47][34]. In China, the growth in the number of museums has lagged behind the growth of GDP at both the provincial and city levels (Figure 2c,d), although the situation slightly improved from 2010 to 2017. The lags in some cities, however, are still bad. For example, the per capita GDPs of Ordos City in Inner Mongolia (215,000 yuan per capita) and Karamay City in Xinjiang (138,000 yuan per capita) are much higher than the average level of Chinese cities (55,000 yuan per capita); nevertheless, the numbers of museums per million yuan GDP in Ordos (120 museums) and Karamay (10 museums) are much lower than the average (350 museums) cities of China. The economic development of these cities is driven by coal and oil exploitation, they are remote and sparsely populated, and cultural construction has not kept up with the economic level. The case is similar to a study about museums and libraries in England [48][35] that showed how the development of cultural facilities is not completely synchronized with economic development. Research on the United States [49][36] also shows that some tourism sub-industries do not directly respond to economic development, but rather rely on the drive of the accommodation industry. In sum, the influence of economic level on the per capita number of museums is not always direct and immediate.
Many cultural facilities showed near-linear growth in response to population. For example, schools, hospitals, post offices and theatres presented a nearly linear relationship (0.83, 0.77, 0.71 and 0.96, respectively) in response to local population size in China [46][37]; the β for libraries in the United States was 0.76 [50][38], and the β of schools in the United States and Brazil was 0.95 and 0.94, respectively [45,51][39][40]. However, the scale exponent of museums to population size was sublinear (β = 0.84) at the provincial level in 2010 (Figure 2a), while it was only 0.64 at the city level (Figure 2b). Fortunately, supported by active cultural policy, the β increased to 0.90 in 2017 at the provincial level. This indicates that the growth rate of museums to population follows a common scale law with other culture components in response to population.
Policies also play an important role in promoting an increased number of museums [10]. For example, the number of museums boomed after 2008 in Ya’an City, Sichuan Province, although the per capita GDP of this city was relatively low. This was due to powerful support from the central government and other provinces, and even foreign aid to the region after the Wenchuan Earthquake in 2008 [52,53][41][42]. These policies promoted cultural resource allocation and guaranteed the effect of distribution policies. In fact, in 2008, China’s central government issued incentive policies related to the development of museums, and the number of museums in every province and city has increased greatly in subsequent years. Considering that the demand for cultural services is increasing, the Chinese government needs to further boost policies to promote the increase in museums.
3. The Museum Agglomeration Effect Promotes Visits to Museums
The increasing rate of visitors was superlinear (β = 1.53) in response to the number of museums at the provincial level (Figure 3a). This clearly reveals the presence of the agglomeration effect, as provinces with more museums attract more visitors than provinces with fewer museums. At the city level, the agglomeration effect also exists, as β = 1.17 (Figure 3b). The agglomeration effect simulates knowledge and labor sharing [32,33][32][33] and increased efficiency [29]. For museums, the agglomeration effect of visitors means that the service efficiency of single museum is higher in regions with more museums (Figure 3c,d), although it may cause inequality [43]. Policymakers need to compromise between equality and efficiency. In fact, in China, the crucial challenge at present is the insufficient number of museums.
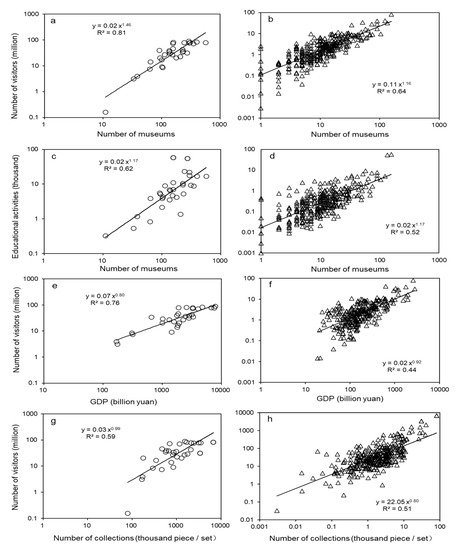
Figure 3. Relationships between the number of visitors and the number of museums, GDP and the number of collections of museums. (a,c,e,g) at the provincial level: (a) the number of visitors and the number of museums, (c) the number of educational activities promoted by museums and the number of museums, (e) the number of visitors and GDP, (g) the number of visitors and the number of collections. (b,d,f,h) at the city level: (b) the number of visitors and the number of museums, (d) the number of educational activities promoted by museums and the number of museums, (f) the number of visitors and the number of collections, and (h) the number of visitors and the number of collections. The data are for 2019.
In contrast to the agglomeration effect of visitors to state owned museums, the non-state owned museums are disadvantaged at attracting visitors (Figure 4e), and the β is only 0.25 (Figure 4f). The state owned museums are more mainstream in China, and their content is comprehensive, while the contents of each non-state owned museum is often focused on a few topics; many are small in size, and therefore lack attractiveness [54][44]. The museums themselves should more actively participate in social services and give full play to their educational value [55][45]. Due to the ‘luxury effect’ in non-state- owned museums, more museums are expected to be built along with economic development, and non-state owned museums can supplement the state owned museums and thus promote the spatial equality of museums. In this case, the policy should be adjusted to improve the use efficiency of non-state owned museums in order to serve more people.
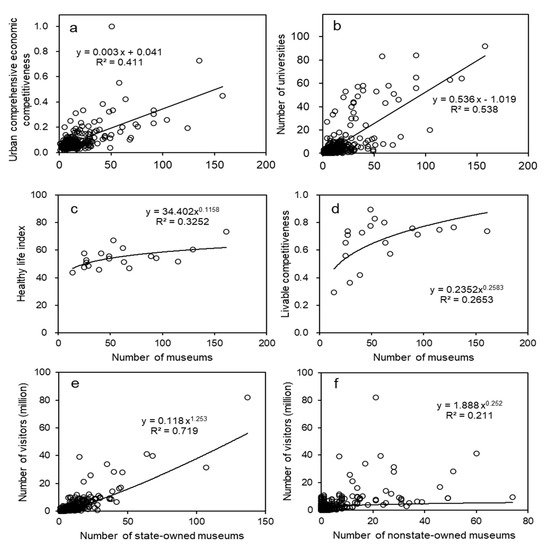
Figure 4. The relationships between city characteristics and museum numbers in cities of China. (a) Urban comprehensive economic competitiveness and number of museums, (b) university number and number of museums, (c) healthy life index and number of museums, (d) livable competitiveness and number of museums, (e) number of visitors and number of state owned museums, (f) number of visitors and number of non-state owned museums.
4. The Number of Museums among Provinces Is Relatively Equal, but Gini among Cities Needs to Be Improved
The Gini coefficient of income in China is 0.53–0.55 [56][46], while the Gini coefficients of museums in the provinces of China are as low as 0.27 (Figure 5a). This is similar to the Gini coefficients of sports activities (0.22–0.34) in many countries [25], but is lower than many other social dimensions or facilities in cities. For example, the Gini of the distribution of schools in cities is 0.35–0.63, while the Gini of spatial patterns of park visitors and park areas per capita ranges from 0.2 to 0.8 [11]. There are great differences in the socioeconomic conditions among provinces in China, and the relatively equal spatial pattern of the museums means that macro-control policies in China play a crucial role in cultural resource allocation. The equality of museums among provinces is conducive to the nationwide balanced popularization of education.
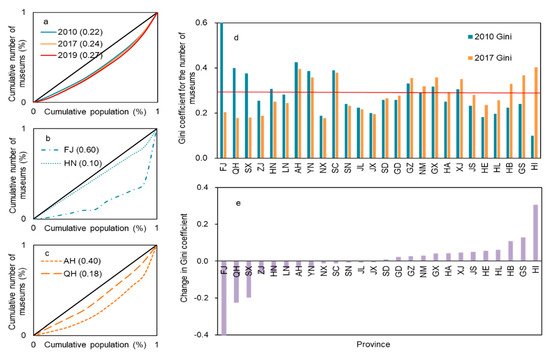
Figure 5. Changes in the inequalities in the number of museums. (a) Lorenz curves of per capita museums and comparison of Gini coefficients among the provinces of China from 2010 to 2019, (b) among the cities of Fujian Province (FJ) with the highest Gini and Hainan Province (HN) with the lowest Gini in 2010, (c) among cites of Anhui Province (AH) with the highest Gini and Qinghai Province (QH) with the lowest Gini in 2017. The Gini coefficient is in parentheses in the top left. (d) The inequalities in the number of museums of each province from 2010 to 2017; blue bar−2010, orange bar−2017, red line-the average Gini coefficient for 2017 (0.28); (e) changes in Gini coefficients between 2010 and 2017. The municipalities (BJ, TJ, SH, CQ) directly under the central government had not no data for the subregions. The provinces are ranked by the difference in Gini coefficients (ΔGini) between the two years. Negative values mean that inequality has been reduced, while positive values mean that it has increased.
Inequalities in cultural consumption, such as education, often respond to countries’ economic levels [17]. However, the inequality of museums per capita in different provinces and different cities with high or low economic levels was not significantly different (Figure 6). The relative equality in museums per capita among the provinces of China does not support the conclusion that inequality responds to economic level [16,17][16][17]. Furthermore, the changes in Gini along with development are not a response to the economic level, although the GDP increased by 82% from 2010 to 2019, which is similar to findings in Italy [16]. Fortunately, the highest Gini coefficient is decreasing, and the range of Gini coefficients is narrowing (Figure 6d). This indicates that the number of newly built museums is matching the population distribution.
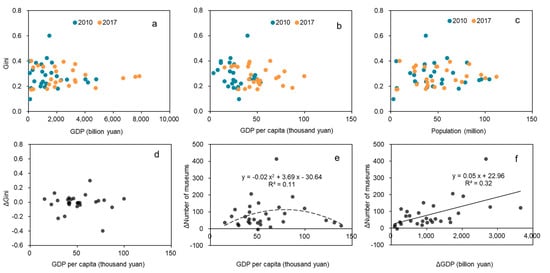
Figure 6. The Gini coefficient of museums and its interannual changes related to the economic level and population at the provincial level between 2010 and 2017. (a) Two-year Gini coefficient and GDP, (b) two-year Gini coefficient and per capita GDP, (c) two-year Gini coefficient and population, (d) ΔGini and two-year per capita GDP, (e) difference in the number of museums and per capita GDP of 2010, (f) difference in the number of museums and GDP between the two years. Blue dot- 2010, orange dot−2017; solid line means p < 0.05, dashed line means p < 0.1.
The agglomeration effect of visitors in response to the number of museums (Figure 3a,b) supports the conclusion that rich areas have a higher level of participation in cultural activities [18]. Economic growth promotes the number of museums and educational activities in provinces and cities (Figure 2 and Figure 3), especially the number of non-state owned museums (Figure 3 and Figure 6f). However, economic growth does not necessarily lead to improvements in equity (Figure 6d). As the central government can allocate cultural resources more equally among the provinces, we suggest that provincial governments also optimize their cultural policies to reduce the inequality in per capita museums among their cities.
The accessibility of different types of facility is not equal. For example, parks have higher accessibility than museums because they are public facilities accessed on a day-to-day basis. When museums are open to the public free of charge, the accessibility difference between museums and parks narrows. For example, Zhejiang Provincial Museum is located near the West Lake of Hangzhou, a famous world cultural heritage site, and tourists usually flock to the museum to enjoy the cool in summer, making the museum the 15th largest museum by visitors worldwide in 2018 [57][47]. Another example is Anyang Museum in Henan Province: the hall is designed as a study room open to the public. In addition, the number of visitors to non-state owned museums in China is increasing, as more and more of them can now be visited free of charge.
5. Museum Development Synergizes with Economic Growth and Human Well-Being
Museums are institutions that generally reflect a cultural substrate or instance (tangible or intangible) that pre-exists in a place. The local institution and building of museums follow as a necessity of popular demand. However, our results shows that the number of museums in a province does not match the number of cultural heritage sites. For example, Shanxi Province is one of the regions with the longest history and the largest number of aboveground cultural relics in China; however, there were only 151 museums in 2019 (Figure 1b), ranked 17th in China. Another example, Henan Province, which is the original region of Chinese culture, has only 3.62 museums per million people in 2019, lower than the nation as a whole (Figure 1c). These two provinces are ranked low in GDP. Compared with cultural heritage resources, economy seems to be the key factor in determining the number of museums.
The development of museums is conducive to the vitality and sustainable development of cities [28], as museums promote socioeconomic and ecological reconstruction and the development of the region [27]. The number of museums in a city coincides with the city’s economic competitiveness (Figure 4a). This may be due to the agglomeration effect of economic activities in response to museum numbers [30]. Furthermore, the number of universities is consistent with the number of museums in a region, indicating a synergistic agglomeration effect of cultural services (Figure 4b). For the residents, the healthy life index and the livable competitiveness that directly relate to human well-being also positively relate to the number of museums (Figure 4c,d). The two indices integrate the income, public services, education, medical conditions, life expectancy, crime rate and living environment. This suggests that the cultural services of museums in a city are conducive to attracting talent and promoting city development. This win-win effect can be achieved more easily in large cities than in small cities for improvement of both the economy and cultural services to enhance social sustainability.
With socioeconomic development, public attention to museums is increasing. The definition of a museum by the ICOM has been updated eight times within half a century, in 1946, 1951, 1962, 1971, 1974, 2001, 2004, and 2007. Since the 2019 ICOM General Conference in Kyoto, a new definition has been discussed reflecting equality, human well-being and sustainability as carried out by museums [1]. This shows that the evolution of people’s understanding and demand for the services of museums frequently change with the rapid development of society. Meanwhile, public attention to a thing also varies along with social development [39][48]. In China, the first peak in the frequency of the word ‘museum’ occurred around 1949, when the People’s Republic of China was founded amid economic and cultural restoration, and the second peak occurred around 2011, when economic development began to accelerate (Figure 7). A valley in the word’s frequency was observed during a period with many political movements, when economic depressions and wars caused it to drop rapidly. This supports the existence of synergy between cultural development and economic and social development. The economy is the foundation of cultural development, while cultural development also promotes economic, social and ecological development [58][49]. Based on the frequency of the word in the newspaper, we can predict that Chinese people’s awareness of museums will increase greatly in the near future; thus, more museums need to be developed in provinces and cities to meet the demands of the people.
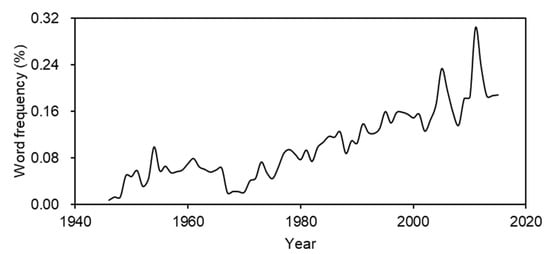
Figure 7. The frequency of the word ‘museum’ in the newspaper People’s Daily from 1946 to 2015.
References
- International Council of Museums. History of ICOM. 2021. Available online: https://icom.museum/en/ (accessed on 24 September 2021).
- Pietro, L.D.; Mugion, R.G.; Renzi, M.F.; Toni, M. An Audience-Centric Approach for Museums Sustainability. Sustainability 2014, 6, 5745–5762.
- Denton, K.A. Museums, Memorial Sites and Exhibitionary Culture in the People’s Republic of China. China Q. 2005, 183, 565–586.
- Chen, J.; Li, Y.; Liu, S.; Wang, T. Blue Book of China’s Economy; Social Sciences Academic Press: Beijing, China, 2011.
- Ministère de la Culture. Museéofile, Directory of Museums in France. 2021. Available online: http://traduction.culture.gouv.fr/url/Result.aspx?to=en&url=https://www.culture.gouv.fr/Espace-documentation/Bases-de-donnees (accessed on 24 September 2021).
- Museums Association. How Many Museums Are There in the UK? 2021. Available online: https://www.museumsassociation.org/about/faqs/ (accessed on 24 September 2021).
- Institute of Museum and Library Services. The Museum Data Files. 2018. Available online: https://www.imls.gov/research-evaluation/data-collection/museum-data-files (accessed on 1 October 2019).
- Tahmasbi, B.; Mansourianfar, M.H.; Haghshenas, H.; Kim, I. Multimodal accessibility-based equity assessment of urban public facilities distribution. Sustain. Cities Soc. 2019, 49, 101633.
- Kinsley, R.P. Inclusion in museums: A matter of social justice. Mus. Manag. Curatorship 2016, 31, 474–490.
- Zhang, H.; Xu, F.; Lu, L.; Yu, P. The spatial agglomeration of museums, a case study in London. J. Herit. Tour. 2017, 12, 172–190.
- Dadashpoor, H.; Rostami, F.; Alizadeh, B. Is inequality in the distribution of urban facilities inequitable? Exploring a method for identifying spatial inequality in an Iranian city. Cities 2016, 52, 159–172.
- Wang, S.; Zhang, Y.; Xu, Y.; Yan, S. A quantitative analysis of inequality of urban cultural space distribution in Xi’an. Sci. China Technol. Sci. 2019, 62, 502–510.
- Pun-Cheng, L.S.C. Distance Decay. In International Encyclopedia of Geography; John Wiley & Sons, Ltd.: New York, NY, USA, 2016; pp. 1–5.
- Drezner, T.; Drezner, Z.; Zerom, D. Facility Dependent Distance Decay in Competitive Location. Netw. Spat. Econ. 2020, 20, 915–934.
- Kabisch, N.; Haase, D. Green justice or just green? Provision of urban green spaces in Berlin, Germany. Landsc. Urban Plan. 2014, 122, 129–139.
- Raspadori, P. Inequality and culture: Geographical differences in the access to cultural enrichment in Italy (1863–1992). Contin. Chang. 2011, 26, 219.
- Hek, M.A.; Kraaykamp, G. Cultural consumption across countries: A multi-level analysis of social inequality in highbrow culture in Europe. Poetics 2013, 41, 323–341.
- Veal, A.J. Leisure, income inequality and the Veblen effect: Cross-national analysis of leisure time and sport and cultural activity. Leis. Stud. 2016, 35, 215–240.
- Lusseau, D.; Mancini, F. Income-based variation in Sustainable Development Goal interaction networks. Nat. Sustain. 2019, 2, 242–247.
- Olaiya, H.B.A. Transforming Our World: The 2030 Agenda for Sustainable Development & International Decade for People of African Descent. 2015. Available online: https://uwe-repository.worktribe.com/output/801754 (accessed on 24 September 2021).
- Moll, B.; Townsend, R.M.; Zhorin, V. Economic Development, Flow of Funds and the Equilibrium Interaction of Financial Frictions. Natl. Bur. Econ. Res. 2013, 114, 6176–6184.
- Brelsford, C.; Lobo, J.; Hand, J.; Bettencourt, L.M.A. Heterogeneity and scale of sustainable development in cities. Proc. Natl. Acad. Sci. USA 2017, 114, 8963–8968.
- Eliazar, I. Harnessing inequality. Phys. Rep. 2016, 649, 1–29.
- Wu, S.; Zheng, X.; Wei, C. Measurement of inequality using household energy consumption data in rural China. Nat. Energy 2017, 2, 795–803.
- Althoff, T.; Sosič, R.; Hicks, J.L.; King, A.C.; Delp, S.L.; Leskovec, J. Large-scale physical activity data reveal worldwide activity inequality. Nature 2017, 547, 336–339.
- Zhang, T.; Xu, Y.; Ren, J.; Sun, L.; Liu, C. Inequality in the distribution of health resources and health services in China: Hospitals versus primary care institutions. Int. J. Equity Health 2017, 16, 42.
- Lazzeretti, L. The resurge of the “societal function of cultural heritage”. An introduction. City Cult. Soc. 2012, 3, 229–233.
- Lazzeretti, L.; Capone, F. Museums as Societal Engines for Urban Renewal. The Event Strategy of the Museum of Natural History in Florence. Eur. Plan. Stud. 2015, 23, 1548–1567.
- Jung, S.; Jang, S. To cluster or not to cluster? Understanding geographic clustering by restaurant segment. Int. J. Hosp. Manag. 2019, 77, 448–457.
- Keuschnigg, M. Scaling trajectories of cities. Proc. Natl. Acad. Sci. USA 2019, 116, 13759–13761.
- Choi, A.; Berridge, G.; Kim, C. The Urban Museum as a Creative Tourism Attraction: London Museum Lates Visitor Motivation. Sustainability 2020, 12, 9382.
- Claudio-Pachecano, L.; Larralde, H. Agglomeration or separation: Store patterns through an optimal location model. Phys. A Stat. Mech. Its Appl. 2020, 542, 123366.
- Kim, Y.R.; Williams, A.M.; Park, S.; Chen, J.L. Spatial spillovers of agglomeration economies and productivity in the tourism industry: The case of the UK. Tour. Manag. 2021, 82, 104201.
- Bowitz, E.; Ibenholt, K. Economic impacts of cultural heritage—Research and perspectives. J. Cult. Herit. 2009, 10, 1–8.
- Stanziola, J.; Méndez-Carbajo, D. Economic growth, government expenditure and income: The case of museums and libraries in England. Cult. Trends 2011, 20, 243–256.
- Aratuo, D.N.; Etienne, X.L. Industry level analysis of tourism-economic growth in the United States. Tour. Manag. 2019, 70, 333–340.
- Qian, J.-H.; Yang, C.-H.; Han, D.-D.; Ma, Y.-G. Multi-scaling mix and non-universality between population and facility density. Phys. A Stat. Mech. Its Appl. 2012, 391, 5146–5152.
- Ensenat, E.C. Beyond City Size: Characterizing and Predicting the Location of Urban Amenities. Ph.D. Thesis, Massachusetts Institute of Technology, Cambridge, MA, USA, 2015.
- Meirelles, J.; Neto, C.R.; Ferreira, F.F.; Ribeiro, F.L.; Binder, C.R. Evolution of urban scaling: Evidence from Brazil. PLoS ONE 2018, 13, e0204574.
- Um, J.; Son, S.; Lee, S.; Jeong, H.; Kim, B.J. Scaling laws between population and facility densities. Proc. Natl. Acad. Sci. USA 2009, 106, 14236–14240.
- Zhao, R.; Zhong, S.; He, A. Disaster Impact, National Aid, and Economic Growth: Evidence from the 2008 Wenchuan Earthquake. Sustainability 2018, 10, 4409.
- Zhang, H.; Tao, Z. Evaluating China’s Paired-Assistance Policy (PAP) in Response to the Wenchuan Earthquake: A Sustainability Perspective. Sustainability 2018, 10, 3732.
- Huang, H.; Wei, Y.D. Spatial inequality of foreign direct investment in China: Institutional change, agglomeration economies, and market access. Appl. Geogr. 2016, 69, 99–111.
- Pop, I.L.; Borza, A. Factors Influencing Museum Sustainability and Indicators for Museum Sustainability Measurement. Sustainability 2016, 8, 101.
- Monteagudo-Fernández, J.; Gómez-Carrasco, C.J.; Chaparro-Sainz, Á. Heritage Education and Research in Museums. Conceptual, Intellectual and Social Structure within a Knowledge Domain (2000–2019). Sustainability 2021, 13, 6667.
- Xie, Y.; Zhou, X. Income inequality in today’s China. Proc. Natl. Acad. Sci. USA 2014, 111, 6928–6933.
- Rubin, J. (Ed.) TEA/AECOM 2018 Theme Index and Museum Index: The Global Attractions Attendance Report; Themed Entertainment Association (TEA): Burbank, CA, USA, 2019.
- Lansdall-Welfare, T.; Sudhahar, S.; Thompson, J.; Lewis, J.; FindMyPast Newspaper Team; Cristianini, N. Content analysis of 150 years of British periodicals. Proc. Natl. Acad. Sci. USA 2017, 114, E457–E465.
- Pumain, D.; Rozenblat, C. Two metropolisation gradients in the European system of cities revealed by scaling laws. Environ. Plan. B Urban Anal. City Sci. 2019, 46, 1645–1662.
More