Your browser does not fully support modern features. Please upgrade for a smoother experience.
Please note this is a comparison between Version 1 by Zheng Sun and Version 2 by Catherine Yang.
Histone deacetylase inhibitors (HDIs) are a class of prominent epigenetic drugs that are currently being tested in hundreds of clinical trials against a variety of diseases. A few compounds have already been approved for treating lymphoma or myeloma. HDIs bind to the zinc-containing catalytic domain of the histone deacetylase (HDACs) and they repress the deacetylase enzymatic activity.
- histone deacetylase inhibitors (HDIs)
- epigenomics
1. Introduction
Human histone deacetylases (HDACs) are categorized into four classes that are based on sequence homology [1]. Class I includes HDAC1, 2, 3, and 8; class IIa includes HDAC4, 5, 7, and 9; class IIb includes HDAC6, and 10; class IV includes HDAC11; and class III includes SIRT1-7 [1]. [1]Class I, II, and IV are canonical zinc-dependent HDACs and are simply referred to as HDACs in this review. Class III are NAD-dependent sirtuins that are more distantly related and they will not be discussed in this review. We shall keep in mind the following facts The while we discuss HDACs and histone deacetylase inhibitors (HDIs). (i) HDACs deacetylate not only histones, but also non-histone proteins [2][3] will be discussed[2,3]. (ii) In addition to deacetylation, HDACs can also catalyze other deacylation reactions, such as demalonylation, desuccinylation, or decrotonylation [4][5][6][4,5,6]. (iii) HDACs have enzyme-independent functions [7][8][9][10][7,8,9,10].
HDIs block HDAC enzyme activity by binding to the zinc ion in the catalytic site, which blocks substrate access to the site [11][12][11,12]. HDIs usually consist of a zinc binding group, surface binding group, and a linker that connects the above two components and spans the hydrophobic catalytic site channel [11][12][11,12]. HDIs can be categorized into groups that are based on their chemical nature [13][14][15][16][13,14,15,16]. Hydroxymates, such as suberoylanilide hydroxamic acid (SAHA) (vorinostat), TSA (trichostatin A), LBH589 (panobinostat), and PXD101 (belinostat), are pan-HDIs that inhibit all HDACs. Short-chain fatty acids, such as VPA (valproic acid) and butyrate, inhibit class I and IIa HDACs. Benzamides, such as MS275 (entinostat), and depsipeptides, such as FK228 (romidepsin), inhibit some of the class I HDACs. Cyclic tetrapeptide, such as TPX (trapoxin), target some class I, IIa and IV HDACs. ACY-1215 (ricolinostat) is a selective inhibitor for HDAC6 [13][14][15][16][13,14,15,16].
HDIs are being tested in over 500 clinical trials for treating many diseases, including cancers, heart diseases, diabetes, inflammatory diseases, and neurological diseases [17]. SAHA and FK228 have been approved for the treatment of cutaneous T-cell lymphoma (CTCL). PXD101 has been approved for peripheral T-cell lymphoma (PTCL), and LBH589 has been approved for multiple myeloma [18]. Most HDIs that are being tested currently are not specific to a specific HDAC. When considering that many HDACs are essential in development and physiology, such as metabolic processes [19][20][19,20], it is surprising that the nonspecific inhibition of the HDAC family could produce therapeutic effects for so many conditions. Here we review the recent non-biased studies using omics approaches (Figure 1) that provide insights into the mechanism of action for HDIs.
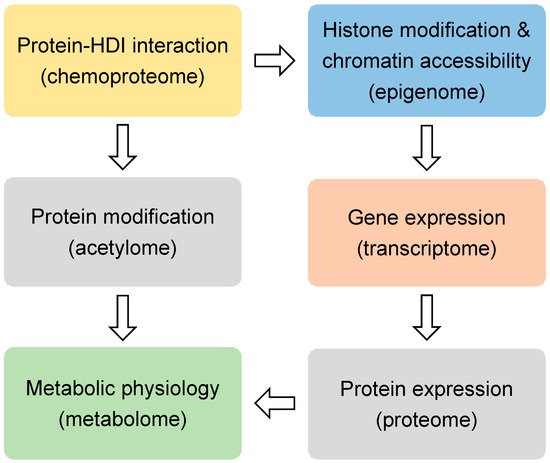
Figure 1. The omics approaches.
The omics approaches discussed in this review.
2. Epigenomic Effects of HDIs
Histones are the classical substrates for HDACs. HDIs are expected to upregulate histone acetylation levels, remodel chromatin accessibility, and upregulate gene expression. This speculation has proved to be an oversimplification by recent studies. Western blot analysis of total histone extracts can detect altered histone acetylation after HDIs treatment. However, the western blot results can be misleading, since different regions of the chromatin are differentially altered by HDIs, especially when considering that only a small fraction of the transcriptome is altered by HDIs in any given condition [21]. Chromatin immunoprecipitation (ChIP) can assess localized change of histone acetylation on the genome. Briefly, the protein-DNA complexes are cross-linked followed by fragmentation of genome DNA through sonication or enzyme digestion. Protein-bound DNA fragments are enriched with immunoprecipitation using antibodies specific for modified histones or other chromatin-binding proteins. The protein-bound genome DNA fragments are then analyzed by microarray hybridization analysis (ChIP-chip) [22] or massive parallel sequencing (ChIP-seq) [23]. Chromatin structures can range from a more open status generally associated active gene transcription to a more closed status that is associated with transcriptional silence. Open chromatin regions, which are generally enriched with regulatory cis-elements, are often free of nucleosomes and more accessible to DNA digestive enzymes or transposases. Therefore, chromatin accessibility can be assessed by DNase I, restriction enzyme (RE), or micrococcal nuclease (MNase) digestion combined with sequencing (DNase-seq or MNase-seq), formaldehyde-assisted isolation of regulatory elements (FAIRE-seq), and assay for transposase-accessible chromatin while using sequencing (ATAC-seq) [24] (Figure 1 and Table 1).
Table 1. Epigenomics (blue), transcriptomics (orange), proteomics (gray), metabolics (green), and chemoproteomics (yellow) studies of histone deacetylase inhibitors (HDIs). Cells are from human origin unless otherwise indicated.
| Analysis | HDI | Cell or Tissue | Reference |
|---|
| H3 and H4 ChIP-chip | butyrate and TSA | hepatocarcinoma HepG2 cells and colon adenocarcinoma HT-29 cells | [25] |
| DNase-seq | butyrate and SAHA | K562 myelogenous leukemia cells | [26] |
| MNase-seq | ACY1035 | BCR-ABL1-expressing leukemic cells SupB15 | [27] |
| MNase-seq | VPA | HT-29 colon cancer cells | [28] |
| ATAC-seq, DNA methylation BeadChip and RNA-sequencing | LBH589 | triple-negative breast cancer cell lines HCC1806 and MDA-MB-231 | [29] |
| ATAC-seq | SAHA or FK228 | cutaneous T cell lymphoma tissue | [30] |
| ChIP-seq | SAHA and MS275 | human primary foreskin melanocytes HMEL-BRAFV600E and PMEL-BRAFV600E cells | [31] |
| ChIP-qPCR | SAHA | MCF-7 breast cancer cells | [32] |
| HT-FAIRE | AR-42, SAHA, and LBH589 | Ewing sarcoma patient-derived EWS894 and EWS502 cells | [33] |
| H4K5/K8/K12/K16ac ChIP-seq and RNA-seq | SAHA | osteoblast MC3T3 cells | [34] |
| ChIP-seq, MBD-seq and RNA-seq | TSA and SAHA | primary vascular endothelial cells HAECs | [35] |
| H4K16/H3K9/K27ac and H3K27me3 ChIP-seq | VPA and SAHA | GM12878 and AH-LCL lymphoblastoid cells | [36] |
| H3K9Ac ChIP-seq and microarray | abexinostat | mesenchymal or stromal stem cells (hMSCs) | [21] |
| H3K9ac/K14ac ChIP-chip | phenylbutyrate | wild-type and R6/2 mouse liver | [37] |
| H3K9/K14ac ChIP-seq | TSA | mouse heart tissue | [38] |
| Nuclease accessibility sequencing (NA-seq) | TSA | fibro-adipogenic progenitors (FAPs) from mdx mice | [39] |
| ATAC-seq | TSA and butyrate | dendritic cells | [40] |
| microarray | SAHA | acute promyelocytic leukemia NB4 cells | [41] |
| microarray | TSA | T lymphoblastoid leukemic CCRF-CEM cells and promyelocytic HL-60 cells | [42] |
| microarray | ACY1035 | MV-4-11 acute myeloid leukemia cells | [43] |
| microarray | VPA, SAHA and TSA | promyelocytic leukemia HL60 cells | [44] |
| microarray | VPA and SAHA | GM12878and AH-LCL lymphoblastoid cells | [36] |
| microarray | TSA | primary T cells | [45] |
| microarray | SAHA and FK228 | acute T cell leukemia cell line CEM cells |
[46] |
| miRNA microarray | SAHA and LBH589 | My-La, HH, and HUT78 cutaneous T-cell lymphoma cells | [47] |
| microarray | LBH589 | cutaneous T-cell lymphoma tissue | [48] |
| miRNA-seq and mRNA-seq | VPA | mouse B cells | [49] |
| RNA-seq | TSA | SK-MEL-3 melanoma Cells | [50] |
| single-cell RNA-seq | ACY-1215 | tumor-infiltrating T cells from mice harboring KrasG12D concurrent with P53 loss (KP) and tumor-associated macrophages among myeloid cell populations | [51] |
| microarray | TMU-35435 | MRC5 and IMR90 lung cancer cells | [52] |
| microarray | butyrate | H460 lung cancer cells | [53] |
| RNA-seq | ACY-1215 | SCLC NCI-H69 xenograft tumors carried by athymic nude mice | [54] |
| microarray | FK228 | esophageal cancer cell lines T.Tn and TE2 | [55] |
| microarray | TSA and CG-1521 | LNCaP prostate cancer cells | [56] |
| microarray | SAHA and LBH589 | HCT116 and HT29 colon cancer cells | [57] |
| splicing-sensitive microarray | butyrate | HeLa cervical cancer cells | [58] |
| RNA-seq | butyrate | bovine epithelial cells | [59] |
| miRNA microarray | TSA | MCF-7TN-R breast cancer cells | [60] |
| TempO-seq | TSA | MCF-7 breast cancer cells | [61] |
| microarray | UF010 | MDA-MB-231 triple-negative breast cancer cells | [62] |
| GRO-seq | TSA | BT474 breast cancer cells | [63] |
| RNA-seq | quisinostat | SYO-q, FUJI, YaFuss, HS-SY-II, MoJo, Yamato-SS synovial sarcoma cells | [64] |
| microarray | PXD101 and LBH589 | BHP2-7 thyroid cancer cells |
[65] |
| microarray | SAHA | ACTH-secreting tumor cells AtT-20 | [66] |
| RNA-seq and ChIP-seq | FK228 | pancreatic ductal adenocarcinoma cells L3.6, BxPC3 and Panc1 | [67] |
| RNA-seq | SAHA | Patient-derived glioma stem cells | [68] |
| microarray | compound 106 | brain, cerebellum, and heart of wild type and KIKI mice | [69] |
| microarray | MS275 | mouse nucleus accumbens tissue | [70] |
| microarray | TSA, SAHA and VPA | mouse macrophages and dendritic cells | [71] |
| microarray | SAHA | rat dental pulp cells | [72] |
| microarray | 2-ethyl-4-methylpentanoic acid, VPA and (S)-2-pentyl-4-pentynoic acid | undifferentiated R1 mouse embryonic stem cell | [73] |
| ChIP-seq and RNA-seq | SAHA | neuronal and non-neuronal cells of the hippocampal region and liver in mouse model |
[74] |
| microarray | HDACi 4b | mouse brain and muscle tissue | [75] |
| microarray, small RNA-seq and miR-HTS | TSA | fibro-adipogenic progenitors from mdx mice | [39] |
| LC-MS/MS | SAHA | wild-type and patient NPC1I1061T fibroblasts |
[76] |
| SILAC and HSMS | FK228 | esophageal squamous cell carcinoma EC109 cells | [77] |
| SILAC | SAHA and VPA | acute myeloid leukemia HL60 cells | [78] |
| MS acetylome | 19 HDIs | HeLa cervical cancer cells | [79] |
| MS metabolomics | Butyrate and TSA | colorectal adenocarcinoma HT29 cells | [80] |
| NMR | compound i8, i10, i12, SAHA, TSA and nicotinamide | glioblastoma cell lines U373 and LN229 | [81] |
| LC/GC-MS/MS | LBH589 | plasma from diffuse large B-cell lymphomas (DLBCL) patients and DLBCL cell line OCI-Ly1 and OCI-Ly7 | [82] |
| affinity capture > MS | 16 HDIs | K562 myelogenous leukemia cells, Jurkat E6.1 cells, and Ramos lymphoma cells | [83] |
| affinity capture > MS | tacedinaline | K562 myelogenous leukemia cells | [84] |
| beads MS | SAHA | HeLa cervical cancer cells | [85] |
| multidimensional protein identification technology (MudPIT) | compound 106 | Friedreich’s ataxia patient iPSC-derived neural stem cells | [86] |
3. Transcriptomic Effects of HDIs
Regardless of the upstream epigenomic mechanisms, it is generally believed that HDIs-induced changes in gene expression are ultimately responsible for their therapeutic effects in a variety of conditions. The question is what downstream gene, or network of genes, mediate the therapeutic effect of HDIs. Transcriptome profiling with microarray and RNA-seq have been performed in many studies to address this question (Figure 1). In addition to profiling the expression levels of the mature protein-coding mRNA levels, different flavors of RNA-seq techniques were also used to analyze alternative splicing forms and specific populations of RNA. miRNA-seq is specialized in detecting the small noncoding microRNA levels. Global nuclear run-on sequencing (GRO-seq) uses isolated nuclei in run-on reactions in the presence of bromouridine (BrUTP) and sarkosyl, a chemical that prevents the attachment of RNA polymerase to DNA. Thus, only pre-existing RNA polymerase on the DNA can produce new BrU-labeled transcripts, which are subsequently enriched with anti-BrU beads and analyzed by sequencing. Therefore, GRO-seq detects nascent RNA transcription (Table 1).
4. Proteomic and Acetylomic Analysis of HDIs
It is conceivable that the epigenomic and transcriptomic changes elicited by HDIs need to be ultimately manifested at the protein level for the downstream target genes in order to have a physiological effect (Figure 1). The mass spectrometry (MS)-based approaches have been used to profile the proteomic changes that were caused by HDIs in several studies. Non-labeling and a variety of labeling methods have been developed for quantification. Stable isotope labeling by amino acids in cell culture (SILAC) uses cell culture medium that contains amino acids labeled with stable heavy isotopes. When combined with non-labeled cells for MS analysis, chemically identical peptides with different isotope composition can be distinguished, and their relative abundance reflects the relative abundance of the two proteins [87][89]. This method allows for a more accurate quantification when compared to the non-labeling methods. In addition to histone acetylation, HDIs may affect acetylation of many non-histone proteins, including transcription factors and co-factors [88][89][90][90,91,92]. The acetylome approach uses immunoprecipitation with pan-anti-acetylated lysine antibodies to enrich the acetylated peptides from the total peptides of a biological sample. The subsequent MS analysis allows for comprehensive detection and quantification of acetylated proteins [91][93] (Table 1).
Impaired cholesterol efflux from the late endosomal/lysosomal (LE/L) compartment characterizes Niemann–Pick type C (NPC) disease. SAHA can restore the cholesterol level in NPC patient-derived NPC1I1061T fibroblast cells. An isobaric labeling-based quantitative proteomic profiling of fibroblasts identified a total of 202 proteins differentially expressed in SAHA-treated fibroblasts versus vehicle control. Gene ontology and pathway analysis showed that most of the 202 genes were mapped to metabolic pathways, and about one-third of the genes were mitochondria-associated. 132 proteins were upregulated, while 70 were downregulated after SAHA treatment. Lysosomal acid lipase (LIPA) was particularly interesting, because it played an essential role in mediating cholesterol efflux in NPCI1061T fibroblasts [76].
In esophageal squamous cell carcinoma EC109 cells that were treated with FK228, SILAC-based proteomic analysis identified that FK228 altered acetylation levels on 87 lysine sites from histone and altered the protein levels of 3,515 proteins. Among the 3515 proteins, 675 proteins showed an upregulation of lysine acetylation levels, and 186 proteins showed downregulated acetylation levels. Gene ontology (GO) analysis revealed that the many proteins involved in type I interferon signaling pathway and the protein stability regulation were upregulated by FK228, whereas those that were associated with intermediary metabolism and hormone biosynthesis were downregulated. Enrichment analysis of the molecular functions revealed that the actin-binding and metal-binding proteins were upregulated. Proteins related to oxidoreductase or aldo–ketoreductase activities were downregulated [77].
In acute myeloid leukemia (AML) HL60 cells that were treated with SAHA and VPA, a combination of SILAC, anti-acetyl-lysine affinity enrichment, and liquid chromatography-tandem mass spectrometry (LC-MS/MS) approaches identified 5775 proteins and 1124 lysine acetylation sites as responsive to SAHA or VPA treatment. SAHA upregulated 323 proteins and downregulated 452 proteins, whereas VPA upregulated 359 proteins and downregulated 426 proteins. GO-based classification showed similar distribution between SAHA and VPA regarding the ontology of biological process, cellular component, and molecular function. Molecular function-based clustering showed that VPA upregulated proteins involved in the phosphatidylinositol phosphate phosphatase activity and cargo receptor activity, whereas it downregulated the proteins that were involved in cysteine-type endopeptidase inhibitor activity, phosphoprotein binding, and isocitrate dehydrogenase activity. In the cellular component category, VPA upregulated proteins that were involved in plasma lipoprotein particle, and transcription regulation related protein complexes, such BAF and SWI/SNF complexes, while SAHA upregulated proteins involved in vesicular transportation and transmembrane transportation. A clustering analysis based on KEGG pathway showed that leukocyte trans-endothelial migration, lysosome, platelet activation, and apoptosis were the dominant pathways that were enriched in the upregulated proteins by both VPA and SAHA, while many amino acid metabolism pathways were enriched in the downregulated proteins by both VPA and SAHA. For acetylome profiling, VPA upregulated acetylation levels on 186 lysine sites of 164 proteins and downregulated acetylation levels on 135 lysine sites of 104 proteins. SAHA upregulated acetylation levels on 139 sites of 124 proteins and downregulated 94 sites of 88 proteins. Proteins with differential acetylation levels upon VPA and SAHA treatment show similar distribution based on GO and subcellular location analysis. Protein–protein interaction network analysis revealed that top nodes in HDIs-induced interactome were heat shock proteins, protein chaperones, ribosome proteins, ATP-citrate synthase, and small nuclear ribonucleoproteins [78].
In HeLa cells that were treated with 19 different HDIs, SILAC based quantitative mass spectrometry was used to profile acetylation change. For all HDIs except sirtinol, more lysine sites showed upregulated acetylation levels than the sites with downregulated acetylation levels. Interestingly, most HDIs increased the acetylation level above the threshold on only a small fraction (average 6.2%) of the quantified sites, including sites on histones and non-histone proteins. Genetic studies showed that nicotinamide worked through the inhibition of SIRT1, while tubacin and bufexamac worked through inhibition of HDAC6 [79].
In summary, HDIs not only alter the proteomic profile, they also alter the acetylomic profile on histone and non-histone proteins. HDI-altered proteins were enriched in metabolism, immune responses, intracellular protein trafficking, and protein quality control.
5. Metabolomic Effects of HDIs
Metabolic changes are recognized as a hallmark of cancer [92][94]. Many HDACs are known to regulate the metabolism of nucleotides, lipids, carbohydrates, amino acids, and other intermediates [93][94][95][95,96,97] (Figure 1). With the recent development of the nuclear magnetic resonance (NMR) or MS-based metabolomics methods, profiling of the metabolic changes in response to HDIs has been performed. In addition to the static snapshot profiling, stable-isotope tracers can also be used to analyze the kinetic flux through a variety of metabolic pathways, an approach that is sometimes referred to as fluxomics [96][98] (Table 1).
To characterize the role of HDIs in cell differentiation, a tracer-based metabolomics approach was carried out in human colorectal adenocarcinoma HT29 cells with the treatment of butyrate or TSA. [1,2-13C2]-d-glucose was used as a tracer to measure the metabolic flux through glycolysis, the pentose phosphate pathway (PPP), and the Krebs cycle. Butyrate and TSA decreased glycolysis, the use of the oxidative branch of the PPP, and pyruvate dehydrogenase contribution. TSA and butyrate induced similar metabolic profiles and induced the differentiation of HT29 cells, which was different from the metabolic effects of acetyl-CoA precursors. When considering that butyrate itself is an endogenous precursor for acetyl-CoA, these data suggest that the metabolic change of butyrate is mainly due to its HDI activity, rather than a precursor of acetyl-CoA. The study also suggests a potential connection between HDIs-induced metabolic changes and cell differentiation [80].
Proton nuclear magnetic resonance (1H-NMR) metabolomics analysis was performed in glioblastoma U373 and LN229 cell lines that were treated with SAHA, TSA, HDACIIb inhibitor tubastatin A (TUBA), some novel HDIs (i8, i10, or i12), or the SIRT inhibitor nicotinamide (NAM). Both the intracellular and extracellular metabolites were measured. The intracellular metabolites showed a distinct pattern between U373 and LN229 cells. The LN229 cells showed major metabolic changes in cellular metabolism and metabolite transport upon treatment with i8, i10, i12, SAHA, or TUBA. LN229 cells that were treated with SAHA showed drastic differences in intracellular profiles, including elevated levels of lactate, glucose, and TCA cycle intermediates. The treatment of LN229 cells with i8, i10, or i12 also changed choline-related metabolites. However, for the intracellular metabolites from U373, only isocitrate showed significant changes, suggesting that metabolic profiles inside of the U373 cells were relatively unaffected by SAHA. Interestingly, HDIs altered the extracellular metabolites from the U373 cell culture medium, which suggests an increase of metabolite transport to or from the extracellular medium. These findings showcased the heterogeneous responses to HDIs among the different cell lines [81].
To determine the metabolic effects of HDIs on diffuse large B-cell lymphoma (DLBCL), untargeted MS-based metabolomic analysis was performed on plasma samples from patients that were treated with LBH589. LBH589 upregulated several sulfated steroids and bile acids in a xenobiotic metabolism pathway. LBH589 downregulated metabolites branched chain amino acids (BCAA) and betaine, which is an atypical amino acid derived from the oxidation of choline. The further metabolomic analysis in DLBCL cell lines OCI-Ly1 and OCI-Ly7 revealed that LBH589 upregulated many metabolites in the betaine-choline pathway, including choline, cytidine diphosphate, CDP-choline, and 1-oleoylglycerophosphocholine. Gene expression analysis revealed the upregulation of choline kinase α (CHKA) and phosphocholine cytidylyltransferase (PCYT1A) in DLBCL cell lines that were treated with LBH589. Further functional study regarding CHDA inhibition or knockdown demonstrated that targeting the choline pathway increased the anti-cancer effect of HDIs in DLBCL [82].
In cultured pancreatic cancer BxPC3 cells and hepatocellular cancer Hep1 cells, 1H-, 13C-, and 31P-NMR spectroscopy with [1–13C]-glucose tracer did not identify any prominent changes in cell metabolism after treatment with PXD101 [97][99]. In rats that were treated with HDIs, gas chromatography-mass spectrometry analysis of the serum revealed that SAHA upregulated urea, oleic acid, and glutaconic acid, whereas it downregulated octadecanoic acid, pentadecanoic acid, glycerol, propanoic acid, and uric acid [98][100]. MGCD0103, another HDI, downregulated alanine, isoleucine, and leucine levels in the serum [99][101].
In summary, HDIs can alter the metabolism of amino acids, choline, or carbohydrates, which may contribute to their therapeutic or toxic effects in different tissues.
6. Chemoproteomic Analysis of HDIs
Regardless of the downstream epigenomic, transcriptomic, proteomic, or metabolomic changes that HDIs may cause, it is conceivable that HDIs must have physical interactions with their direct targets. Small molecules are notoriously promiscuous, and it is possible that HDIs could bind to many proteins and alter their functionality, in addition to HDACs. Chemoproteomic approaches with chemical probes allow the systemic identification of proteins bound to a small molecule. These methods have been used to profile HDI-interacting proteins in several studies (Table 1).
The HDIs affinity probes were synthesized by conjugating sepharose to analogs of SAHA or class I and class II-selective HDI givinostat. After exposing the probe with protein extracts from the myelogenous leukemia K562 cells, the captured proteins were quantified with mass spectrometry. Competition analysis with HDIs was then performed to reduce the binding affinity of each HDI with the identified binding proteins, generating a dataset composed of 16 HDIs with over 1000 proteins. Immunofluorescence analysis of acetylated histones or tubulin further validated the range of activity for several HDIs, as determined in the chemoproteomic analysis. Class IIa HDACs were not identified in the assay, which is consistent with their low affinity to hydroxamate and lack of catalytic activities due to a missense mutation in the catalytic pocket [100][102]. The anti-inflammatory drug bufexamac was identified as a novel HDI targeting class IIb HDACs. The approach also identified the interaction between some HDIs with many non-HDAC proteins that do not appear to be in any HDAC protein complexes [83]. The chemoproteomics-based competition analysis with the same chemical probe was later used to characterize the binding kinetics property of different HDIs with endogenous protein lysates from K562 cells [84]. As is consistent with the previous assays with recombinant HDAC proteins [12], aminobenzamides showed slower binding kinetics with HDACs-containing protein complexes when compared to hydroxamates [84].
A similar approach from a separate study with SAHA-coated sepharose beads and HPLC-MS/MS identified 58 proteins as potential SAHA binding proteins in the HeLa cell lysates. 35 proteins were found as HDAC complex components. Gene ontology analysis showed that 23 proteins were metabolic enzymes, four proteins were involved in cell cycle regulation and differentiation, and two proteins were chaperones. A glucose metabolism enzyme ENO-1 was identified as a novel SAHA-binding protein and may be a target of HDIs [85].
In summary, HDIs can interact with a variety of protein and protein complexes, including those that are not directly associated with HDACs. Their profile of interacting proteins tends to be different for different HDIs.