Mycoplasma genitalium Provokes Seminal Inflammation: Comparison
Please note this is a comparison between Version 1 by Stanislav Tjagur and Version 2 by Rita Xu.

Background: The impact o invesf sexually transmitted infections (STI) on male fertility is controversial.

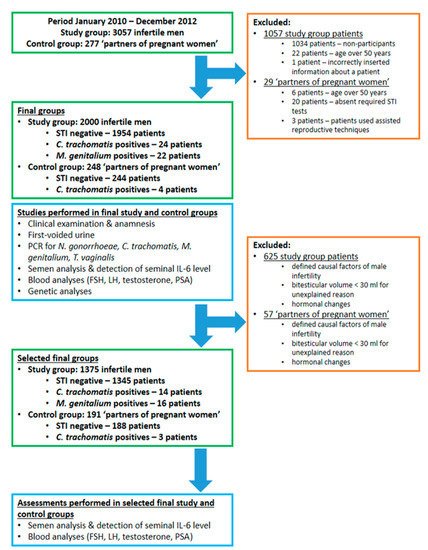
Aims: To investigate the prevalence of urethritis-associated STIs (chlamydia, gonorrhoeae, Mycoplasma genitalium, trichomoniasis) among infertile males; to analyze the effect of STIs on semen parameters and blood PSA. Case-control study. Study group (n = 2000): males with fertility problems or desire for fertility check. Control group (n = 248): male partners of pregnant women.

Analyses: polymerase chain reaction for STI, seminal interleukin 6 (IL-6), semen and fractionated urine, blood analyses (PSA, reproductive hormones). The prevalence of M. genitalium and chlamydia in the study group was 1.1% and 1.2%, respectively.

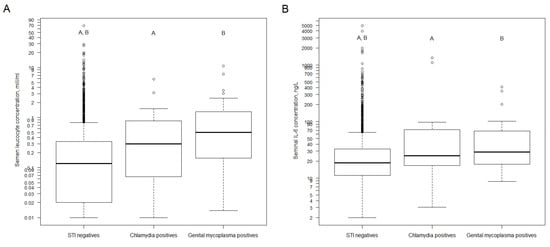
Results: The prevalence of chlamydia in the control group was 1.6%, while there were no M. genitalium cases. No cases with gonorrhoeae or trichomoniasis or combined infections were observed in neither group. There was a higher seminal concentration of neutrophils and IL-6 among M. genitalium positives compared with STI negatives. There was a trend toward a lower total count of spermatozoa and progressive motility among STI positives. No impact of STIs on PSA was found.

Conclusions: The prevalence of STIs among infertile males is low. M. genitalium is associated with seminal inflammation. The impact of STIs on semen parameters deserves further investigations.

  • sexually transmitted infections
  • sperm functions
  • male
  • infertility
  • Mycoplasma genitalium

1. Introduction

Infertility is defined as the inability of a couple to become pregnant despite unprotected intercourse for a period of more than twelve months [1]. The prevalence rate of infertility varies from 3.5% to 16.7% in more developed countries and from 6.9% to 9.3% in less-developed countries, with an estimated overall median prevalence of 9% [2]. In 50% of involuntarily childless couples, a male infertility-associated factor is found usually together with abnormal semen parameters [3].
Urogenital infections and inflammation are accepted contributing factors of male infertility in 6.9 to 16% of men [4][5][4,5]. Inflammation and oxidative stress could serve as core mechanisms linking STI with male infertility [6]. The impact of sexually transmitted infections (STI) on male fertility is a controversial topic. According to Ochsendorf et al., depending on the local prevalence of STIs and the availability of medical care, the impact of STIs on male urogenital system and fertility (as a consequence of infection) may appear regionally different [7]. Another problem is the distinction of the impact of STI agents between infection with pathological consequences and contamination without relevance [7]. Inconsistent diagnostic criteria applied to date could also explain the controversy about the role of infection and inflammation in the genital tract as a cause of infertility [8]. For example, using detection methods for Chlamydia trachomatis other than nucleic acid amplification tests (NAAT) including culture or serological methods is of significant concern. Culture for C. trachomatis detects only viable infectious chlamydial elementary bodies and the sensitivity is at most 70–85%. The major drawback of serological tests for C. trachomatis is that a positive antibody test will not distinguish a previous from a current infection [9].
Ahmadi et al. published a systematic review and meta-analysis on the association of C. trachomatis with infertility and clinical manifestations. The authors concluded that urogenital C. trachomatis prevalence was significantly higher in the infertile men compared with the fertile men (overall odds ratio 2.2, 95% confidence interval 1.3–3.7) and in symptomatic men compared with asymptomatic men (overall odds ratio 4.9, 95% confidence interval 1.1–21.7). However, the authors guided the attention to the fact that many studies were excluded from the analyses because the detection method was other than NAAT. This may suggest participation bias in the generalization of the meta-analysis results. Secondly, the number of included studies in males in both the fertile-infertile and the symptomatic-asymptomatic groups was fewer than 10 and therefore insufficient for a good meta-analysis and an accurate conclusion [10].
Less is known about the association between male infertility and other STIs. There is only limited information about the role of Trichomonas vaginalis in male infertility [11]. The lack of studies on Neisseria gonorrhoeae is likely due to the rarity of this infection in developed countries [12]. Little work has been carried out on the possible effects of the newest STI-causing agent Mycoplasma genitalium on male infertility, too [13][14][13,14]. To sum up, the association between STIs and male infertility still needs additional investigations, especially concerning M. genitalium.

2. Basic Clinical and Semen Parameters of Study Subjects

The basic parameters of study subjects are presented in Table 1.
Table 1. Basic and semen parameters of the unselected study and control groups (without exclusion of patients for hormonal, testicular volume, and infertility causal factors).
Parameter Study Group, Infertile Men (n = 2000) Control Group, Fertile Men (n = 248) p-Value
In the first part of our study, we aimed to describe the prevalence of STIs among fertile and infertile patients.
The prevalence of STIs was 2.3% in the infertility group and 1.6% in the control group. Among the infertility group patients, there were 22 men with M. genitalium and 24 men with C. trachomatis that comprise 1.1% and 1.2% prevalence, respectively (Table 1). The prevalence of C. trachomatis among control group patients was 1.6% while no cases with M. genitalium were found. There were no cases with N. gonorrhoeae, T. vaginalis, or combined infections in neither group. Interestingly, we found two C. trachomatis cases with reported acute orchitis in anamnesis that may suggest reinfection or untreated STI condition.

4. Impact of STI on Inflammation in Semen

For the second step, we aimed to describe the association of STIs with inflammation in male genital tract.
We made the following analyses of both infertile and fertile groups together because the total number of STI-positive patients among fertile patients was considerably low (only four C. trachomatis cases). The association of M. genitalium and C. trachomatis with semen neutrophils’ concentration and IL–6 concentration is shown in Figure 1A,B, respectively. Both markers were statistically higher for C. trachomatis and M. genitalium-positive patients compared with STI-negative patients.
We also tried to find the best cut–off value to predict C. trachomatis and/or M. genitalium infection using semen concentration of neutrophils as a descriptive variable. Using different previously proposed [15][16][15,16] cut-off levels for seminal neutrophils’ concentrations, the proportion of STI-positive/negative patients changed but not significantly.
We found the best cut-off value for semen neutrophils’ at a concentration of 0.28 mill/mL for predicting C. trachomatis and/or M. genitalium infection with sensitivity 58.0%, specificity 71.3%, positive prognostic value 1.3%, negative prognostic value 95.6%, and area under the curve 0.691. For seminal IL-6, the optimal cut-off value predicting presence or absence of C. trachomatis and/or M. genitalium infection was 17.5 ng/L with sensitivity 75.5%, specificity 47.8%, positive prognostic value 1.2%, negative prognostic value 96.8%, and area under the curve 0.644.
Figure 1. (A). Distribution of semen leucocyte concentration by sexually transmitted infection status (both unselected fertile and infertile group, without exclusion of patients for hormonal, testicular volume, and infertility causal factors). (B). Distribution of seminal plasma IL-6 concentration by sexually transmitted infection status (both fertile and infertile group, without exclusion of patients for hormonal, testicular volume, and infertility causal factors). Abbreviations: STI—sexually transmitted infections. Data for semen leucocyte concentration are not available for five patients. Data for seminal plasma IL-6 are not available for 65 patients. Mann–Whitney U test with Bonferroni correction for two tests (STI negatives vs. Chlamydia positives, STI negatives vs. Genital mycoplasma positives). For subfigure A: A—p-value < 0.001, B—p-value = 0.007. For subfigure B: A,B—p-value = 0.01. For subfigure B: A,B—y-axis is natural logarithm scale.

5. Impact of STI on Blood PSA and Semen Quality

In the third part of our study, we aimed to reveal the association of particular STI agents with the quality of semen parameters and blood PSA level. The selection of the data was performed to avoid possible confounding before analysis.
To eliminate possible confounding with known factors influencing semen quality and reproductive hormone levels, we excluded 625 male patients from the main study group and 57 male patients from the main control group additionally. The reasons and order of decision to eliminate study subjects additionally were defined according to the following criteria: (I) defined causal factors of male infertility according to Punab et al. [5]: genetic causes, secondary hypogonadism, congenital anomalies: systemic and/or in urogenital tract, serious sexual dysfunctions, oncological diseases, seminal tract obstruction, other testicular factors that include acquired testicular damage (TD) [exposure to high dose radiation in Chernobyl, testis trauma with volume change, mumps orchitis, other orchitis, epididymitis, testicular torsion, hernia operation with ipsilateral TD, epididymal cyst operation with ipsilateral TD, hydrocele operation with ipsilateral TD, other testis operation with ipsilateral TD] and secondary testicular damage [anabolic steroids, medication (salasopyrin, trexan), status diagnosed post kidney transplantation]; (II) bitesticular volume < 30 mL for unexplained reason; (III) hormonal changes: FSH ≥ 8.0 U/L and/or LH > 9.4 U/L and/or FSH < 1.0 U/L and/or LH < 1.0 U/L and/or total testosterone < 10.5 nmol/L).
After performing the abovementioned exclusion, there remained 1345 STI-negative, 14 C. trachomatis-positive and 16 M. genitalium-positive patients in the selected infertility group and 188 STI-negative and three C. trachomatis-positive patients in the selected control group (Figure 2).
Figure 2.
Description of the study protocol. Abbreviations: STI—sexually transmitted infections.
In this step of the study, we decided not to combine patients from the selected infertility and control groups to avoid possible bias of the results. As the total number of STI-positive patients in the selected control group was low (only three C. trachomatis-positive patients), we performed all the following calculations for the selected infertile group’s patients only.
After performing the abovementioned data correction, we did not reveal any impact of M. genitalium and C. trachomatis on blood levels of PSA.
The semen parameters of the selected infertility group’s patients according to STI status (Figure 1) are presented in Table 2.
Generally, STI-positive patients (both C. trachomatis and M. genitalium cases) had significantly lower total counts of spermatozoa and total counts of spermatozoa with progressive motility compared to STI-negative patients (Table 2). The count of spermatozoa with normal morphology was also lower among STI-positive patients, however, the observed difference was over the significance level.
Table 2. Impact of C. trachomatis, M. genitalium, and their combination on semen parameters (selected infertile group only, after exclusion of patients for hormonal, testicular volume, and infertility causal factors).
Parameter STI Negative

n = 1345
Either C. trachomatis or M. genitalium Positive

n = 30
STI Negative vs. Either M. genitalium or M. genitalium Positive,

p-Value
$$ C. trachomatis Positive

n = 14
STI Negative vs. C. trachomatis Positive,

p-Value
$$, M. genitalium Positive

n = 16
STI Negative vs. M. genitalium Positive,

p-Value
$$,
Median (Range);

25th Centile; 75th Centile
Median (Range);

25th Centile; 75th Centile
Basic parameters
Abstinence before semen analysis, in days 4.0 (0.0–56.0);

3.0; 4.0
4.0 (1.0–7.0);

3.0; 5.0
0.920 3.5 (2.0–7.0);

2.0; 7.0
0.186 4.0 (1.0–7.0);

2.8; 5.0
0. 191
Age in years 32.5 (18.2–49.8);

32.3 to 32.8
$
Volume of seminal fluid, in mL 4.1 (0.8–40.0);

3.0; 5.2
31.8 (20.0–50.0);

31.1 to 32.6
$ 0.081 ###
4.1 (1.8–9.0);

3.4; 5.3 0.812 3.7 (1.8–9.0);

3.6; 4.2
0.188 4.4 (1.8–6.9);

3.0; 5.4
0.159 STI status
Concentration of spermatozoa, M/mL 56.0 (0.0–440.0);

30.0; 94.5
47.0 (1.3–210.0);

9.1; 69.8
0.034 49.0 (1.3–110.0);

17.1; 51.5
0.164 36.5 (1.3–210.0);

7.1; 95.0
0.396
Patients without STI
1954 (97.7%) 244 (98.4%)
Total count of spermatozoa, in M 226.2 (0.0–2432.0);

110.4; 372.8
0.649 ##
151.0 (2.3–1113.0);

39.6; 303.1 0.028 169.5 (10.1–405.0);

55.9; 201.2
0.132 134.4 (2.3–1113.0);

42.0; 444.8
0.380
C. trachomatis and M. genitalium positive patients together
46 (2.3%) 4 (1.6%) 0.649 ##
47 (0–83);

35; 57
A 41 (0–71);

23; 57
0.187 48 (0–71);

39; 58
Spermatozoa with progressive motility, % 0.167 34 (3–64);

19; 57 0.088
C. trachomatis positive patients
24 (1.2%) 4 (1.6%) 0.541 ##
Total count of spermatozoa with progressive motility, in M 101.8 (0.0–1056.0);

44.3; 186.7
A 68.6 (0.0–489.7);

9.3; 156.6
0.034 75.9 (0.0–281.2);

22.8; 113.9
0.356 50.7 (0.3–489.7);

6.4; 202.5
0.194
M. genitalium positive patients
22 (1.1%) 0 (0.0%)
Spermatozoa with normal morphology, % 8 (0–53);

4; 12
B0.162 ##
5 (0–24);

2; 24 0.242 8 (0–22);

3; 14
0.188 4 (0–24);

2; 10
0.184 Bitesticular volume, in mL-s 45.0 (0.0–100.0);
Total count of spermatozoa with normal morphology, in M

44.6 to 45.5
$,A 16.4 (0.0–389.1);

47.3 (23.0–100.0);

46.1 to 48.5
$,A <0.001 ###
5.3; 37.5 B 7.9 (0.0–189.2);

0.4; 35.5
0.105 14.3 (0.0–69.2);

1.7; 34.6
0.952 4.8 (0.0–189.2);

0.3; 33.3
0.236
Left testicle’s volume, in mL-s
22.0 (0.0–50.0);

21.8 to 22.3
$,A 22.9 (0.0–50.0);

22.2 to 23.6
$,A 0.016 ###
Concentration of round cells in seminal fluid, in M/mL 1.6 (0.0–75.0);

0.6; 3.0
1.8 (0.2–31.0);

0.8; 3.9
0.485 1.2 (0.2–7.2);

0.5; 2.0
0.746 3.0 (0.4–31.0);

1.0; 7.3
0.146
Right testicle’s volume, in mL-s
23.0 (0.0–50.0);

22.8 to 23.3
$,A 24.4 (6.0–50.0);

23.7 to 25.1
Percentage of neutrophils in seminal fluid, % 8 (0–91);

3; 16
$,A 22 (0–63);

11; 39<0.001
###
7.379 × 10⁻⁶ 20 (4–48);

13; 30 0.004 25 (0–63);

10; 43
0.002 STI in anamnesis 459 (23.0%)
Concentration of neutrophils in seminal fluid, in M/mL 0.1 (0.0–68.3);51 (20.6%) 0.422 ##


0.0; 0.3 0.2 (0.0–10.70);

0.1; 0.9
0.001 0.2 (0.0–1.4);

0.1; 0.7
0.250 0.4 (0.0–10.7);

0.1; 2.6
0.004
N. gonorrhoeae in anamnesis
95 (4.8%) 7 (2.8%) 0.197 ##
IL-6 in seminal plasma, in ng/L 18.2 (2.0–4928.0);

11.1; 32.3
C 30.4 (3.0–1330.0);

17.9; 78.7
D 0.002 24.8 (3.0–1330.0);

20.8; 66.2
D 0.192 30.6 (9.2–406.0);

17.6; 84.5
0.016
C. trachomatis in anamnesis
259 (13.0%) 27 (10.9%) 0.419 ##
T. vaginalis in anamnesis
85 (4.2%) 9 (3.6%) 0.739 ##
Lues in anamnesis
15 (0.8%) 1 (0.4%) 1 ##
HSV in anamnesis
47 (2.4%) 12 (4.8%) 0.032 ##
HPV in anamnesis
68 (3.4%) 11 (4.4%) 0.364 ##
Patients with varicocele 467 (23.4%) 61 (24.6%) 0.691 ##
Left-sided grade 1 varicocele–
173 (8.7%) 25 (10.1%) 0.668 ##
Left-sided grade 2 varicocele
211 (10.6%) 27 (10.9%) 0.777 ##
Left-sided grade 3 varicocele
32 (1.6%) 4 (1.6%) 1 ##
Right-sided varicocele
5 (0.3%) 0 (0.0%) 1 ##
Bilateral varicocele
24 (1.2%) 3 (1.2%) 1 ##
Operated varicocele
22 (1.1%) 2 (0.8%) 1 ##
Smokers 667 (33.4%) 74 (31.1%) 0.513 ##
Concentration of FSH in serum, in U/L 3.8 (0.1–74.1);

2.6; 5.6
B 3.6 (0.6–15.2);

2.6; 5.1
0.065 #
Concentration of LH in serum, in U/L 3.9 (0.1–25.9);

2.8; 5.4
C 3.6 (0.6–11.7);

2.4; 4.6
C <0.001 #
Concentration of total testosterone in serum, in nmol/L 16.0 (0.7–47.8);

12.4; 20.4
D 16.6 (6.0–49.3);

12.9; 20.2
0.489 #
PSA in serum, in µg/L 0.71 (0.11–8.34);

0.52; 0.99
E 0.69 (0.14–7.58);

0.47; 0.96
E 0.053 #
Height, cm 181.1 (153.0–209.0);

180.8 to 181.4
$, F 180.8 (167.0–198.0);

180.0 to 181.5
$ 0.468 ###
Weight, kg 85.1 (47.0–189.0);

75.7; 95.5
G 82.0 (52.0–139.0);

74.5; 90.9
0.005 #
BMI 26.0 (14.9–76.2);

23.6; 28.7
H 24.9 (18.0–42.4);

22.9; 27.8
0.003 #
Overweighed patients (BMI > 24.9)
812 (42.3%) H 85 (34.3%) 0.016 ##
Obese patients (BMI > 29.9)
340 (17.7%) H 34 (13.7%) 0.129 ##
Waist circumference, cm 93.0 (62.0–152.0);

85.0; 101.0
I 90.0 (68.5–124.0);

83.5; 97.1
I <0.001 #
Semen parameters
Abstinence before semen analysis, in days 4.0 (0.0–56.0);

3.0; 4.0
J 3.0 (1.0–60.0);

3.0; 5.0
0.238 #
Volume of seminal fluid, in mL-s 4.0 (0.0–40.0);

2.9; 5.1
J 3.8 (1.2–9.5);

2.9; 5.1
0.361 #
Concentration of spermatozoa, in M/mL 50.0 (0.0–487.0);

21.9; 88.0
J 79.0 (6.0–355.0);

46.8; 125.0
<0.001 #
Total count of spermatozoa, in M 189.0 (0.0–2432.0);

79.2; 341.3
J 302.5 (14.4–1657.6);

164.8; 499.3
<0.001 #
Spermatozoa with progressive motility, % 45 (0–83);

34; 56
K 53 (11–84);

44; 60
<0.001 #
Spermatozoa with normal morphology, % 7 (0–53);

4; 11
L 10 (0–27);

7; 14
<0.001 #
Concentration of round cells in seminal fluid, in M/mL 1.5 (0.0–75.0);

0.6; 3.0
M 1.5 (0.0–45.0);

0.5; 3.0
0.231 #
Percentage of neutrophils in seminal fluid, % 9.0 (0.0–92.0);

3.0; 18.0
M 4.0 (0.0–69.0);

0.0; 12
<0.001 #
Concentration of neutrophils in seminal fluid, in M/mL 0.1 (0.0–68.3);

0.0; 0.4
M 0.0 (0.0–27.5);

0.0; 0.3
<0.001 #
IL-6 in seminal plasma, in ng/L 18.6 (2.0–4928.0);

11.2; 32.9
N 19.3 (2.0–486.0);

12.0; 35.0
0.676 #
Annotations to this table. Data with non-parametric distribution. $ The only variables with parametric distribution were age, bitesticular volume, left testicle’s volume, right testicle’s volume, and height. For these parameters, the mean, range and 95% confidence interval are presented. A Testicular volume was not measured for 146 and 3 patients in the study and the control group, respectively; B Data not available for 52 patients in the study group only; C Data not available for 51 and 1 patients in the study and the control group, respectively; D Data not available for 43 patients in the study group only; E Data not available for 72 and 16 patients in the study and the control group, respectively; F Data not available for 91 patients in the study group only; G Data not available for 94 patients in the study group only; H Data not available for 80 patients in the study group only; I Data not available for 183 and 4 patients in the study and the control group, respectively; J Data not available for 4 patients with serious sexual dysfunctions in the study group only; K Data not available for 73 patients in the study group only; L Data not available for 74 patients in the study group only; M Data not available for 5 patients in the study group only; N Data not available for 65 patients in the study group only; # Mann–Whitney U test; ## Fisher’s exact test; ### Unpaired t–test.
Among 2000 infertile men, the proportion of primary and secondary infertility was 74.4% (1487 patients) and 25.6% (513 patients), respectively. The median duration of infertility was 1.9 years with the range 1.0–20.0 years.
The infertility group had lower testicular volume, higher body weight, and a larger proportion of overweight patients (BMI > 24.9) compared to the control group. In addition, infertile men had a lower total count and concentration of spermatozoa, lower percentage of spermatozoa with progressive motility, and normal morphology. The concentration and percentage of neutrophils in semen were also higher among infertile men. However, there was no difference in seminal IL-6 levels between groups. Importantly, there was no difference in abstinence time between infertile and fertile groups.
There was a significantly higher blood level of LH among the infertility group compared to the control group. There was also a slight trend for higher FSH and PSA blood levels among infertile men compared to fertile men, albeit statistically insignificant.

3. Prevalence of STI among Study Subjects

Annotations to this table. Data are presented as median (range), 25th, and 75th percentile. Data are with non-parametric distribution. $$ p-value is calculated with Mann–Whitney test comparing two groups. Bonferroni correction of p-value for two tests. A Data accounting progressive motility of spermatozoa are not available for one patient. B Data accounting spermatozoa morphology are not available for one patient. C Data accounting IL-6 in seminal plasma are not available for 36 patients. D Data accounting IL-6 in seminal plasma are not available for one patient.
However, when STI-positive cases were analyzed separately, the impact of C. trachomatis on the total count of spermatozoa and progressive motility became slightly over the significance level. Similar tendencies were also seen in the case of M. genitalium-positive patients. The spermatozoa count with normal morphology was lower in M. genitalium-positive patients though the difference between the groups was slightly over the significance level again.
The impact of both combined C. trachomatis and M. genitalium on seminal inflammatory parameters (concentration of neutrophils, seminal IL-6) also remained significant in the selected infertility group patients. However, when STI-positive cases were split separately, the impact of C. trachomatis on seminal IL-6 and neutrophil concentration disappeared, while remaining for M. genitalium (Table 2).