AShifts sessile organisms, plants are at the mercy of an array of abiotic stresses, and, as winter approaches in mid- to high-latitudes and altitudes, one suchin microbiota undoubtedly support host plants faced with abiotic stress is, including low temperature. Plants employ various strategies that allow them to recognise and cope with the cold. As autumn progresses, perennials undergos. Cold-resistant perennials prepare for freeze stress during a period of cold acclimation, which in a few days of low temperature exposure allows them to physiologically prepare for freez that can be mimicked by transfer from growing conditions. Such preparations include changed levels of hundreds of proteins, the accumulation of fatty acids, lipid remodelling for plasma membrane protection, increased production of cryoprotective metabolites, such as soluble sugar to a reduced photoperiod and a temperature of 4 °C for 2–6 days. After cold acclimation, the model cereal, Brachypodium distachyon, was characterized using metagenomics supplemented with amplicon sequencing (16S ribosomal RNA gene fragments and amino acids, as well as chaperones and reactive oxygen scavengersn internal transcribed spacer region). The perennial grass and model cereal,bacterial and fungal rhizosphere Brachypodium distachyon (heremainafter, Brachypodium), is capable of cold ed largely unchanged from that of non-acclimation, reaching peak freezing tolerance after two days at 4 °C, and is associated with changes in the abundance of multiple plasma membrane proteins at 2–6 daysed plants. However, leaf samples representing bacterial and fungal communities of the endo- and phyllospheres significantly changed.
- Brachypodium distachyon
- cold acclimation
- microbiome
- amplicon and shotgun sequencing
- metagenomics
- Pseudomonas
- Streptomyces
1. Introduction
2. Pre-Processing, Shotgun Sequencing, and Kit Controls
3. Compatible Results with Shotgun and Amplicon Sequencing
4. Cold Acclimation and the Rhizosphere Microbiome
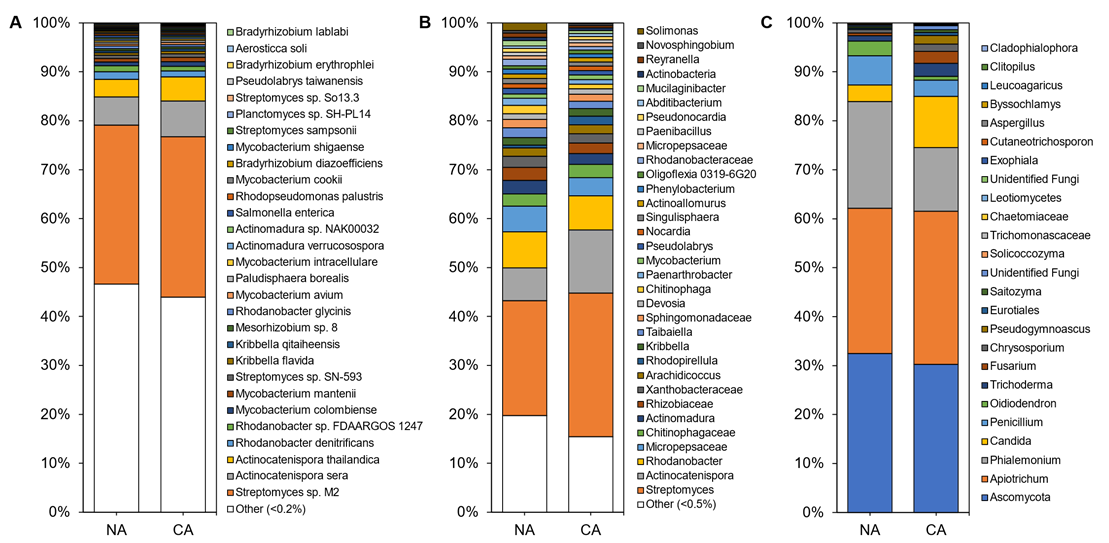
In total, 4646 microbial species were identified in the rhizosphere shotgun data with 45 ± 3% of reads remaining unclassified. The majority of identified reads, 99.70 ± 0.06%, represented bacterial microbes with 0.15 ± 0.03% and 0.13 ± 0.02% representing fungi and archaea, respectively. Alpha diversity, assessed using Shannon’s diversity index, across all rhizosphere samples was 4.98 ± 0.21 and was not significantly different between conditions with 5.07 ± 0.29 in the CA and 4.91 ± 0.94 in the NA samples. The rhizosphere was dominated by Streptomyces sp. M2, a PGPB, accounting for approximately one-third of the taxa in all samples. Rounding out the top abundant species across the rhizosphere samples were taxa present at 1–10% abundance, which included Actinocatenispora sera, Actinocatenispora thailandica, Rhodanobacter denitrificans, and Rhodanobacter sp. FDA-ARGOS 1247 (Figure 1A; Table S3). Nearly half of all species in the rhizosphere shotgun data were below a cut-off value (0.2%) for low relative abundance leaving a balance of 53% and 56% of species found in NA and CA samples, respectively.
The amplicon analysis identified 651 distinct ASVs at the genus level. Alpha diversity appeared similar in the NA and CA samples (6.79 ± 0.25 and 6.40 ± 0.16, respectively) and differences were not significant. Both conditions were dominated by the genera Streptomyces, Actinocatenispora, and Rhodanobacter (
The amplicon analysis identified 651 distinct ASVs at the genus level. Alpha diversity appeared similar in the NA and CA samples (6.79 ± 0.25 and 6.40 ± 0.16, respectively) and differences were not significant. Both conditions were dominated by the genera Streptomyces, Actinocatenispora, and Rhodanobacter (Figure 1B; Table S3). After CA, low abundant taxa (<1% relative abundance) remained equal at 29%. Again, a similar number of ASVs were considered at low abundance under NA and CA conditions (20% and 15%, respectively). ITS analysis showed 25 distinct ASVs at the genus level (
B; Table S3). After CA, low abundant taxa (<1% relative abundance) remained equal at 29%. Again, a similar number of ASVs were considered at low abundance under NA and CA conditions (20% and 15%, respectively). ITS analysis showed 25 distinct ASVs at the genus level (Figure 1C). Ascomycota and Apiotrichum each represented a third of the ASVs in the rhizosphere irrespective of conditions (
C). Ascomycota and Apiotrichum each represented a third of the ASVs in the rhizosphere irrespective of conditions (Figure 1C; Table S3). Alpha diversity was significantly different (p < 0.05, two-tailed t-test) at 3.43 ± 0.06 in the CA and 3.05 ± 0.17 in the NA.
C; Table S3). Alpha diversity was significantly different (p < 0.05, two-tailed t-test) at 3.43 ± 0.06 in the CA and 3.05 ± 0.17 in the NA.Although there were few changes in the rhizosphere community following 6 days at 4 °C, differential abundance testing using ANCOM with bias control and parsed for taxa above the assigned low relative abundance thresholds (
Although there were few changes in the rhizosphere community following 6 days at 4 °C, differential abundance testing using ANCOM with bias control and parsed for taxa above the assigned low relative abundance thresholds (Figure 1) identified two modestly differentially abundant species (out of 143; 1.4%) in the shotgun data. Kribbella qitaiheensis (log2 fold change: 0.37) and Kribbella flavida (log2 fold change: 0.38) increased in relative abundance after CA (
) identified two modestly differentially abundant species (out of 143; 1.4%) in the shotgun data. Kribbella qitaiheensis (log2 fold change: 0.37) and Kribbella flavida (log2 fold change: 0.38) increased in relative abundance after CA (Figure 2A). In addition, the relative abundance of three fungal genera (out of 25; 12%) changed following CA, including a decrease in Penicillium (log2 fold change: −1.8) and Phialemonium (log2 fold change: −1.7) and a more substantial relative increase in Pseudogymnoascus (log2 fold change: 8.43) (
A). In addition, the relative abundance of three fungal genera (out of 25; 12%) changed following CA, including a decrease in Penicillium (log2 fold change: −1.8) and Phialemonium (log2 fold change: −1.7) and a more substantial relative increase in Pseudogymnoascus (log2 fold change: 8.43) (Figure 2B).
B).
Although shifts in the rhizosphere community appeared modest, the Bray–Curtis dissimilarity analysis showed that the shotgun rhizosphere communities were significantly different under the two temperature regimes (p < 0.01, pairwise PERMANOVA) (
Although shifts in the rhizosphere community appeared modest, the Bray–Curtis dissimilarity analysis showed that the shotgun rhizosphere communities were significantly different under the two temperature regimes (p < 0.01, pairwise PERMANOVA) (Figure 3
A). In contrast, there were no differences in Bray–Curtis dissimilarity for the amplicon analysis, either for 16S (Figure 3
B) or ITS data (Figure 3C). Taking all the results together, it appears that overall, the CA regime resulted in only a very minor shift in the rhizosphere microbial community. Researchers speculate that a longer period of low temperature with concomitant changes in root exudates would be required for a more dramatic change in the root-associated microbiota.
C). Taking all the results together, it appears that overall, the CA regime resulted in only a very minor shift in the rhizosphere microbial community. We speculate that a longer period of low temperature with concomitant changes in root exudates would be required for a more dramatic change in the root-associated microbiota.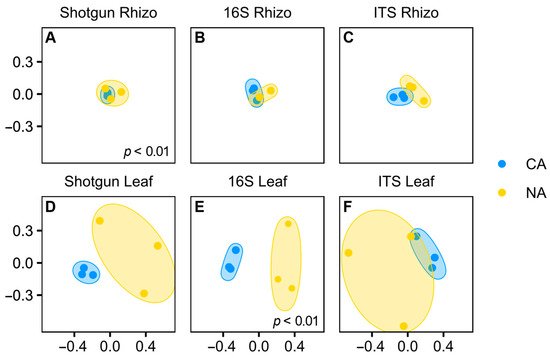
5. Cold Acclimation and the Leaf Microbiome
Although shotgun sequencing of the leaf, representing the endosphere and phyllosphere microbiomes, identified 143 microbial species with the most abundant taxa shown (
Although shotgun sequencing of the leaf, representing the endosphere and phyllosphere microbiomes, identified 143 microbial species with the most abundant taxa shown (Figure 4A; Table S4), an average of 92 ± 4% of the reads remained unclassified, with a portion of these likely attributable to as yet unsequenced host mitochondrial sequences (Figure S4C). Bacteria accounted for ~100% of the microbiota except in a couple of samples from which a few fungal sequences were recovered. Overall, alpha diversity was significantly lower (p < 5 × 10
A; Table S4), an average of 92 ± 4% of the reads remained unclassified, with a portion of these likely attributable to as yet unsequenced host mitochondrial sequences (Figure S4C). Bacteria accounted for ~100% of the microbiota except in a couple of samples from which a few fungal sequences were recovered. Overall, alpha diversity was significantly lower (p < 5 × 10⁻⁶, two-tailed t-test) in leaf samples (3.18 ± 0.36) compared to rhizosphere samples (4.99 ± 0.21).
, two-tailed t-test) in leaf samples (3.18 ± 0.36) compared to rhizosphere samples (4.99 ± 0.21).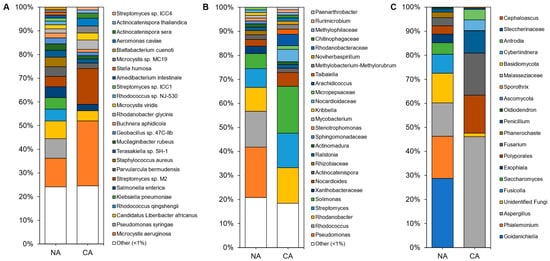
Figure 4. Average relative abundance of the taxonomies of the non-acclimated and cold-acclimated Brachypodium distachyon leaf microbiomes representing the endosphere and phyllosphere: (
Average relative abundance of the taxonomies of the non-acclimated and cold-acclimated Brachypodium distachyon leaf microbiomes representing the endosphere and phyllosphere: (A
) species identified from shotgun sequencing and metagenomics classified using a custom Kraken2 database, (B
) distinct amplicon sequence variants assigned down to the genus or lowest possible level by QIIME2 using the SILVA database for 16S rRNA sequences, amplified using the V4 region of prokaryotes, and (C) distinct amplicon sequence variants assigned down to the genus or lowest possible level by QIIME2 using the UNITE database for ITS regions of eukaryotes.
) distinct amplicon sequence variants assigned down to the genus or lowest possible level by QIIME2 using the UNITE database for ITS regions of eukaryotes.Leaf alpha diversity did not significantly change after CA treatment (mean Shannon indices at 3.30 ± 0.29 in NA samples and 3.06 ± 0.47 in CA samples). However, the taxa profile changed with the cyanobacteria Microcystis aeruginosa, decreasing from ~27% to ~13% relative abundance after CA. Streptomyces sp. M2 showed the opposite profile, increasing from ~4% to ~15% average relative abundance after transfer to 4 °C. NA leaves were dominated by the plant pathogens Pseudomonas syringae and ‘Candidatus Liberibacter africanus’, as well as the plant beneficial Rhodococcus qingshengii, whose levels substantially decreased in the CA conditions. Lower abundant reads (<1%) made up about a quarter of the taxa, similar to the CA samples.
Leaf alpha diversity did not significantly change after CA treatment (mean Shannon indices at 3.30 ± 0.29 in NA samples and 3.06 ± 0.47 in CA samples). However, the taxa profile changed with the cyanobacteria Microcystis aeruginosa, decreasing from ~27% to ~13% relative abundance after CA. Streptomyces sp. M2 showed the opposite profile, increasing from ~4% to ~15% average relative abundance after transfer to 4 °C. NA leaves were dominated by the plant pathogens Pseudomonas syringae and ‘Candidatus Liberibacter africanus’, as well as the plant beneficial Rhodococcus qingshengii, whose levels substantially decreased in the CA conditions. Lower abundant reads (<1%) made up about a quarter of the taxa, similar to the CA samples.Amplicon sequencing of the 16S rRNA from the leaves identified 188 distinct ASVs at the genus level (with the most abundant shown in
Amplicon sequencing of the 16S rRNA from the leaves identified 188 distinct ASVs at the genus level (with the most abundant shown inFigure 4B and Table S4). Again, alpha diversity was not significantly different between conditions (5.04 ± 0.25 and 4.60 ± 0.70 in the CA and NA samples, respectively). Taxa present under both conditions included the genera Solimonas, Rhodanobacter, and Streptomyces. Pseudomonas and Rhodococcus were abundant (21% and 15% average relative abundance, respectively) in NA conditions, but decreased in relative abundance after transfer of the plants to 4 °C with log2 fold changes of −4.18 and −5.41, respectively. The cereal growth-promoting genus Nocardioides and an unidentified genus from the same family, Nocardioidaceae, both increased in abundance to represent 11% of the taxa in CA plants. ASVs at low relative abundance (<1%) made up a similar 18% and 21% of CA and NA 16S samples, respectively. ITS analysis resulted in 20 distinct ASVs at the genus level (
B and Table S4). Again, alpha diversity was not significantly different between conditions (5.04 ± 0.25 and 4.60 ± 0.70 in the CA and NA samples, respectively). Taxa present under both conditions included the genera Solimonas, Rhodanobacter, and Streptomyces. Pseudomonas and Rhodococcus were abundant (21% and 15% average relative abundance, respectively) in NA conditions, but decreased in relative abundance after transfer of the plants to 4 °C with log2 fold changes of −4.18 and −5.41, respectively. The cereal growth-promoting genus Nocardioides and an unidentified genus from the same family, Nocardioidaceae, both increased in abundance to represent 11% of the taxa in CA plants. ASVs at low relative abundance (<1%) made up a similar 18% and 21% of CA and NA 16S samples, respectively. ITS analysis resulted in 20 distinct ASVs at the genus level (Figure 4C).
C).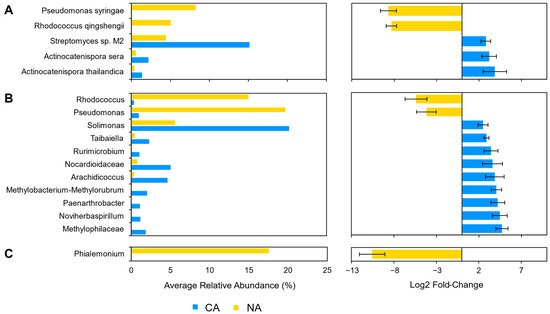
6. Dissimilarity Comparisons and Core Microbiome
The root and leaf-associated microbiomes were further independently characterized with SIMPER to identify taxa that contributed the most dissimilarity between NA and CA regimes (
The root and leaf-associated microbiomes were further independently characterized with SIMPER to identify taxa that contributed the most dissimilarity between NA and CA regimes (Table 1). For microbiota isolated from the rhizosphere, the taxa contributing to the top ~25% of dissimilarity were Streptomyces sp. M2, A. sera, and A. thailandica for the shotgun data, the genera Actinocatenispora and Streptomyces for the 16S data, and the genera Phialemonium and Apiotrichum for the ITS data. For leaf samples, taxa contributing to the top ~25% dissimilarity were M. aeruginosa and Streptomyces sp. M2 for the shotgun data, the genera Pseudomonas and Rhodococcus for the 16S data, and the genera Aspergillus and Goidanichiella for the ITS data.
). For microbiota isolated from the rhizosphere, the taxa contributing to the top ~25% of dissimilarity were Streptomyces sp. M2, A. sera, and A. thailandica for the shotgun data, the genera Actinocatenispora and Streptomyces for the 16S data, and the genera Phialemonium and Apiotrichum for the ITS data. For leaf samples, taxa contributing to the top ~25% dissimilarity were M. aeruginosa and Streptomyces sp. M2 for the shotgun data, the genera Pseudomonas and Rhodococcus for the 16S data, and the genera Aspergillus and Goidanichiella for the ITS data.| Taxa | NA (%) | CA (%) | Average Dissimilarity | Contribution (%) | Cumulative (%) |
|---|---|---|---|---|---|
| Shotgun Rhizo (Overall Average Dissimilarity 7.1%) | |||||
| Streptomyces sp. M2 | 32.5 | 32.8 | 0.9 | 12.8 | 12.8 |
| Actinocatenispora sera | 5.7 | 7.3 | 0.8 | 11.2 | 24.0 |
| Actinocatenispora thailandica | 3.6 | 4.9 | 0.6 | 9.1 | 33.1 |
| 16S Rhizo (Overall Average Dissimilarity 10.7%) | |||||
| Actinocatenispora | 8.1 | 11.4 | 1. 7 | 15.7 | 15.7 |
| Streptomyces | 24.2 | 26.6 | 1.4 | 13.4 | 29.2 |
| ITS Rhizo (Overall Average Dissimilarity 19.0%) | |||||
| Phialemonium | 21.3 | 13.4 | 4.0 | 21.1 | 21.1 |
| Apiotrichum | 29.9 | 30.8 | 4.0 | 21.1 | 42.2 |
| Shotgun Leaf (Overall Average Dissimilarity 52. 6%) | |||||
| Microcystis aeruginosa | 12.1 | 27.4 | 9.6 | 18.2 | 18.2 |
| Phyla | Class | Order | Family | Genus | Species | ||||||
|---|---|---|---|---|---|---|---|---|---|---|---|
| Core rhizosphere species (shotgun) | |||||||||||
| Actinobacteria | Actinomycetia | Streptomycetales | Streptomycetaceae | Streptomyces | Streptomyces sp. M2 | ||||||
| Actinobacteria | Actinomycetia | Micromonosporales | Micromonosporaceae | Actinocatenispora | Actinocatenispora sera | ||||||
| Core rhizosphere genera (16S) | |||||||||||
| Actinobacteria | Actinomycetia | Streptomycetales | Streptomycetaceae | Streptomyces | |||||||
| Streptomyces | |||||||||||
| Actinobacteria | Actinomycetia | Micromonosporales | Micromonosporaceae | Actinocatenispora | |||||||
| Proteobacteria | Gammaproteobacteria | Xanthomonadales | Rhodanobacteraceae | Rhodanobacter | |||||||
| sp. M2 | |||||||||||
| 4.4 | |||||||||||
| 15.1 | 5.4 | 10.2 | 28.4 | ||||||||
| Core rhizosphere genera (ITS) | |||||||||||
| Ascomycota | |||||||||||
| Basidiomycota | Tremellomycetes | Trichosporonales | Trichosporonaceae | Apiotrichum | |||||||
| Ascomycota | Sordariomycetes | Sordariales | Cephalothecaceae | Phialemonium | |||||||
| Ascomycota | Saccharomycetes | Saccharomycetales | Saccharomycetaceae | Candida | |||||||
| Core leaf species (shotgun) | 16S Leaf (Overall Average Dissimilarity 60.9%) | ||||||||||
| Actinobacteria | Actinomycetia | Streptomycetales | Streptomycetaceae | Streptomyces | Pseudomonas | 19.7 | 1.0 | 9.4 | 15.4 | 15.4 | |
| Rhodococcus | 15.0 | 0.4 | 7.3 | 12.0 | 27.4 | ||||||
| ITS Leaf (Overall Average Dissimilarity 80.3%) | |||||||||||
| Aspergillus | 15.9 | 47.5 | 16.6 | 20.7 | 20.7 | ||||||
| Goidanichiella | 25.1 | 0.0 | 12.6 | 15.7 | 36.4 | ||||||
| Streptomyces | |||||
| sp. M2 | |||||
| Proteobacteria | |||||
| Alphaproteobacteria | |||||
| Hyphomicrobiales | |||||
| Rhizobiaceae | |||||
| Liberibacter | |||||
| * ‘ | |||||
| Candidatus | L. a.’ | ||||
| Core leaf genera (16S) | |||||
| Actinobacteria | Actinomycetia | Streptomycetales | Streptomycetaceae | Streptomyces | |
| Proteobacteria | Gammaproteobacteria | Xanthomonadales | Rhodanobacteraceae | Rhodanobacter | |
| Proteobacteria | Gammaproteobacteria | Salinisphaerales | Solimonadaceae | Solimonas | |
| Core leaf genera (ITS) | |||||
| Unidentified Fungi | |||||
