In response to the threat presented by AMR, it is critically important to find methods for effectively interpreting minimum inhibitory concentration (MIC) tests. A wide array of techniques for analysis of MIC data exist, which require different ways of modifying the MIC data for use as the dependent variable in regression and analysis. For use as the outcome in logistic regression, MIC data is categorized using clinical breakpoints and epidemiological cutoff values (ECOFF). Clinical breakpoints classify isolates as susceptible (S), resistant (R), or an intermediate category based on expected clinical outcomes of treatment with a specific antimicrobial. The ECOFF classifies organisms as wild type (WT) or non-wild type (non-WT) based on the absence or presence of phenotypically-detectable acquired resistance mechanisms to the specific antimicrobial. Dichotomization of MIC data results in information loss, as only changes in the proportions of WT/non-WT or S/R are observed in dichotomized data. As a result, changes in MIC distributions that do not cross the threshold may be unobserved using approaches with dichotomized outcomes. Other modeling approaches for MIC data may attempt to avoid information loss by not dichotomizing the outcome when using regression to analyze MIC data.
- antimicrobial resistance
- minimum inhibitory concentration
- epidemiological cutoff
- clinical breakpoints
- mic creep
1. Introduction
The World Health Organization has deemed antimicrobial resistance (AMR) one of the most urgent health threats of our time [1]. Antimicrobial-resistant bacteria are implicated in approximately 2.8 million cases of clinical infections and an additional 35,000 human deaths annually [2]. In addition to clinical burdens, the estimated annual economic cost of AMR is approximately $3 trillion in GDP loss due to excess health care and loss of productivity [3]. The issue of AMR affects humans, animals, and the environment alike, prompting the World Health Organization to recommend the coordinated monitoring of resistance in bacteria from food, food animals, and clinically ill patients to understand the patterns of AMR and how it affects the entire food production chain [4]. As a part of this effort, the ability to monitor AMR phenotypically and genotypically with respect to resistance is an important methodological tool in public health and food production [5].
To address the threat of AMR, national and international surveillance systems conduct widespread antimicrobial susceptibility testing to track resistance levels in microbial populations. The U.S. National Antimicrobial Resistance Monitoring System (NARMS) assesses resistance levels of enteric bacterial isolates from retail meats, livestock, and humans [5]. For this purpose, surveillance programs measure resistance levels of isolates to each antimicrobial using minimum inhibitory concentrations (MIC) of selected antibiotics. The MIC quantifies the lowest tested concentration at which an isolate’s growth is inhibited by a specific antimicrobial [6]. The MIC is determined for a given isolate and antimicrobial using automated instrument systems or manual testing methods, including agar dilutions, antimicrobial gradient method (e.g., E-tests), and broth dilutions [7][8]. These tests expose the isolate to a series of concentrations of antimicrobials on a two-fold scale, and the lowest concentration where inhibition of bacterial growth is present is reported as the MIC for that isolate and the corresponding antimicrobial compound.
2. Epidemiological Cutoffs and Clinical Breakpoints
There are a number of different ways that MIC data is modified for use as the dependent variable in regression and analysis. In general, different modeling approaches utilize data handling methods that balance model simplicity with information loss. Logistic regression requires a dichotomous outcome, and the breakpoints are carefully selected to divide observations into separate meaningful outcome categories.
One method for selecting this dividing value on the MIC scale is to use the epidemiological cutoff value, which separates the distribution of MICs of wild type (WT) isolates, which lack phenotypically-detectable acquired resistance mechanisms, from the non-wild type (non-WT) organisms that possess phenotypically-detectable acquired resistance mechanisms. [9][10]. The European Committee on Antimicrobial Susceptibility Testing (EUCAST) sets epidemiological cutoff values (ECOFF) based on the consensus of visual and mathematical analyses of observed MIC distributions performed by identifying WT and non-WT distributions in the bimodal distribution of MICs [11][12]. The mathematical determination of the ECOFF for each antimicrobial agent is done using a tool called the ECOFFinder, which fits a cumulative log normal curve to the WT MICs and identifies cutoffs that classify 97.5% and 99% of the WT isolates correctly [13]. A similar method is employed by the Clinical and Laboratory Standards Institute (CLSI) for its own epidemiological cutoff values (ECV) [11][14].
The other predominant categorization method involves the establishment of clinical breakpoints. This process partitions MIC values into distinct classes of bacterial susceptibility based on clinical outcomes. CSLI defines these classes as “susceptible” (S), “resistant” (R), and either “intermediate” (I) or “susceptible-dose dependent” (SDD) [15]. Note that EUCAST defines its intermediate breakpoint as “susceptible, increased exposure” (I) [16]. See Figure 1 for a visual comparison of MIC concentrations, censored MIC intervals, clinical breakpoints, and epidemiological cutoffs. [16][17]. These breakpoints are established by organizations such as the CLSI, EUCAST, and the U.S. Food and Drug Administration Center for Drug Evaluation and Research [17]. Different organizations use different names and definitions for intermediate classes that allow for some ambiguity in interpretation and specific information on these categories is typically available on each organization’s website [16][17]. Classifications based on an ECOFF are not immediately related to classifications based on clinical breakpoints, an isolate identified as non-WT will not necessarily be clinically resistant, instead it may still be clinically susceptible [9].
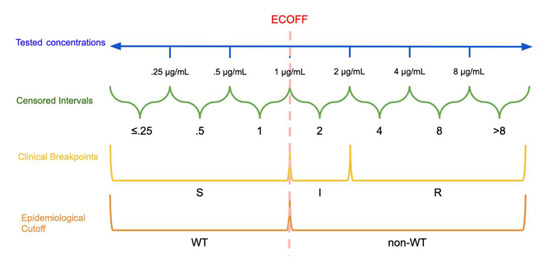
Dichotomization and Categorization of Minimum Inhibitory Concentration (MIC) data: In this hypothetical example, the continuous scale of concentrations is divided into intervals based on the tested concentrations. The epidemiological cutoff (ECOFF) divides wild type (WT) and non-wild type isolates at 1 μg/mL while the clinical breakpoints divide the MICs into susceptible (S): ≤1 μg/mL, susceptible, increased exposure (I): >1 μg/mL and ≤2 μg/mL, and resistant (R): >2 μg/mL. Note that the ECOFF and S breakpoint need not be the same.
The clinical breakpoints and ECOFF seek to avoid splitting the WT isolates into multiple categories to avoid accidental classification of a WT isolate to a higher resistance category. This approach must account for about one dilution of variation in measurement introduced by testing procedures in breakpoint or cutoff determination, as well as inter-laboratory variance [8][11][18]. As a result, the ECOFF must account for this variation as it attempts to separate this distribution of isolates from the non-WT bacteria that are higher in the range of tested concentrations.
Though this approach simplifies the modeling approaches necessary to look for trends and increases the overall ease of interpretation, a portion of the information contained by the MIC value is lost when it is dichotomized or categorized, which will be further discussed later in the review [19][20][21]. Additionally, breakpoints may be subject to change over time in response to changes in protocols, resistance patterns, and guidelines [22].
3. Information Loss and Minimum Inhibitory Concentration (MIC) Creep
Information loss is a byproduct of the dichotomization of MIC data, as interval-censored, continuous data is simplified to being either above or below a threshold value (see ECOFF, ECV, and clinical breakpoints above), which results in data loss [30,31]. With dichotomized MIC data, only changes in the proportions of MIC values that fall on each side of the threshold are captured via logistic regression. In other words, only fluctuations in the proportions of WT and non-WT, or S and R, are captured by logistic regression, and all fluctuations of values within each category are lost. As a result, surveillance of dichotomized AMR data can result in the loss of critical information such as changes in trends in the mean MICs of the S and R, or WT and non-WT, groups if those changes do not cross threshold values. This phenomenon where changes in the mean MIC are not detected by dichotomized analysis of MIC data is referred to as “MIC creep” and “MIC decline.” In response to information loss through dichotomization, a wide array of methods of analysis incorporating additional information from MIC data have been developed. These methods examine the entire scale of MICs to gain insight into the distributions of MICs above and below the cutoff values [38]. As a practical example, MIC creep has become a relevant concern for surveillance of increasing resistance to vancomycin among methicillin-resistantInformation loss is a byproduct of the dichotomization of MIC data, as interval-censored, continuous data is simplified to being either above or below a threshold value (see ECOFF, ECV, and clinical breakpoints above), which results in data loss [19][20]. With dichotomized MIC data, only changes in the proportions of MIC values that fall on each side of the threshold are captured via logistic regression. In other words, only fluctuations in the proportions of WT and non-WT, or S and R, are captured by logistic regression, and all fluctuations of values within each category are lost. As a result, surveillance of dichotomized AMR data can result in the loss of critical information such as changes in trends in the mean MICs of the S and R, or WT and non-WT, groups if those changes do not cross threshold values. This phenomenon where changes in the mean MIC are not detected by dichotomized analysis of MIC data is referred to as “MIC creep” and “MIC decline.” In response to information loss through dichotomization, a wide array of methods of analysis incorporating additional information from MIC data have been developed. These methods examine the entire scale of MICs to gain insight into the distributions of MICs above and below the cutoff values [23]. As a practical example, MIC creep has become a relevant concern for surveillance of increasing resistance to vancomycin among methicillin-resistant
Staphylococcus aureus, though individual study results differ with regards to the nature of this trend [46,47,48]., though individual study results differ with regards to the nature of this trend [24][25][26].
In another study, two nonparametric approaches and logistic regression were used on subsets of NARMS retail and slaughter data to demonstrate significant changes in the distributions of MICs from consecutive years. MIC creep was identified via the nonparametric tests but not detected by logistic regression. In contrast to logistic regression, the nonparametric approaches treat each interval as a separate unordered category, then evaluate whether the distribution of MICs among these categories changes between two time points either a year apart or between slaughter and retail [30]. The results of the study suggest that the distributions of MIC data may vary without being detected by methods that dichotomize the data. Therefore, these data indicate that the entire scale of values needs to be incorporated in the analysis of MIC data [30].In another study, two nonparametric approaches and logistic regression were used on subsets of NARMS retail and slaughter data to demonstrate significant changes in the distributions of MICs from consecutive years. MIC creep was identified via the nonparametric tests but not detected by logistic regression. In contrast to logistic regression, the nonparametric approaches treat each interval as a separate unordered category, then evaluate whether the distribution of MICs among these categories changes between two time points either a year apart or between slaughter and retail [19]. The results of the study suggest that the distributions of MIC data may vary without being detected by methods that dichotomize the data. Therefore, these data indicate that the entire scale of values needs to be incorporated in the analysis of MIC data [19].
In the interest of retaining more of the information lost through dichotomization, there are many modeling approaches for MIC data that do not dichotomize the data, several of which will be discussed later in this review. An alternative proposed approach allowing for mixed linear regression is to ignore censoring of the MIC data and instead treat MICs as observations on a continuous scale. However, this interpretation leads to an overestimation of the means and underestimation of the standard errors, increasing the likelihood of type I error [49,50].References
- World Health Organization. Antimicrobial Resistance: Global Report on Surveillance; WHO Press: Geneva, Switzerland, 2014. [Google Scholar]
- Centers for Disease Control and Prevention. About Antibiotic Resistance. Available online: https://www.cdc.gov/drugresistance/about.html (accessed on 5 May 2020).
- Naylor, N.R.; Atun, R.; Zhu, N.; Kulasabanathan, K.; Silva, S.; Chatterjee, A.; Knight, G.M.; Robotham, J.V. Estimating the burden of antimicrobial resistance: A systematic literature review. Antimicrob. Resist. Infect. Control 2018, 7, 58. [Google Scholar] [CrossRef] [PubMed]
- World Health Organization. Integrated Surveillance of Antimicrobial Resistance: Guidance from a WHO Advisory Group; WHO Press: Geneva, Switzerland, 2013. [Google Scholar]
- Karp, B.E.; Tate, H.; Plumblee, J.R.; Dessai, U.; Whichard, J.M.; Thacker, E.L.; Hale, K.R.; Wilson, W.; Friedman, C.R.; Griffin, P.M.; et al. National Antimicrobial Resistance Monitoring System: Two Decades of Advancing Public Health Through Integrated Surveillance of Antimicrobial Resistance. Foodborne Pathog. Dis. 2017, 14, 545–557. [Google Scholar] [CrossRef] [PubMed]
- Ericsson, H.M.; Sherris, J.C. Antibiotic sensitivity testing. Report of an international collaborative study. Acta Pathol. Microbiol. Scand. 1971, 217, 90. [Google Scholar]
- European Committee for Antimicrobial Susceptibility Testing (EUCAST) of the European Society of Clinical Microbiology and Infectious Diseases. Determination of minimum inhibitory concentrations (MICs) of antibacterial agents by agar dilution. Clin. Microbiol. Infect. 2000, 6, 509–515. [Google Scholar] [CrossRef] [PubMed]
- Reller, L.B.; Weinstein, M.; Jorgensen, J.H.; Ferraro, M.J. Antimicrobial Susceptibility Testing: A Review of General Principles and Contemporary Practices. Clin. Infect. Dis. 2009, 49, 1749–1755. [Google Scholar] [CrossRef]
- Fernández, L.; Breidenstein, E.B.M.; Hancock, R.E.W. Creeping baselines and adaptive resistance to antibiotics. Drug Resist. Updates 2011, 14, 1–21. [Google Scholar] [CrossRef]
- Donlan, R.M. Role of biofilms in antimicrobial resistance. ASAIO J. 2000, 46, S47–S52. [Google Scholar] [CrossRef]
- Ceri, H.; Olson, M.; Morck, D.; Storey, D.; Read, R.; Buret, A.; Olson, B. The MBEC assay system: Multiple equivalent biofilms for antibiotic and biocide susceptibility testing. In Methods in Enzymology; Doyle, R.J., Ed.; Academic Press: Cambridge, MA, USA, 2001; Volume 337, pp. 377–385. [Google Scholar]
- Girard, L.P.; Ceri, H.; Gibb, A.P.; Olson, M.; Sepandj, F. MIC versus MBEC to Determine the Antibiotic Sensitivity of Staphylococcus aureus in Peritoneal Dialysis Peritonitis. Perit. Dial. Int. 2010, 30, 652–656. [Google Scholar] [CrossRef]
- Rosengren, L.B.; Waldner, C.L.; Reid-Smith, R.J. Associations between antimicrobial resistance phenotypes, antimicrobial resistance genes, and virulence genes of fecal Escherichia coli isolates from healthy grow-finish pigs. Appl. Environ. Microbiol. 2009, 75, 1373–1380. [Google Scholar] [CrossRef]
- Tyson, G.H.; McDermott, P.F.; Li, C.; Chen, Y.; Tadesse, D.A.; Mukherjee, S.; Bodeis-Jones, S.; Kabera, C.; Gaines, S.A.; Loneragan, G.H.; et al. WGS accurately predicts antimicrobial resistance in Escherichia coli. J. Antimicrob. Chemother. 2015, 70, 2763–2769. [Google Scholar] [CrossRef]
- Zhao, S.; Tyson, G.H.; Chen, Y.; Li, C.; Mukherjee, S.; Young, S.; Lam, C.; Folster, J.P.; Whichard, J.M.; McDermott, P.F. Whole-Genome Sequencing Analysis Accurately Predicts Antimicrobial Resistance Phenotypes in Campylobacter spp. Appl. Environ. Microbiol. 2016, 82, 459–466. [Google Scholar] [CrossRef] [PubMed]
- Nguyen, M.; Long, S.W.; McDermott, P.F.; Olsen, R.J.; Olson, R.; Stevens, R.L.; Tyson, G.H.; Zhao, S.; Davis, J.J. Using Machine Learning To Predict Antimicrobial MICs and Associated Genomic Features for Nontyphoidal Salmonella. J. Clin. Microbiol. 2018, 57, e01260-18. [Google Scholar] [CrossRef] [PubMed]
- Khan, Z.A.; Siddiqui, M.F.; Park, S. Current and Emerging Methods of Antibiotic Susceptibility Testing. Diagnostics 2019, 9, 49. [Google Scholar] [CrossRef] [PubMed]
- Ellington, M.J.; Ekelund, O.; Aarestrup, F.M.; Canton, R.; Doumith, M.; Giske, C.; Grundman, H.; Hasman, H.; Holden, M.T.G.; Hopkins, K.L.; et al. The role of whole genome sequencing in antimicrobial susceptibility testing of bacteria: Report from the EUCAST Subcommittee. Clin. Microbiol. Infect. 2017, 23, 2–22. [Google Scholar] [CrossRef]
- Su, M.; Satola, S.W.; Read, T.D. Genome-Based Prediction of Bacterial Antibiotic Resistance. J. Clin. Microbiol. 2018, 57, e01405-18. [Google Scholar] [CrossRef]
- Argimón, S.; Masim, M.A.L.; Gayeta, J.M.; Lagrada, M.L.; Macaranas, P.K.V.; Cohen, V.; Limas, M.T.; Espiritu, H.O.; Palarca, J.C.; Chilam, J.; et al. See and Sequence: Integrating Whole-Genome Sequencing Within the National Antimicrobial Resistance Surveillance Program in the Philippines. bioRxiv 2020. [Google Scholar] [CrossRef]
- Ängeby, K.; Juréen, P.; Kahlmeter, G.; Hoffner, S.E.; Schön, T. Challenging a dogma: Antimicrobial susceptibility testing breakpoints for Mycobacterium tuberculosis. Bull. World Health Organ. 2012, 90, 693–698. [Google Scholar] [CrossRef]
- European Committee on Antimicrobial Susceptibility Testing (EUCAST). MIC Distributions and Epidemiological Cut-Off Value (ECOFF) Setting. 2019. Volume SOP 10.1. Available online: www.eucast.org (accessed on 27 June 2020).
- Turnidge, J.; Kahlmeter, G.; Kronvall, G. Statistical characterisation of bacterial wild-type MIC value distributions and the determination of epidemiological cut-off values. Clin. Microbiol. Infect. 2006, 12, 418–425. [Google Scholar] [CrossRef]
- MIC and Zone Diameter Distributions and ECOFFs. Available online: https://www.eucast.org/mic_distributions_and_ecoffs/ (accessed on 12 June 2020).
- Clinical and Laboratory Standards Institute (CLSI). M57: Principles and Procedures for the Development of Epidemiological Cut-Off Values for Antifungal Susceptibility Testing; Clinical and Laboratory Standards Institute: Wayne, PA, USA, 2016. [Google Scholar]
- Clinical and Laboratory Standards Institute (CLSI). Performance Standards for Antimicrobial Susceptibility Testing; Clinical Laboratory Standards Institute: Wayne, PA, USA, 2020. [Google Scholar]
- Kahlmeter, G. Redefining Susceptibility Testing Categories S, I, and R; European Committee on Antimicrobial Susceptibility Testing (EUCAST): Växjö, Sweden, 2019. [Google Scholar]
- Humphries, R.M.; Abbott, A.N.; Hindler, J.A. Understanding and Addressing CLSI Breakpoint Revisions: A Primer for Clinical Laboratories. J. Clin. Microbiol. 2019, 57, e00203-19. [Google Scholar] [CrossRef]
- Arendrup, M.C.; Kahlmeter, G.; Rodriguez-Tudela, J.L.; Donnelly, J.P. Breakpoints for Susceptibility Testing Should Not Divide Wild-Type Distributions of Important Target Species. Antimicrob. Agents Chemother. 2009, 53, 1628–1629. [Google Scholar] [CrossRef]
- Mazloom, R.; Jaberi-Douraki, M.; Comer, J.R.; Volkova, V. Potential Information Loss Due to Categorization of Minimum Inhibitory Concentration Frequency Distributions. Foodborne Pathog. Dis. 2018, 15, 44–54. [Google Scholar] [CrossRef] [PubMed]
- Fedorov, V.; Mannino, F.; Zhang, R. Consequences of dichotomization. Pharm. Stat. 2009, 8, 50–61. [Google Scholar] [CrossRef] [PubMed]
- Zawack, K.; Li, M.; Booth, J.G.; Love, W.; Lanzas, C.; Gröhn, Y.T. Monitoring Antimicrobial Resistance in the Food Supply Chain and Its Implications for FDA Policy Initiatives. Antimicrob. Agents Chemother. 2016, 60, 5302–5311. [Google Scholar] [CrossRef]
- Van der Bij, A.K.; Van Dijk, K.; Muilwijk, J.; Thijsen, S.F.T.; Notermans, D.W.; De Greeff, S.; Van de Sande-Bruinsma, N. Clinical breakpoint changes and their impact on surveillance of antimicrobial resistance in Escherichia coli causing bacteraemia. Clin. Microbiol. Infect. 2012, 18, E466–E472. [Google Scholar] [CrossRef]
- Bjork, K.E.; Kopral, C.A.; Wagner, B.A.; Dargatz, D.A. Comparison of mixed effects models of antimicrobial resistance metrics of livestock and poultry Salmonella isolates from a national monitoring system. Prev. Vet. Med. 2015, 122, 265–272. [Google Scholar] [CrossRef]
- Adams, R.; Smith, J.; Locke, S.; Phillips, E.; Erol, E.; Carter, C.; Odoi, A. An epidemiologic study of antimicrobial resistance of Staphylococcus species isolated from equine samples submitted to a diagnostic laboratory. BMC Vet. Res. 2018, 14, 42. [Google Scholar] [CrossRef]
- Conner, J.G.; Smith, J.; Erol, E.; Locke, S.; Phillips, E.; Carter, C.N.; Odoi, A. Temporal trends and predictors of antimicrobial resistance among Staphylococcus spp. isolated from canine specimens submitted to a diagnostic laboratory. PLoS ONE 2018, 13, e0200719. [Google Scholar] [CrossRef]
- Kahlmeter, G.; Giske, C.G.; Kirn, T.J.; Sharp, S.E. Point-Counterpoint: Differences between the European Committee on Antimicrobial Susceptibility Testing and Clinical and Laboratory Standards Institute Recommendations for Reporting Antimicrobial Susceptibility Results. J. Clin. Microbiol. 2019, 57, e01129-19. [Google Scholar] [CrossRef]
- Aerts, M.; Faes, C.; Nysen, R. Development of statistical methods for the evaluation of data on antimicrobial resistance in bacterial isolates from animals and food. EFSA Support. Publ. 2011, 8, 186. [Google Scholar] [CrossRef]
- Saini, V.; McClure, J.T.; Scholl, D.T.; DeVries, T.J.; Barkema, H.W. Herd-level relationship between antimicrobial use and presence or absence of antimicrobial resistance in gram-negative bovine mastitis pathogens on Canadian dairy farms. J. Dairy Sci. 2013, 96, 4965–4976. [Google Scholar] [CrossRef]
- European Centre for Disease Prevention and Control (ECDC); European Food Safety Authority (EFSA); European Medicines Agency (EMA). ECDC/EFSA/EMA Second joint report on the integrated analysis of the consumption of antimicrobial agents and occurrence of antimicrobial resistance in bacteria from humans and food-producing animals. EFSA J. 2017, 15, e04872. [Google Scholar] [CrossRef]
- Centers for Disease Control and Prevention. National Antimicrobial Resistance Monitoring System for Enteric Bacteria (NARMS): Human Isolates Surveillance Report for 2014; CDC: Atlanta, Georgia, 2016.
- Lewis, J.A. In defence of the dichotomy. Pharm. Stat. 2004, 3, 77–79. [Google Scholar] [CrossRef]
- Hanon, J.-B.; Jaspers, S.; Butaye, P.; Wattiau, P.; Méroc, E.; Aerts, M.; Imberechts, H.; Vermeersch, K.; Van der Stede, Y. A trend analysis of antimicrobial resistance in commensal Escherichia coli from several livestock species in Belgium (2011–2014). Prev. Vet. Med. 2015, 122, 443–452. [Google Scholar] [CrossRef]
- Leite-Martins, L.R.; Mahú, M.I.M.; Costa, A.L.; Mendes, Â.; Lopes, E.; Mendonça, D.M.V.; Niza-Ribeiro, J.J.R.; De Matos, A.J.F.; Da Costa, P.M. Prevalence of antimicrobial resistance in enteric Escherichia coli from domestic pets and assessment of associated risk markers using a generalized linear mixed model. Prev. Vet. Med. 2014, 117, 28–39. [Google Scholar] [CrossRef] [PubMed]
- Austi, P.C.; Tu, J.V.; Alte, D.A. Comparing hierarchical modeling with traditional logistic regression analysis among patients hospitalized with acute myocardial infarction: Should we be analyzing cardiovascular outcomes data differently? Am. Heart J. 2003, 145, 27–35. [Google Scholar] [CrossRef] [PubMed]
- Yeh, Y.-C.; Yeh, K.-M.; Lin, T.-Y.; Chiu, S.-K.; Yang, Y.-S.; Wang, Y.-C.; Lin, J.-C. Impact of vancomycin MIC creep on patients with methicillin-resistant Staphylococcus aureus bacteremia. J. Microbiol. Immunol. Infect. 2012, 45, 214–220. [Google Scholar] [CrossRef]
- Steinkraus, G.; White, R.; Friedrich, L. Vancomycin MIC creep in non-vancomycin-intermediate Staphylococcus aureus (VISA), vancomycin-susceptible clinical methicillin-resistant S. aureus (MRSA) blood isolates from 2001–2005. J. Antimicrob. Chemother. 2007, 60, 788–794. [Google Scholar] [CrossRef]
- Diaz, R.; Afreixo, V.; Ramalheira, E.; Rodrigues, C.; Gago, B. Evaluation of vancomycin MIC creep in methicillin-resistant Staphylococcus aureus infections—A systematic review and meta-analysis. Clin. Microbiol. Infect. 2018, 24, 97–104. [Google Scholar] [CrossRef]
- Van de Kassteele, J.; Van Santen-Verheuvel, M.G.; Koedijk, F.D.; Van Dam, A.P.; Van der Sande, M.A.; De Neeling, A.J. New statistical technique for analyzing MIC-based susceptibility data. Antimicrob. Agents Chemother. 2012, 56, 1557–1563. [Google Scholar] [CrossRef]
- Annis, D.H.; Craig, B.A. Statistical properties and inference of the antimicrobial MIC test. Stat. Med. 2005, 24, 3631–3644. [Google Scholar] [CrossRef]
In the interest of retaining more of the information lost through dichotomization, there are many modeling approaches for MIC data that do not dichotomize the data, several of which will be discussed later in this review. An alternative proposed approach allowing for mixed linear regression is to ignore censoring of the MIC data and instead treat MICs as observations on a continuous scale. However, this interpretation leads to an overestimation of the means and underestimation of the standard errors, increasing the likelihood of type I error [27][28].
References
- World Health Organization. Antimicrobial Resistance: Global Report on Surveillance; WHO Press: Geneva, Switzerland, 2014.
- Centers for Disease Control and Prevention. About Antibiotic Resistance. Available online: https://www.cdc.gov/drugresistance/about.html (accessed on 5 May 2020).
- Naylor, N.R.; Atun, R.; Zhu, N.; Kulasabanathan, K.; Silva, S.; Chatterjee, A.; Knight, G.M.; Robotham, J.V. Estimating the burden of antimicrobial resistance: A systematic literature review. Antimicrob. Resist. Infect. Control 2018, 7, 58, doi:10.1186/s13756-018-0336-y.
- World Health Organization. Integrated Surveillance of Antimicrobial Resistance: Guidance from a WHO Advisory Group; WHO Press: Geneva, Switzerland, 2013.
- Karp, B.E.; Tate, H.; Plumblee, J.R.; Dessai, U.; Whichard, J.M.; Thacker, E.L.; Hale, K.R.; Wilson, W.; Friedman, C.R.; Griffin, P.M.; et al. National Antimicrobial Resistance Monitoring System: Two Decades of Advancing Public Health Through Integrated Surveillance of Antimicrobial Resistance. Foodborne Pathog. Dis. 2017, 14, 545–557, doi:10.1089/fpd.2017.2283.
- Ericsson, H.M.; Sherris, J.C. Antibiotic sensitivity testing. Report of an international collaborative study. Acta Pathol. Microbiol. Scand. 1971, 217, 90.
- European Committee for Antimicrobial Susceptibility Testing (EUCAST) of the European Society of Clinical Microbiology and Infectious Diseases. Determination of minimum inhibitory concentrations (MICs) of antibacterial agents by agar dilution. Clin. Microbiol. Infect. 2000, 6, 509–515, doi:10.1046/j.1469-0691.2000.00142.x.
- Reller, L.B.; Weinstein, M.; Jorgensen, J.H.; Ferraro, M.J. Antimicrobial Susceptibility Testing: A Review of General Principles and Contemporary Practices. Clin. Infect. Dis. 2009, 49, 1749–1755, doi:10.1086/647952.
- Ellington, M.J.; Ekelund, O.; Aarestrup, F.M.; Canton, R.; Doumith, M.; Giske, C.; Grundman, H.; Hasman, H.; Holden, M.T.G.; Hopkins, K.L.; et al. The role of whole genome sequencing in antimicrobial susceptibility testing of bacteria: Report from the EUCAST Subcommittee. Clin. Microbiol. Infect. 2017, 23, 2–22, doi10.1016/j.cmi.2016.11.012.
- Ängeby, K.; Juréen, P.; Kahlmeter, G.; Hoffner, S.E.; Schön, T. Challenging a dogma: Antimicrobial susceptibility testing breakpoints for Mycobacterium tuberculosis. Bull. World Health Organ. 2012, 90, 693–698, doi:10.2471/BLT.11.096644.
- European Committee on Antimicrobial Susceptibility Testing (EUCAST). MIC Distributions and Epidemiological Cut-Off Value (ECOFF) Setting. 2019, Volume SOP 10.1. Available online: www.eucast.org (accessed on 27 June 2020).
- Turnidge, J.; Kahlmeter, G.; Kronvall, G. Statistical characterisation of bacterial wild-type MIC value distributions and the determination of epidemiological cut-off values. Clin. Microbiol. Infect. 2006, 12, 418–425, doi:10.1111/j.1469-0691.2006.01377.x.
- MIC and Zone Diameter Distributions and ECOFFs. Available online: https://www.eucast.org/mic_distributions_and_ecoffs/(accessed on 12 June 2020).
- Clinical and Laboratory Standards Institute (CLSI). M57: Principles and Procedures for the Development of Epidemiological Cut-Off Values for Antifungal Susceptibility Testing; Clinical and Laboratory Standards Institute: Wayne, PA, USA, 2016.
- Clinical and Laboratory Standards Institute (CLSI). Performance Standards for Antimicrobial Susceptibility Testing; Clinical Laboratory Standards Institute: Wayne, PA, USA, 2020.
- Kahlmeter, G. Redefining Susceptibility Testing Categories S, I, and R; European Committee on Antimicrobial Susceptibility Testing (EUCAST): Växjö, Sweden, 2019. Available online: www.eucast.org (accessed on 2 June 2020).
- Humphries, R.M.; Abbott, A.N.; Hindler, J.A. Understanding and Addressing CLSI Breakpoint Revisions: A Primer for Clinical Laboratories. J. Clin. Microbiol. 2019, 57, e00203-19, doi:10.1128/jcm.00203-19.
- Arendrup, M.C.; Kahlmeter, G.; Rodriguez-Tudela, J.L.; Donnelly, J.P. Breakpoints for Susceptibility Testing Should Not Divide Wild-Type Distributions of Important Target Species. Antimicrob. Agents Chemother. 2009, 53, 1628–1629, doi:10.1128/aac.01624-08.
- Mazloom, R.; Jaberi-Douraki, M.; Comer, J.R.; Volkova, V. Potential Information Loss Due to Categorization of Minimum Inhibitory Concentration Frequency Distributions. Foodborne Pathog. Dis. 2018, 15, 44–54, doi:10.1089/fpd.2017.2301.
- Fedorov, V.; Mannino, F.; Zhang, R. Consequences of dichotomization. Pharm. Stat. 2009, 8, 50–61, doi:10.1002/pst.331.
- Zawack, K.; Li, M.; Booth, J.G.; Love, W.; Lanzas, C.; Gröhn, Y.T. Monitoring Antimicrobial Resistance in the Food Supply Chain and Its Implications for FDA Policy Initiatives. Antimicrob. Agents Chemother. 2016, 60, 5302–5311, doi:10.1128/AAC.00688-16.
- Van der Bij, A.K.; Van Dijk, K.; Muilwijk, J.; Thijsen, S.F.T.; Notermans, D.W.; De Greeff, S.; Van de Sande-Bruinsma, N. Clinical breakpoint changes and their impact on surveillance of antimicrobial resistance in Escherichia coli causing bacteraemia. Clin. Microbiol. Infect. 2012, 18, E466–E472, doi:10.1111/j.1469-0691.2012.03996.x.
- Aerts, M.; Faes, C.; Nysen, R. Development of statistical methods for the evaluation of data on antimicrobial resistance in bacterial isolates from animals and food. EFSA Support. Publ. 2011, 8, 186, doi:10.2903/sp.efsa.2011.EN-186.
- Yeh, Y.-C.; Yeh, K.-M.; Lin, T.-Y.; Chiu, S.-K.; Yang, Y.-S.; Wang, Y.-C.; Lin, J.-C. Impact of vancomycin MIC creep on patients with methicillin-resistant Staphylococcus aureus bacteremia. J. Microbiol. Immunol. Infect. 2012, 45, 214–220, doi:10.1016/j.jmii.2011.11.006.
- Steinkraus, G.; White, R.; Friedrich, L. Vancomycin MIC creep in non-vancomycin-intermediate Staphylococcus aureus (VISA), vancomycin-susceptible clinical methicillin-resistant S. aureus (MRSA) blood isolates from 2001–2005. J. Antimicrob. Chemother. 2007, 60, 788–794, doi:10.1093/jac/dkm258.
- Diaz, R.; Afreixo, V.; Ramalheira, E.; Rodrigues, C.; Gago, B. Evaluation of vancomycin MIC creep in methicillin-resistant Staphylococcus aureus infections—A systematic review and meta-analysis. Clin. Microbiol. Infect. 2018, 24, 97–104, doi:10.1016/j.cmi.2017.06.017.
- Van de Kassteele, J.; Van Santen-Verheuvel, M.G.; Koedijk, F.D.; Van Dam, A.P.; Van der Sande, M.A.; De Neeling, A.J. New statistical technique for analyzing MIC-based susceptibility data. Antimicrob. Agents Chemother. 2012, 56, 1557–1563, doi:10.1128/AAC.05777-11.
- Annis, D.H.; Craig, B.A. Statistical properties and inference of the antimicrobial MIC test. Stat. Med. 2005, 24, 3631–3644, doi:10.1002/sim.2207.