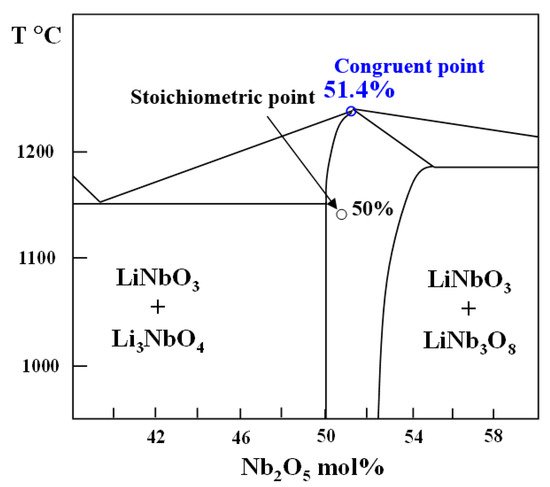
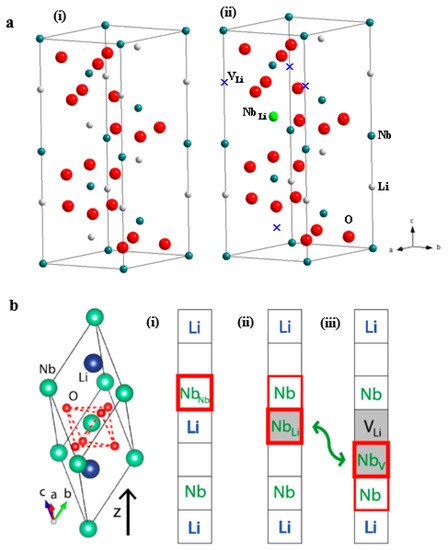
Due to its piezoelectric, ferroelectric, nonlinear optics, and pyroelectric properties, LiNbO3 crystal has found its wide applications in surface acoustic wave (SAW) devices, optical waveguides, optical modulators, and second-harmonic generators (SHG). LiNbO3 crystallized as R3c space group below Curie temperature shows spontaneous polarization that leads to its ferroelectric and piezoelectric properties. Physical and chemical characteristics of LiNbO3 are mainly determined by Li/Nb ratio, impurity cations, vacancies in a cation sublattice. Different sizes of LiNbO3 ranging from nanoscale and microscale to bulk size have been synthesized by solid state method, hydrothermal/solvothermal method, Czochralski (Cz) growth method, etc. Most basic and applied studies of LiNbO3 focus on its bulk single crystal.
- LiNbO3
- crystal growth
- piezoelectric property
- optical property
1. Crystal and Defect Structures of LiNbO3
2. Crystallization of LiNbO3

| Testing Method | Advantages | Disadvantages | ||
|---|---|---|---|---|
| Raman scattering method | Raman systems have become cheaper and easier to use | The use of a correct configuration of the detection and excitation polarizers (in the case of single crystals) | ||
| Curie temperature | Linearly with Li/[Li + Nb] ratio Reliable and sufficient sensitivity for composition |
High Curie temperature close to the melting point | ||
| UV absorption edge | Convenient and accurate way for determining the composition | Nonlinear relationship Accuracy is governed by the wavelength calibration Doping compound will deteriorate the accuracy | - | [28][14] |
| 0.4–1.5 | 10–30 | 50 × 30 | Δ[Li2O] < 0.005 | [29][15] |
| 1–2.5 | 10–25 | 80 × 60 | Δ[Li2O] < 0.02 | [30][16] |
| 2.8–4.0 | 3–10 | 100 × 80 | Δ[Li2O] < 0.002 | [22][8] |
3. Composition Characterizations of LiNbO3
| Refractive indices | ||
| Function of wavelength and stoichiometry | Nonlinear relationship | |
| Birefringence | Approximately linear correspondence between Li content and birefringence | The nonlinear relationships dominated by the wavelength |
References
- Kong, Y.; Bo, F.; Wang, W.; Zheng, D.; Liu, H.; Zhang, G.; Rupp, R.; Xu, J. Recent progress in lithium niobate: Optical damage, defect simulation, and on-chip devices. Adv. Mater. 2020, 32, 1806452.
- Schmidt, F.; Kozub, A.L.; Biktagirov, T.; Eigner, C.; Silberhorn, C.; Schindlmayr, A.; Schmidt, W.G.; Gerstmann, U. Free and defect-bound (bi)polarons in LiNbO3: Atomic structure and spectroscopic signatures from ab initio calculations. Phys. Rev. Res. 2020, 2, 043002.
- Zotov, N.; Boysen, H.; Frey, F.; Metzger, T.; Born, E. Cation substitution models of congruent LiNbO3 investigated by X-ray and neutron powder diffraction. J. Phys. Chem. Solids 1994, 55, 145–152.
- Kim, S.; Gopalan, V. Domain reversal and nonstoichiometry in lithium tantalate. J. Appl. Phys. 2001, 90, 2949–2963.
- Teplyakova, N.A.; Sidorov, N.V.; Palatnikov, M.N. Determination of stoichiometry, concentration of OH groups, and point defects in lithium niobate crystals from their IR absorption spectra. Opt. Spectrosc. 2020, 128, 1131–1137.
- Sánchez-Dena, O.; Fierro-Ruiz, C.D.; Villalobos-Mendoza, S.D.; Carrillo Flores, D.M.; Elizalde-Galindo, J.T.; Farías, R. Lithium niobate single crystals and powders reviewed—Part I. Crystals 2020, 10, 973.
- Palatnikov, M.N.; Biryukova, I.V.; Masloboeva, S.M.; Makarova, O.V.; Kravchenko, O.E.; Yanichev, A.A.; Sidorovet, N.V. Structure and optical homogeneity of LiNbO3 〈Mg〉 crystals grown from different charges. Inorg. Mater. 2013, 49, 715.
- Chen, K.; Li, Y.; Peng, C.; Lu, Z.; Luo, X.; Xue, D. Microstructure and defect characteristics of lithium niobate with different Li concentrations. Inorg. Chem. Front. 2021, 8, 4006–4013.
- Kohler, T.; Mehner, E.; Hanzig, J.; Gärtner, G.; Funke, C.; Joseph, Y.; Leisegang, T.; Stöcker, H.; Meyer, D.C. Kinetics of the hydrogen defect in congruent LiMO3. J. Mater. Chem. C 2021, 9, 2350–2367.
- Reisman, A.; Holtzberg, F. Heterogeneous Equilibria in the Systems Li2O-, Ag2O-Nb2O5 and Oxide-Models. J. Am. Chem. Soc. 1958, 80, 6503–6507.
- Sanna, S.; Schmidt, W. LiNbO3 surfaces from a microscopic perspective. J. Phys. Condens. Matter 2017, 29, 413001.
- Wang, S.; Ji, C.; Dai, P.; Shen, L.; Bao, N. The growth and characterization of six inch lithium niobate crystals with high homogeneity. CrystEngComm 2020, 22, 794–801.
- Zhang, X.; Liang, G.; Xu, Z. Defect structure and holographic storage properties of LiNbO3:Zr:Fe:Cu crystals with various Li/Nb ratios. Opt. Mater. 2019, 96, 109318.
- Kong, T.; Liang, P.; Liu, H.; Zheng, D.; Liu, S.; Chen, S.; Kong, Y.; Xu, J. Study on the Growth and Optical Damage Resistance of Ternary Congruent Mg-doped LiNbO3 Crystal. J. Synthetic Crystals 2018, 8, 1507–1511.
- Zheng, Y.; Kong, H.; Chen, H.; Xin, J.; Lu, Z.; Shi, E. Growth and ferroelectric domain control of homogeneous MgO-doped near-stoichiometric lithium niobate single crystals by melt-supplying technique. J. Cryst. Growth 2008, 310, 1966–1970.
- Xu, B.; Xia, Z.; Li, C.; Cui, K.; Ye, S.; Zhang, C. Growth and Measurement Method of Optics-grade and Large Diameter Lithium Niobate Crystals. J. Synthetic Crystals 2002, 5, 516–519.
- Zhi, Y.; Zhu, Y.; Pan, W.; Tianet, K. Optical method to determine the composition of lithium niobate crystals by digital holography. Appl. Opt. 2020, 59, 315.
- Sánchez-Dena, O.; Villagómez, C.J.; Fierro-Ruíz, C.D.; Padilla-Robles, A.S.; Farías, R.; Vigueras-Santiago, E.; Hernández-López, S.; Reyes-Esqueda, J.A. Determination of the chemical composition of lithium niobate powders. Crystals 2019, 9, 340.
- Kokanyan, N.; Chapron, D.; Fontana, M. Temperature dependence of Raman scattering and anharmonic properties in LiNbO3. Appl. Phys. A 2014, 117, 1147.
- Redfield, D.; Burke, W.J. Optical absorption edge of LiNbO3. J. Appl. Phys. 1974, 45, 4566.
- Hu, L.J.; Chang, Y.H.; Chang, C.S. Raman and NMR study in MgO-doped LiNbO3 crystal, Mod. Phys. Lett. B 1991, 5, 789–797.
- Fontana, M.D.; Bourson, P. Microstructure and defects probed by Raman spectroscopy in lithium niobate crystals and devices. Appl. Phys. Rev. 2015, 2, 040602.
- Margueron, S.; Margueron, S.; Bartasyte, A.; Glazer, A.M.; Simon, E.; Hlinka, J.; Gregora, I.; Gleize, J. Resolved E-symmetry zone-centre phonons in LiTaO3 and LiNbO3. J. Appl. Phys. 2012, 111, 104105.
- Wohlecke, M.; Corradi, G.; Betzler, K. Optical methods to characterise the composition and homogeneity of lithium niobate single crystals. Appl. Phys. B 1996, 63, 323–330.
- Schlarb, U.; Klauer, S.; Wesselmann, M.; Betzler, K.; Wöhlecke, M. Determination of the Li/Nb ratio in lithium niobate by means of birefringence and Raman measurements. Appl. Phys. A 1993, 56, 311–315.

