Your browser does not fully support modern features. Please upgrade for a smoother experience.
Please note this is a comparison between Version 1 by Peng Li and Version 2 by Jessie Wu.
The areca palm (Areca catechu L.), an important economic and medicinal crop widely cultivated in the tropical zone, has been utilised extensively in agriculture, industry, and for religious purposes. Here, the diversity of areca palm rhizosphere microbiota were analyzed to further study the effect of the areca palm's development stages on the rhizosphere microbiota.
- areca palm (Areca catechu L.)
- bacterial diversity
- interaction network
1. Background
The areca palm is the second-largest tropical cash crop, and is becoming one of the main economic pillars of Hainan, China. Most attention given to the areca palm has been dedicated to revealing its genetic variability [1][3], genome assembly [2][4], elucidation of its secondary metabolite pathways by transcriptome sequencing [3][5], and the microbiome and metabolome analysis of its leaves [4][6]. Despite the economic importance of the areca palm, little work has been done to explore its rhizosphere microbiome. Numerous cases on the plant root microbiome have demonstrated that microbes play key roles in supporting plant nutrition and health [5][6][7,8]. In return, the compounds released by the plants can also affect the rhizosphere soil directly, and the rhizosphere microorganisms are generally influenced by the soil type [5][7], environmental conditions [7][9], plant genotype [8][10], and plant developmental stage [9][11]. In its entirety, the rhizosphere is an environment where a large number of microbes communicate extensively, and the plant shapes the rhizosphere microbiome [6][10][8,12].
Results of the root exudation patterns of phytochemicals during plant development, together with community profiling and transcriptome analysis of their associated rhizosphere microbiota, indicated that the microbiota trigger certain beneficial functions of the plants through the exudation of particular chemical compounds that vary with the changing requirements during plant development [11][13]. Further, a subset of soil microbes, for the specific needs of the plants, can be recruited by the plant exudates [12][14]. These complex, plant-associated microbiota are also deemed the second genome of the plant, which is crucial for plant health [13][15]. Thus, plant–microbe interactions are of specific interest, not only to reveal their role during plant growth and development, but also to investigate their relationships to sustainable crop health
2. Bacterial and Fungal Diversity of the Areca Palm Rhizosphere
The bacterial diversity of the soil samples collected from the four different growth stages and the bulk soil was assessed using phylotype taxonomy. A total of 15 soil samples were sequenced and 715,276 raw reads were obtained. The results revealed a total of 6056 OTUs, which belonged to 913 genera and 1900 species. There were 3525, 3258, 3270, 3427, and 3534 OTUs in the T1, T2, T3, T4, and bulk soil samples, respectively. The number of core OTUs (found at all samples) was 1309, accounting for 21.62% of the total OTUs. The T1, T2, T3, and T4 stages exhibited 311, 260, 269, and 274 unique OTUs, respectively (Figure 1A). The result of the Student′s t-test further indicated that the Sobs index of the OTU level between T1 and T4, T2 and bulk soil, T3 and T4, and T4 and bulk soil were significant (Figure 1A). A total of 1579 core OTUs from 461 genera were detected in the samples T1, T2, T3, and T4, among which the dominant genera were Burkholderia-Caballeronia-Paraburkholderia (10.69%), Bacillus (5.33%), Acidothermus (4.65%), norank_o_Acidobacteriales (3.99%, belongs to Order Acidobacteriales), Actinospica (3.63%), Allorhizobium-Neorhizobium-Pararhizobium-Rhizobium (3.14%), and Xanthobacteraceae (3.08%) (Figure 2A).
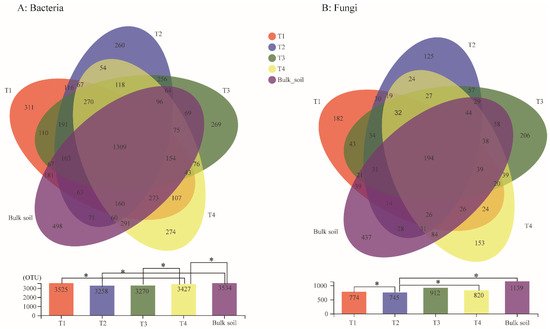
Figure 1. Venn analysis of shared and unique bacteria (A) and fungi (B) OTUs among four different growth stages and bulk soil samples. OTUs defined by 97% sequence similarity and Student’s t-test of OTU level among the soil samples were detected. * means p ≤ 0.05.
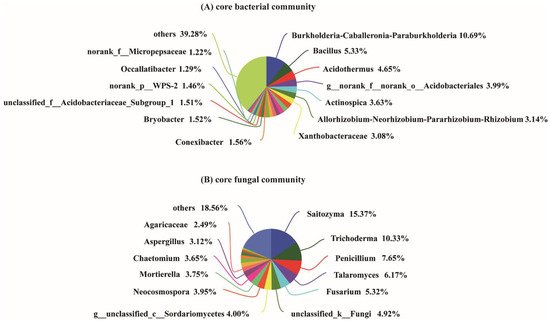
Figure 2. Core bacterial (A) and fungal (B) genera of four development stages of the areca palm. Core genera means that the genera existed in the rhizosphere soil of the four stages. “others” indicates genera with relative abundance less than 1%.
In addition, for the analysis of the fungal OTUs, 15 soil samples were sequenced and 1,025,914 raw reads were obtained. A total of 2936 fungal OTUs belonging to 596 genera and 967 species were identified among the five sample groups. There were 774, 745, 912, 820, and 1139 fungal OTUs in the T1, T2, T3, T4, and bulk soil samples, respectively. The Venn diagram analysis demonstrated that the core fungal OTUs were 194, accounting for 6.61% of the total OTUs. The T1, T2, T3, and T4 stages exhibited 182, 125, 206, and 153 unique fungal OTUs, respectively (Figure 1A). Furthermore, the β-diversity analysis indicated that the OTUs between T1 and T2, T2 and T4, and T2 and bulk soil reached a significant level (Figure 1B). Among the samples T1, T2, T3 and T4, the 226 core fungal OTUs belonged to 130 genera, and the main genera were Saitozyma (15.37%), Trichoderma (10.33%), Penicillium (7.65%), Talaromyces (6.17%), Fusarium (5.32%), unclassified_k__Fungi (4.92%), g_unclassified_c_Sordariomycetes (4%), Neocosmospora (3.95%), Mortierella (3.75%), Chaetomium (3.65%), Aspergillus (3.12%), and Agaricaceae (2.49%) (Figure 2B).
3. Bacterial Composition at Different Growth Stages
The primary bacterial genera in the areca palm T1 rhizosphere samples were Burkholderia-Caballeronia-Paraburkholderia (relative abundance 12.91%), Allorhizobium-Neorhizobium-Pararhizobium-Rhizobium (8.47%), Actinospica (3.64%), Bradyrhizobium (3.15%), Acidothermus (3.09%), norank_f_norank_o_Acidobacteriales (2.86%), Streptomyces (2.51%), and Bacillus (2.06%); the genera Burkholderia-Caballeronia-Paraburkholderia (15.03%), Acidothermus (4.59%), norank_f_norank_o_Acidobacteriales (4.28%), Actinospica (4.66%), Bradyrhizobium (3.25%), norank_f_Xanthobacteraceae (3.93%), norank_f_LWQ8 (3.99%), Allorhizobium-Neorhizobium-Pararhizobium-Rhizobium (2.96%), Acidibacter (2.32%), and norank_f_norank_o_Elsterales (2.14%) were the dominant groups in the T2 rhizosphere samples; the genera Acidothermus (6.05%), norank_f_norank_o_Acidobacteriales (5.94%), Burkholderia-Caballeronia-Paraburkholderia (5.57%), norank_f_Xanthobacteraceae (3.93%), Acidibacter (3.75%), Actinospica (3.39%), norank_f_norank_o_Subgroup_2 (3.45%), norank_f_norank_o_Elsterales (3.02%), and Bradyrhizobium (2.87%) were the dominant groups in the T3 rhizosphere samples; and the genera Bacillus (21.21%), Burkholderia-Caballeronia-Paraburkholderia (7.99%), Acidothermus (4.57%), norank_f_norank_o_Acidobacteriales (2.22%), Streptomyces (2.85%), Bradyrhizobium (2.61%), Actinospica (2.32%), and Acidibacter (2.22%) were the dominant groups in the T4 rhizosphere samples (Figure 3). In addition, the result of the PCoA also revealed that the bacterial genera of the four growth stages and bulk soil samples were varied distinctly, and the PC1 axis showed 45.2% variation among them.
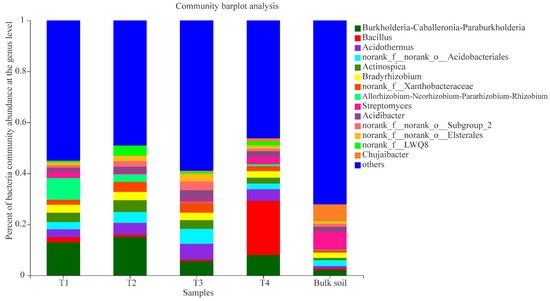
Figure 3. Composition of bacterial communities (T1, T2, T3, T4, and bulk soil) at the genus level; “others” indicates genera with relative abundance less than 0.03%.
4. Fungal Composition at Different Growth Stages
The fungal composition at the different growth stages and bulk soil samples were also analysed. In the stage T1, the primary fungal genera were Neocosmospora (9.60%), Talaromyces (9.25%), Fusarium (8.99%), Penicillium (6.57%), unclassified_f_Agaricaceae (5.88%), unclassified_k_Fungi (5.54%), unclassified_c_Sordariomycetes (4.21%), Curvularia (3.87%), and Trichoderma (3.65%); the dominant genera at stage T2 were Saitozyma (45.09%), Trichoderma (12.73%), Mycoleptodiscus (5.93%), unclassified_k_Fungi (5.79%), Gliocladiopsis (3.73%), Talaromyces (2.97%), and Fusarium (2.57%); at stage T3, the main groups were Penicillium (18.67%), Aspergillus (10.18%), Trichoderma (8.79%), Mortierella (8.77%), Talaromyces (6.08%), Saitozyma (5.76%), Nigrospora (4.70%), Fusarium (3.74%), unclassified_c_Sordariomycetes (3.07%), unclassified_k_Fungi (2.24%), and Neocosmospora (2.19%); and at stage T4, the dominant genera were Trichoderma (16.43%), Chaetomium (13.56%), unclassified_c_Sordariomycetes (7.70%), unclassified_k_Fungi (5.52%), Talaromyces (5.25%), Fusarium (5.08%), Saitozyma (4.87%), Mortierella (3.23%), Penicillium (2.41%), and Neocosmospora (2.29%) (Figure 4). The result of the PCoA analysis indicated that the fungal communities of the four growth stages and bulk soil samples were also dynamic, and the PC1 axis showed 21.87% variation among them (Figure S2).
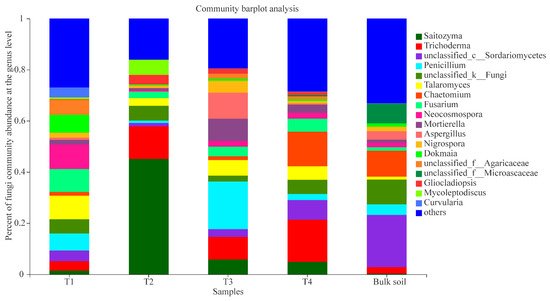
Figure 4. Composition of fungal communities (T1, T2, T3, T4, and bulk soil) at the genus level; “others” indicates genera with relative abundance less than 0.03%.
5. Microbial Genera with Significant Differences among the Samples
For bacteria, the relative abundance of the genera Burkholderia-Caballeronia-Paraburkholderia, unclassified_g_Acidothermus, Rhizobium phaseoli, norank_f_Xanthobacteraceae, and unclassified_g_Chujaibacter reached significance (95% CI, p < 0.05) (Figure 5). For fungi, the relative abundance of the genera Saitozyma, Penicillium, Chaetomium, Aspergillus, and unclassified_f_Microascaceae were significant (95% CI, p < 0.05; Figure 6).
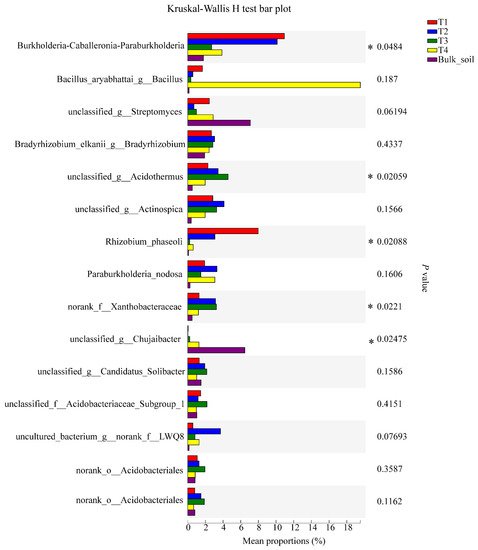
Figure 5. Significant differences in the abundance of bacterial genera among the soil samples, based on the Kruskal-Wallis H test (95% confidence interval, CI). * means p ≤ 0.05.
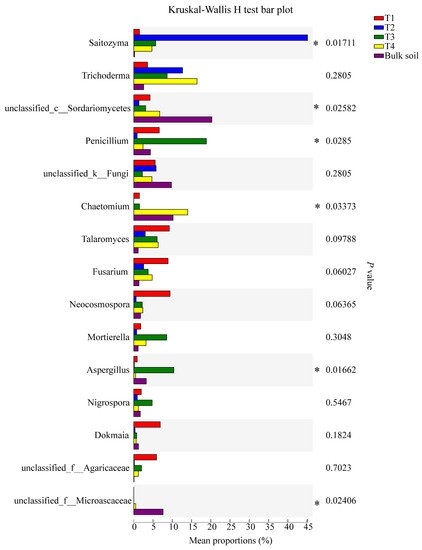
Figure 6. Significant differences in the abundance of fungal genera among the soil samples, based on the Kruskal-Wallis H test (95% confidence interval, CI). * means p ≤ 0.05.
6. Bacterial and Fungal Network Analyses
A network analysis to reveal the symbiotic relationships of species in the areca palm soil samples. The network analysis of these abundant OTUs revealed the interaction between the rhizosphere soil bacteria and fungi. In the bacterial network, the results indicated extensive interactions among the identified genera. These abundant OTUs were from 17 genera, such as the main genera Burkholderia-Caballeronia-Paraburkholderia (four OTUs), the genus Acidothermus (three OTUs), the genus norank_f_norank_o_Acidobacteriales (two OTUs), Streptomyces (two OTUs), and norank_f_Xanthobacteraceae (two OTUs). Interestingly, OTU5523 (from Bacillus) only had a positive correlation with OTU3045 (from Streptomyces) and was negatively correlated with all the other OTUs. In addition, OTU5523 showed a strong negative correlation with OTU1197, while OTU3045 revealed a strong negative correlation with OTU2543, OTU5032 and OTU1261 (Figure 7).
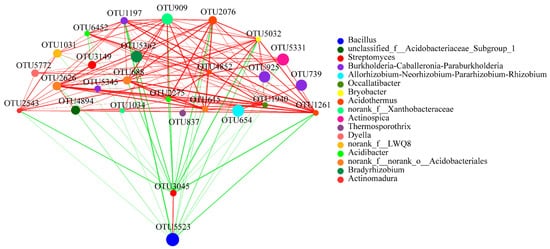
Figure 7. Bacterial interaction network analysis at the OTU level of four different growth stages. Different node colours represent different bacteria genera. Blue lines represent negative interactions; red lines represent positive interactions among different nodes. The OTUs with the thresholds of r ≥ 0.5 and p < 0.05 were selected.
In the fungal network, results indicated that the relationship of the five OTUs (OTU165, OTU903, OTU759, OTU1453, and OTU2260) of Penicillium were positively correlated, and a strong correlation existed between OTU336 and OTU903; OTU512 had a high relative abundance and only showed a negative correlation with four OTUs (OTU90, OTU206, OTU274, and OTU2860), but a strong positive correlation was found between OTU90 and OTU274. A strong positive correlation also existed between OTU856 and OTU2260 (Figure 8).
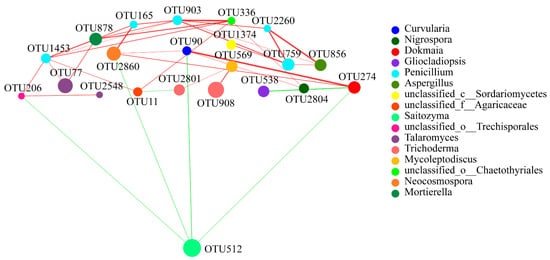
Figure 8. Fungal interaction network analysis at the OTU level of four different growth stages. Different node colours represent different bacteria genera. Blue lines represent negative interactions; red lines represent positive interactions among different nodes. The OTUs with the thresholds of r ≥ 0.5 and p < 0.05 were selected.