1. Effect of Urease Enzyme Activity and Concentration
Both the enzyme concentration and urease activity have a significant effect on EICP treatment. The enzyme concentration is routinely represented as grams of enzyme per liter of cementing solution (g/L). The urease activity unit is usually represented as U/g, which means the µmol of urea hydrolysed per minute by 1 g of urease; this property depends mainly on the enzyme source and extraction method
[1][40]. The literature on EICP highlighted the importance of finding the optimum amount of urease concentration to fully consume substrate (urea) in the solution. This optimization is essential to achieve high hydrolysing efficiency and reduce the cost of treatment. Several researchers have conducted the optimization based on increasing the precipitation ratio (PR%), defined as the carbonate precipitated mass over the maximum theoretical carbonate precipitation mass, calculated based on the EICP solution constituents. Several studies on the optimization of enzyme concentration have utilized electrical conductivity (EC) measurements of the EICP cementing solution as an index of the ionic strength of the solution (concentration of the chemical constituents).
As shown in
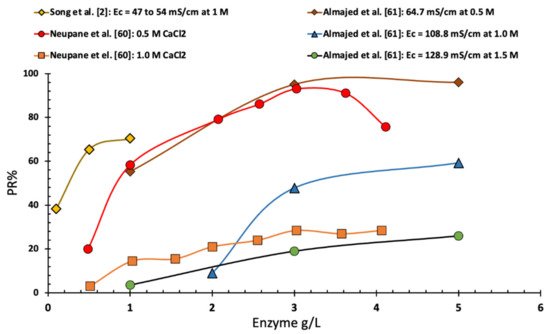
Figure 15, Neupane et al.
[2][60] found that the precipitation ratio, in the case of EICP solution with an equal molar of urea and calcium chloride with a calcium chloride concentration of 0.5 M, rapidly increased with the increase in urease enzyme concentration until reaching a urease concentration of 2.0 g/L. Increasing the concentration of enzyme more than 2.0 g/L led to a slow and gradual increase in precipitation ratio up to a maximum of 90% at a concentration of 3.0 g/L. Further increase in the enzyme concentration led to a slightly lower precipitation ratio. However, in the same study and for a higher concentration of calcium chloride (1 M) of equimolar EICP solution, the increase in enzyme resulted in a continuous increase in PR%. Moreover, Almajed et al.
[3][61] reported that an increase in the enzyme concentration, up to 6 g/L, led to an increase in the precipitation ratio regardless of the EICP solution. Almajed et al.
[3][61] reported an optimal enzyme concentration of 3 g/L. Finally, Song et al.
[4][2] showed a similar trend of increasing the precipitation rate with the increase of enzyme concentration (see
Figure 15).
Figure 15. Change in precipitation ratio vs. enzyme concentration (data collected from several sources).
Carmona et al.
[5][62] claimed that using 8 kU/L of urease concentration, the increase in urea–CaCl
2 concentration beyond 0.5 mol/L lowered the amount of hydrolysed urea, thereby yielded a lower mass of calcium carbonate precipitation. Carmona et al.
[5][62] attributed this to the increase of reagents concentration that may inhibit the catalysation capacity of urease. Moreover, the same amount of urease concentration (8 kU/L) mixed with urea–CaCl
2 concentration of 0.25 mol/L led to less calcite precipitation; thus, an excessive amount of the urease enzyme compared to the concentration of urea–CaCl
2 may suppress its catalysing efficiency according to this study.
Song et al.
[4][2] studied the effect of urease concentration to evaluate the precipitation rate and quantify calcium carbonate formation with respect to time. They showed that the calcium carbonate precipitation rate can be increased by the urease concentration increase. Ahenkorah et al.
[6][63] performed SEM imaging on calcium carbonate tube precipitates. SEM images showed that CaCO
3 precipitates from a solution containing low active urease enzyme (3500 U/g) have a disordered and anhedral calcite crystal, while the high active urease enzyme (40,150 U/g) resulted in euhedral and agglomerated rhombohedral calcite morphology.
Generally speaking, the effect of increasing the enzyme concentration can be illustrated using enzyme kinetics, which was first proposed by Michaelis and Menten
[7][64] to study the factors affecting the speed of the enzyme reaction
[8][9][65,66]. According to Michaelis and Menten’s
[7][64] model, the increase in the enzyme concentration results in a linear increase in the initial reaction velocity (V
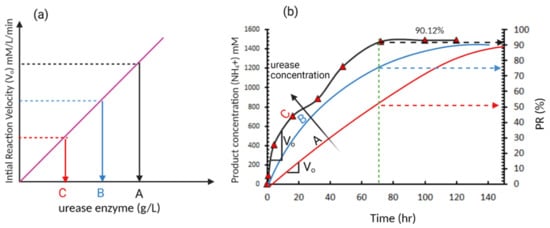
o), as shown in
Figure 26a. The EICP reaction velocity, after mixing the enzyme with substrate: urea, can be monitored by continuously measuring the concentration of the hydrolysis product (NH
4+) formation over time
[10][67]. Few studies have used this approach in evaluating the EICP kinetics and mostly relied on PR. Miftah et al.
[11][68] monitored the NH
4+ concentration over time, as shown in
Figure 26b, showing slower rate hydrolysis of urea (production of NH
4+) with time. The slower rate of hydrolysis with time can be attributed to the consumption of the substrate (urea) with time and therefore it becomes a limiting factor or due to denaturalization of enzyme due to the presence of inhibitors. If three enzyme concentration levels (A, B, and C) are considered, as shown in
Figure 6a, an increase in the initial reaction velocity (V
o) will be obtained. This increase in reaction rate due to the increase in enzyme concentration results in a faster rate of hydrolysis and reduction of time needed to reach 100% PR. This may illustrate the different optimum enzyme concentrations reported from different studies, as most of these studies did not consider the reaction kinetics and evaluated the EICP outputs after constant time. For example, Almajed et al.
[3][61] and Neupane et al.
[2][60] evaluated the PR after 72 h assuming the reaction is concluded. However, as illustrated in
Figure 26a, this may not be always true and it may need a longer time for the reaction to conclude especially at lower enzyme concentrations. Therefore, it is recommended in future studies to include the enzyme kinetics in the optimization process based on monitoring NH
4+ production over time, not just carbonate precipitation mass and precipitation ratio.
Figure 26. A typical enzyme-catalysed reaction (
a) initial reaction velocity versus enzyme concentration (typical reaction based on Michaelis and Menten model) (
b) product formation over time (data adopted from Miftah et al.
[11][68]).
2. Chemical Constituents Concentrations
Optimizing EICP chemical constituents is desirable to achieve a cost-effective cementing solution while maintaining a high amount of carbonate precipitation. It is believed that the amount of precipitation and reagents concentration has a significant effect on the hydrolysis process. Various studies have reported different optimum concentrations of chemical constituents for the EICP solution to maximize carbonate precipitation. Nemati & Voordouw
[12][9], and Nemati et al.
[13][69] reported an increase in carbonate precipitation with the increase in urea and calcium chloride concentration up to a certain level. Yasuhara et al.
[14][26] reported that using a higher amount of calcium source led to a higher degree of precipitation formation. However, Neupane et al.
[2][60] reported that using a lower concentration of constituents (equimolar of urea and calcium chloride) can lead to a higher precipitation ratio; they reported that 0.5 mol/L had a precipitation ratio of 80%, which was higher than the PR achieved at 1.0 mol/L. Chandra & Ravi
[15][70] studied the optimum combination of urea and calcium chloride in a bench-level tube test and evaluated the precipitation by gravimetrically measuring the amount of precipitated calcium carbonate. They prepared several equimolar concentrations of urea–CaCl
2 of 0.25, 0.5, 0.75, 1.0, and 1.25 mol/L with 0.2 g/L of urease enzyme. It was concluded that the increase in urea–CaCl
2 concentration may inhibit the activity of urease and reduce the precipitation amount of calcium carbonate, hence, reducing the hydrolysing efficiency. The fact that the increase of urea–CaCl
2 in the concentration may inhibit the activity of the urease enzyme was also reported by Carmona et al.
[5][62]. Almajed et al.
[3][61] correlated the efficiency of the urease enzyme with the solution EC that is controlled by the ratio and concentration of urea–CaCl
2. It was found that for each enzyme concentration, there is a critical EC value representing the maximum concentration of calcium chloride and urea, which results in nearly complete precipitation. Moreover, beyond a certain threshold value for the EC reading, the precipitation ratio dropped drastically. Finally, Ahenkorah et al.
[6][63] found that the rate of change in electric conductivity increases with the increase in urease enzyme concentration regardless of the activity.
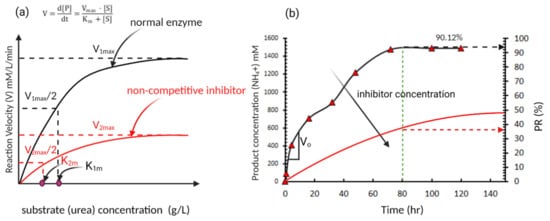
The effect of the substrate (urea) concentration in the EICP cementing solution can be illustrated using the enzyme kinetics model proposed by Michaelis and Menten
[7][64]. In this model, the rate of hydrolysis is considered as hyperbolic with the change of the hydrolysis rate (V) increases with the substrate concentration [S] (urea concentration in this case) until it reaches an asymptote at V = V
max, as shown in
Figure 37a. Where V is defined as the rate of change in the product concentration [P] (NH
4+ in this case). Equation (8) defines the rate of hydrolysis based on the Michaelis constants K
m, and V
max.
Figure 37. A typical enzyme-catalysed reaction (showing the effect of inhibitors in an enzyme-catalysed reaction) (
a) initial reaction velocity versus substrate concentration [S] (typical reaction based on Michaelis and Menten model); (
b) product formation over time (data for normal enzyme adapted from Miftah et al.
[11][68]).
This model suggests that the increase in substrate (urea) concentration increases the rate of hydrolysis which agrees with the reported behaviour in several studies (e.g.,
[12][13][9,69]). However, the rate of urea hydrolysis (V) is also affected by inhibitors that may affect the rate of carbonate precipitation and even denaturalize the urease enzyme. These inhibitors can be categorized as competitive inhibitors where V
max remains the same and non-competitive inhibitors where V
max changes depending on the concentration of inhibitor, as shown in
Figure 37b
[10][67]. Recently, Ahenkorah et al.
[16][71] introduced a normalized enzyme concertation term [E
S] (defined as enzyme concentration multiplied by enzyme activity) to explain the effect of Enzyme and substrate concentration [S] on the PR%. PR% was found to exhibit a non-linear correlation with the ratio [E
S]/[S] with an optimum value of 20 kU/mol beyond which no increase in PR% was reported.
Several studies have shown that ammonium ions (a by-product from the hydrolysis process) in the EICP solution act as a non-competitive inhibitor
[7][17][18][64,72,73], as shown conceptionally in
Figure 37. This may illustrate the reported reduction in carbonate precipitation beyond a specific threshold of substrate (urea) concentration (e.g,
[3][61]). This may also be illustrated more in Hamdan’s
[19][58] study in which a series of experiments were conducted to define the optimum ratio of (urea to CaCl
2) in EICP solution. Hamdan
[19][58] compared the ureolysis efficiency at low (0.1 to 0.6 M) and high (1.0 and 6.0 M) substrate concentrations, and the test was conducted by preparing EICP solutions with varying concentrations and ratios between the reagents. Although a high concentration solution yielded more calcium carbonate than a low concentration, it was found that the lower concentration had a better ureolysis efficiency (higher PR).
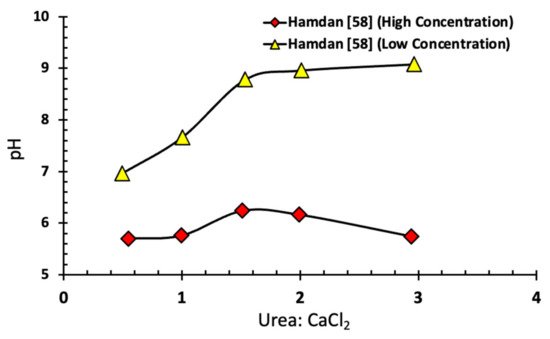
Figure 48 shows the relationship between the initial ratio of urea to CaCl
2 and the pH of the EICP cementing solution. Hamdan
[19][58] showed that this drop in pH has a role in reducing the hydrolysis rate. High pH leads to an increase in calcium carbonate precipitation that limits the transformation of ammonia into the acidic form (NH
+4), thereby preventing the reversal of calcium carbonate formation.
Figure 48. Relationship between initial CaCl
2-urea ratio, and pH for high and low substrate concentration
[19][58].
The above studies may suggest that an increase in substrate (urea) concentration will increase the hydrolysis reaction rate to a specific threshold value for the substrate concentration (not clearly defined in the literature). After reaching this threshold, a reduction in hydrolysis rate due to the increase in non-competitive inhibitor concentration (NH+4) was reported. However, further studies are still required to thoroughly define this threshold based on the substrate (urea concentration), urea: CaCl2, and urease enzyme activity and source.
4. pH Level
The entire process of calcium carbonate precipitation during hydrolysis is highly dependent on the overall pH level of the whole environment. A sufficiently large increase in the environment pH (alkalinity) is necessary to shift the carbonate equilibrium from CO
2 to HCO
3 to CO
32− and then precipitate CaCO
3 in the presence of Ca
2+. This change in the pH level occurs due to the formation of OH
−, which is a by-product of ammonium generation (NH
+4) that raises the pH and provides favourable conditions for calcium carbonate precipitation
[22][23][1,75]. Jacob
[24][76] explained the relationship between carbonate precipitation and pH in water, showing that generating more carbonate CO
32− usually occurs at a high value of pH. Furthermore, maintaining a high pH value (>9.0) helps in increasing calcium carbonate saturation and drives the precipitation reaction towards completion. Speciation of ammonia-ammonium shifts toward ammonium, which increases the pH and decreases the possibility of reversing the reaction, since calcium carbonate dissolves in an acidic environment at a pH lower than 7.0
[23][75]. Moreover, the activity of the urease is also dependent on the system pH. The optimum pH that maintains the urease activity is found to be 6.9
[25][77].


