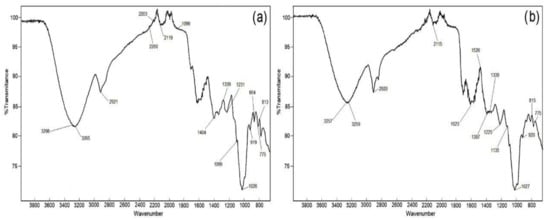
The FTIR spectra for both pulp flour and epicarp flour samples showed main observable differences reflected in the chemical composition around 1800–1600 cm
−1. In
Figure 21, for the FTIR spectra of the tamarillo pulp and epicarp samples, the same typical bands can be observed but with a different magnitude because of the different compositions among the pulp and epicarp. Changes in the composition are reflected in several peaks assigned to different wavelength ranges for the contribution of specific regions: 3350 cm
−1 for O–H stretching modes of water absorbing, −C−H stretching in fatty acids (2900 cm
−1), −C=O stretching of methyl esterified carbonyl (1745 cm
−1), asymmetric stretching of carboxylate anion −COO- (1630 cm
−1), symmetric stretching of carboxylate anion (1432 cm
−1), and C=O and C−C stretching of acids (1010 cm
−1), respectively
[32][22]. The noticeable changes between 1300 and 800 cm
−1 correspond to the typical fingerprint region similar to citrus pectin
[7][19], since the presence of high methoxyl pectin in tamarillo pulp and low methoxyl in mucilage has been reported
[33][23]. The results showed a similarity with the characteristic peaks of inulin of 3270–2929 cm
−1 and 1025–985 cm
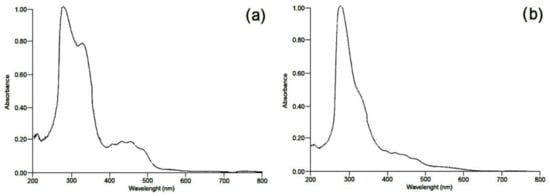
−1 [34][24]. In the UV spectroscopy, the presence of carbohydrates was identified in tamarillo samples for both the pulp and epicarp, with absorption bands at 212 and 275 nm (values of 0.089 and 0.375 abs) for pulp and absorption bands at 210 and 328 nm (values of 0.145 and 0.803 abs) for epicarp (
Figure 32). The results of UV showed that the peaks obtained are associated with the presence of monosaccharides as reported by Kaijanen et al.
[35][25], where the maximum absorption peaks for xylose are from 245 to 255 nm and the UV spectrum for glucose, and the absorbance is close to a maximum of 270 nm and significantly low at 270 nm. Nonetheless, in tamarillo pulp, the presence of common monosaccharides from different polysaccharides is similarly fractionated depending on the extraction method, since in the water extraction procedure, mannose- and xylose-containing polysaccharides, major constituents of hemicelluloses, presented lower extractability
[32][22]. Despite the extraction method, the UV analysis confirmed the presence of fermentable sugars, such as mono-, oligo-, and polysaccharides, in tamarillo pulp. There was an observable difference in pulp flour, which had more peaks, since pulp is the sweeter part of the fruit, than in epicarp flour, although other important components in epicarp, such as pigments, are present. Novel delphinidin 3-O-a-L-rhamnopyranosyl-(1→6)-β-Dglucopyranoside-3′-O-β-D-glucopyranoside as a minor constituent has been reported
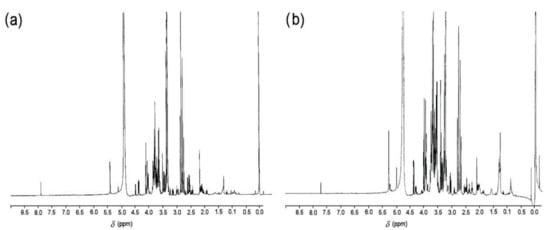
[36][26], and hence, tamarillo, as a tropical fruit, could be considered to be a good source of natural pigments with potential antioxidant activity. In the 1H RMN spectroscopy, the FDPF and FDEF samples showed signals between 3 and 4 ppm, which correspond to the various carbons of fructose (sugars), and signals at 5.0 ppm that correspond to an anomeric H, characteristic of sugars (
Figure 43). The NMR spectra show the presence of fructose units and glucose units, as well as anomeric carbon at 5.44 ppm, corresponding to the α1-β1 proton of the D-glucopyranosyl unit, which is located at the beginning of the inulin chain
[37][27]. do Nascimento
[38,39][28][29] reported the presence of a galactose arabinose glucuronoxylan in the pulp of
C. betacea, composed of major monosaccharides of glucose, arabinose, galactose, xylose, and uronic acids, showing an antinociceptive effect in inflammatory pain models. These results are associated with dietary fiber as the presence of pectins, being the main components of the soluble fraction of fiber in the pulp. Kou
[40][30] showed that the phenolic compounds in
C. betacea have high antioxidant potential and demonstrated inhibition of LDL oxidation in vitro and ROS production in PC12 cells.
Figure 21. FTIR spectra of (a) tamarillo pulp flour and (b) tamarillo epicarp flour.
Figure 32. UV spectra of (a) tamarillo pulp flour and (b) tamarillo epicarp flour.
Figure 43. 1H RMN spectra of (a) tamarillo pulp flour and (b) tamarillo epicarp flour.
4. Prebiotic Activity
In general, tamarillo pulp flour presented a higher prebiotic activity than tamarillo epicarp flour.
L. plantarum showed significantly (
p < 0.01) higher prebiotic activity for both pulp and epicarp flours as carbon sources, obtaining values of 1.49 and 1.30, respectively. Pulp flour presented positive values with all the lactic acid bacteria (
Table 2). The prebiotic activity depends on the probiotic lactic acid bacteria’s performance in the presence of a pathogenic strain, in order to be the dominant flora. In this study, under the employed experimental conditions,
L. plantarum presented higher scores of 8 above 1), but in general, the employed strains presented a higher prebiotic activity score for tamarillo pulp flour than tamarillo epicarp flour. Although Diaz-Vela et al.
[41][31] reported positive prebiotic activity values for
L. rhamnosus GG with pineapple peel flour and cactus pear flour (0.19 and 0.21, respectively), it seems that tamarillo epicarp or peel presented lower fermentable carbohydrates than pulp. Nonetheless, it has been reported that tamarillo hydrocolloids are resistant to digestive enzymes and gastrointestinal conditions, indicating that they are available for fermentation by gut microbiota, producing short-chain fatty acids as well
[33][23]. Pectic polysaccharides, as found in tamarillo pulp and epicarp, possess important biological activity
[42][32]. In this view, tamarillo consumption, as a source of bioactive molecules with important physiological properties and as an antioxidant and putative prebiotic, is a good alternative for functional foods, since foods formulated with this fruit will present health benefits, as has been already reported, such as hyperlipidemia
[43][33] or metabolic syndrome
[30][18].
Table 2. Prebiotic activity index for both tamarillo pulp and epicarp flour with different lactic acid bacteria. Prebiotic activity index for both tamarillo pulp and epicarp flour with different lactic acid bacteria.
| Substrate/Flour |
L. casei |
L. plantarum |
L. paracasei |
p |
| DPFC |
0.08 ± 0.00 c |
1.49 ± 0.01 a |
0.33 ± 0.01 b |
0.0001 |
| DEFC |
−0.35 ± 0.02 b |
1.30 ± 0.01 a |
−0.02 ± 0.01 c |
0.0001 |
| P |
0.0001 |
0.5482 |
0.0002 |
|