Your browser does not fully support modern features. Please upgrade for a smoother experience.
Please note this is a comparison between Version 1 by Shan-hui Hsu and Version 2 by Camila Xu.
Highly expressible bacteriorhodopsin (HEBR) is a light-triggered protein (optogenetic protein) that have seven transmembrane regions with retinal bound as their chromophore to sense light. HEBR has controllable photochemical properties and regulates activity on the proton pumping. Our study indicates that the HEBR protein may inhibit cell proliferation and cell cycle progression of lung cancer cells, reduce their migration activity, and suppress some stem-ness-related genes. These findings also suggest the potential of HEBR protein to regulate the growth and migration of tumor cells, which may offer the possibility for an anticancer drug.
- optogenetic protein
- non-small cell lung cancer
- cytotoxicity
1. Introduction
The Halophilic archaea (haloarchaea) are grown in aerobic heterotrophs that dominate hypersaline environments. Hypersaline conditions, such as salt lakes, salt ponds, and solar saltern facilities, are usually exposed to strong sunlight, which leads to the higher salinity than that of sea water [1][2][1,2]. To protect the damage from light energy and high salinity, the haloarchaea generate a proton gradient system through the photo-reactive rhodopsin proteins [3]. The first discovered microbial rhodopsins (M-Rho) are typically seven-pass transmembrane helix region bound with retinal to absorb light energy for ion translocation or phototaxis response [4][5][4,5]. The photochemical properties of ion-translocating rhodopsins fall into several categories, such as the light-driven outward proton transport bacteriorhodopsin (BR) [4][6][4,6], the light-driven inward chloride transport halorhodopsin (HR) [7][8][7,8], outward sodium transport (KR2) [9], and the nonselective cation channel channelrhodopsin II (ChR2) [10][11][10,11].
Bacterial rhodopsin (BR), a highly stable light-driven proton pump, can excrete proton out of the cell through light perception and regulate the ion balance of the cell [12][13][12,13]. In the early stage, BR protein was mostly produced from the slow-growing extreme halophilic microorganisms and few from genetically recombinant Escherichia coli (E. coli). However, the low availability and high cost of BR protein limited its potential of bioengineering applications and commercialization. In a previous study, the high-yield, functional, and thermally stable BR recombinant protein was successfully produced [14]. This photosensitive membrane protein, named highly expressible bacteriorhodopsin (HEBR), was generated in E. coli using a mutated bacteriorhodopsin (BR) from Haloarcula marismortui (HmBRI/D94N) [15], and its structure and biochemical effects were thoroughly evaluated [14][15][14,15]. This particular HEBR responded to light with an absorption wavelength at 532 nm (green light) by photocycle measurement and its capability of pumping proton anions outward under light exposure [16]. According to our earlier study, the engineered light-sensitive BR proteins can serve as a trigger to influence the mammalian neural stem cells (NSCs) under light exposure [16]. Besides, another type of optogenetic protein, HR, can hyperpolarize or inhibit action potentials during the period of after hyperpolarization in neuron cells [17]. The light-activated proteins are frequently used to investigate the regulation of neural activity in mammalian cells. However, there are only a few studies on the effect of light-sensitive BR proteins on cancer cell behavior under light exposure.
Epithelial to mesenchymal transition (EMT) is an essential process during embryogenesis and organ development in which cells transit from epithelial cells to those with the mesenchymal cells features [18][19][18,19]. EMT also plays a vital role in wound healing, tissue repair, organ fibrosis, cancer progression, and metastases. The EMT process has been shown to lead to loss of intercellular junctions, disrupt the epithelial polarity, and increase cell motility [20][21][20,21]. During the process, the increased expression of mesenchymal cell markers (e.g., vimentin, N-cadherin (N-cad), fibronectin) and the repression of epithelial cell markers (e.g., E-cadherin (E-cad), claudins, occludins) have been observed [22][23][22,23]. The EMT is also regulated by EMT-associated transcription factors such as Snail, Twist, and Zinc Finger E-box Binding (EZB) family [24]. The downregulation of E-cadherin is controlled by the transcriptional level by Snail protein [25]. Meanwhile, EMT confers metastatic and cancer stem cell properties, such as Sox-2, Oct-4, and CD133 to cancer cells and is always correlated with poor clinical outcomes for cancer patients with malignant transformation stage [26][27][26,27]. Thus, anti-EMT resistance drugs or multidrug therapies could be considered the prevention strategies for invasion and dissemination of tumor cells, to prevent the malignant cell migration, repress the cancer stemness, and gain the effectiveness of more classical chemotherapeutics.
Lung cancers are one of the most common carcinomas, which contain two main types, namely, small-cell lung cancer (SCLC) and non-small-cell lung cancer (NSCLC) [28]. Despite the advances of therapeutic treatment for tumor cells, the aggressiveness and metastatic potential of NSCLC remain a challenging topic to be overcome [29][30][29,30]. Emerging evidence suggests that the voltage-gated control is a check point of the cell cycle in cell proliferation [31].
2. HEBR Protein Suppresses the Cell Proliferation of A549 and H1299 Cells
Before light exposure to the HEBR-treated cells, we utilized immunofluorescent staining to confirm if the HEBR proteins could be delivered into A549 and H1299 cells, after incubation for 24 h with the culture medium containing 20 μg/mL of HEBR proteins. The data showed that HEBR proteins were obviously distributed on the cell membrane and in the cytoplasm of the stained cells, indicated by red arrows in the magnified images (Figure 1A). These data indicated that the effect of light stimulation on HEBR-treated cells should be evaluated after 24 h of incubation to ensure that the HEBR protein had entered cells. After light stimulation, the proliferation of the HEBR-treated cells was determined by CCK-8 assay (Figure 1B). The data showed that the proliferation of A549 and H1299 cells decreased in a dose-dependent manner after treatment of HEBR protein with or without green-light illumination. As shown in Figure 1B, the viability of A549 cells could be reduced below ~50% at the concentration of 40 μg/mL without the green-light exposure, while the proliferation of H1299 cells remained above 50% under the same condition. At the same time, a significantly decreased proliferation of H1299 cells was observed at the HEBR concentration of 80 μg/mL. For HEBR-treated cells with green-light illumination, the curve of A549 cells after treatment with HEBR protein was slightly different from those without light exposure. The results revealed no significantly differences between the green-light-illuminated or non-illuminated groups on either A549 or H1299 cells after the treatment of HEBR protein.
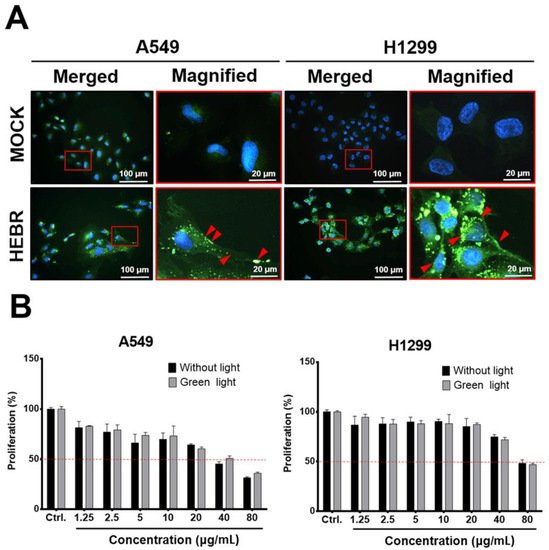
Figure 1. The effect of HEBR on the cell proliferation of A549 and H1299. (A) The distribution of HEBR protein expression on cell membranes and in the cytoplasm. Immunofluorescent staining HEBR was incubated with the HEBR proteins (20 μg/mL) on A549 or H1299 cells for 24 h. Immunofluorescence imaging of HEBR-his tag (green) counterstained with nucleic Hoechst (blue), and then merged. The magnified image of the selected region is shown in the red box. The HEBR proteins on cell membranes are demonstrated by red arrows. (B) The cell proliferation rate of A549 and H1299 after treatment with HEBR protein for 48 h evaluated by CCK-8 assay. The data are expressed as the relative proliferation of cells. The black bar represents the treatment of HEBR protein without green-light illumination, while the gray bar represents the treatment of HEBR with green-light illumination. The proliferation percentage at different HEBR concentrations was evaluated by GraphPad Prism 5 software.
3. Cell Cycle Arrest in HEBR-Protein-Treated A549 Cells
To reveal the anti-proliferative mechanism of the HEBR protein, we assessed the effect of HEBR treatment on the cell cycle progression. Since the HEBR proteins had more growth-inhibitory effect on A549 cells than on H1299 cells. The A549 cells were selected for further investigation. A two-step cell cycle assay was carried out to quantify the distribution of DNA contents in different cell cycle stages under the concentration of 20 μg/mL HEBR in combination with (or without) green-light illumination on A549 (Figure 2A). Data showed the cell cycle G0/G1 phase arrest induced by the treatment of HEBR on A549 cells (Figure 2B). Meanwhile, no apparent differences between the green-light-illuminated or non-illuminated groups were observed in different cell cycle stages on either HEBR-treated or non-treated cells. The HEBR protein was found to promote high DNA contents at G0/G1 phase of the cell cycle with or without green-light exposure, indicating that A549 cells treated with HEBR protein induced cell cycle arrest at G0/G1 phase. These data suggested that HEBR protein could have growth-inhibitory effects on lung cancer cells without green-light exposure.
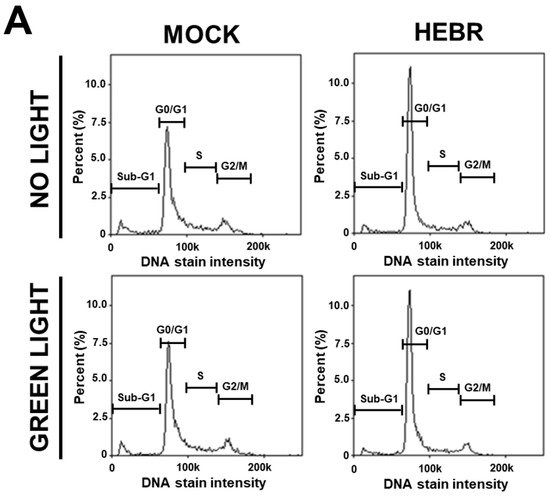
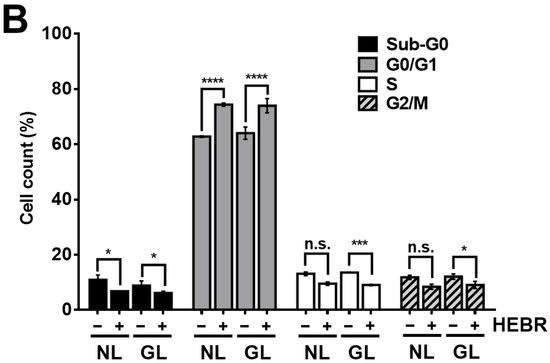
Figure 2. The induction of G0/G1 cell cycle arrest by HEBR. (A) The two-step cell cycle assay was used to detect the cell cycle distribution in A549. Cells were treated with HEBR protein (20 μg/mL) for 24 h with and without green-light illumination. Cells in different cell cycle stages were demarcated by the markers. (B) The markers of different cell cycle stages were transformed into histograms by GraphPad Prism 5 software. NL, no light illumination; GL, with green-light illumination. Asterisks indicate statistically significant differences, * p ≤ 0.05, *** p ≤ 0.001, **** p ≤ 0.0001.
4. Scratch Assay on HEBR-Treated Cells
Migration assay is usually used in discovery of antitumor agents, as the agents that inhibit cell migration ability are potential anti-metastatic drugs. In this study, the scratch test was utilized to measure the migration ability of A549 and H1299 cells after treatment of HEBR protein (20 μg/mL or 40 μg/mL) without green-light illumination (Figure 3A) for a period of 6 h. The cellular migration of each HEBR-treated cells was quantified as a percentage and represented by bar diagrams at 0 h, 1 h, 2 h, and 4 h (Figure 3B). The HEBR protein did not reduce the migration ability of A549 cells within 6 h. The A549 cells treated with 40 μg/mL HEBR protein showed slightly decreased cell migration compared to A549 cells treated with 20 μg/mL HEBR protein within the 4 h of observation. HEBR protein at 20 μg/mL demonstrated a low inhibitory effect on the cell migration ability of H1299 and A549. Notably, the migration rate of H1299 cells was reduced to about 20% after HEBR treatment of 40 μg/mL for 4 h compare to un-treated cells (Figure 3B). The data showed that high concentrations of HEBR protein significantly inhibited the migration of H1299 cells rather than that of A549 cells, and the effect was clearly observed after 4 h of incubation time.
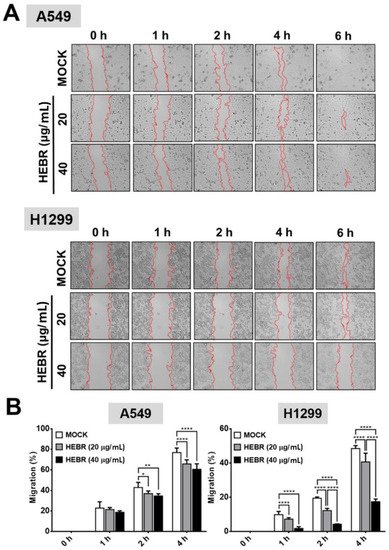
Figure 3. Inhibition of cell migration by HEBR for A549 and H1299 cells. To determine the effect of HEBR treatment on cell migration, a confluent monolayer of A549 and H1299 cells was scratched and then treated with HEBR (20 μg/mL or 40 μg/mL). After 6 h, the scratched area was observed, demonstrating subsided migration ability upon the treatment of HEBR. (A) The migration rate of A549 and H1299 treated with HEBR protein were recorded at 0 h, 1 h, 2 h, 4 h, and 6 h. (B) The area of migrated cells to the wound sides was evaluated. The percentage of cellular migration was calculated using the following formula: [(Area 0 h − Area determine h)/Area 0 h] × 100. The percentage of migration ability was calculated by GraphPad Prism 5 software. Data are presented as means ± SD. (n = 5); asterisks indicate statistically significant differences, * p ≤ 0.05, ** p ≤ 0.01, **** p ≤ 0.0001.
5. Transwell Assay of HEBR Protein on A549 and H1299 Cells
Since HEBR protein of 40 μg/mL showed a strong inhibitory effect on the migration of H1299 cells in the scratch assay, we further utilized a transwell migration assay to confirm the inhibitory effects on the cell migration of A549 and H1299 after treatment with HEBR (40 μg/mL) for 24 h (Figure 4). The results revealed that HEBR protein reduced the number of each type of lung cancer cells to pass through the transwell membrane compared to the non-treated cells (Figure 4A). It was evident that after HEBR protein treatment, H1299 cells had a lower number of migrated cells than A549 cells (Figure 4B). The transwell assay again proved that the dose of 40 μg/mL HEBR had a significantly inhibitory effect on the migration of H1299 cells.
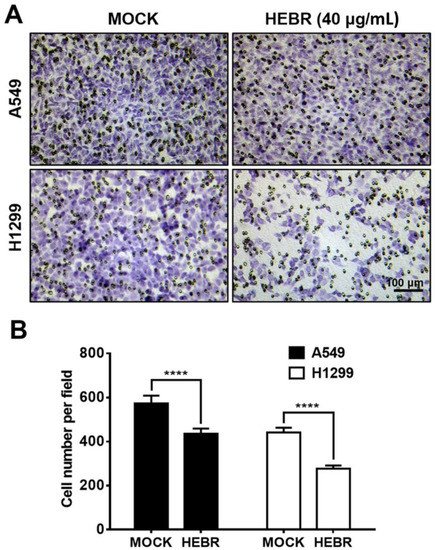
Figure 4. Inhibition of cell invasion by HEBR protein. (A) Transwell assay for the ability of A549 and H1299 invasion was conducted after treatment with HEBR (40 μg/mL) for 24 h. The number of A549 and H1299 cells invading through the transwell membrane significantly decreased upon the HEBR treatment. (B) The cell invasion ability was evaluated by counting cells per field using GraphPad Prism 5 software. Data are presented as means ± SD (n = 3~4). Asterisks indicate statistically significant differences, **** p ≤ 0.0001.
6. Gene Expression of A549 and H1299 Cells after Treatment with HEBR Protein
The mRNA expression levels of EMT genes (Snail-1, Twist-1, E-cad, and N-cad) and stemness genes (Sox-2, Oct-4, and CD133) for the illuminated or non-illuminated groups of HEBR-treated cells were quantified by qRT-PCR, and the results are shown in Figure 5. The gene expression level of Snail-1 for HEBR-protein-treated A549 cells was decreased either with or without green-light illumination (Figure 5). In contrast, the Twist-1 expression in A549 cells after treatment of HEBR protein was upregulated when compared with non-treated A549 cells. Meanwhile, HEBR protein did not significantly influence the expression levels of E-cad and N-cad for A549 cells under different conditions of light exposure.
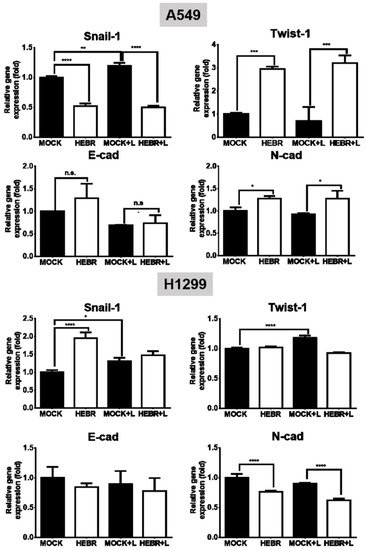
Figure 5. Gene expression of EMT HEBR treatment in A549 and H1299 cells. The cells were treated with HEBR proteins for 72 h with and without green-light illumination. The gene expression levels of markers for EMT, including Snail-1, Twist-1, E-cad, and N-cad, were analyzed for A549 or H1299 cells by qRT-PCR and calculated by GraphPad Prism 5 software. The expression of each marker was normalized to that of GAPDH in each group and then presented as the relative expression level to the mock group. L: treated with green-light illumination. Asterisks indicate statistically significant differences, * p ≤ 0.05, ** p ≤ 0.01, *** p ≤ 0.001, **** p ≤ 0.0001.
The expression of stemness-related genes in A549 and H1299 cells after treatment with HEBR protein with or without green-light exposure is displayed in Figure 6. The expression levels of Oct-4 did not display obvious difference between HEBR-treated and non-treated A549 cells. In addition, A549 cells in the non-treated groups expressed more Sox-2 gene than those in HEBR-treated groups. However, the expression level of CD133 in A549 cells was significantly increased in the HEBR-treated groups than that in the non-treated groups. The results showed that the HEBR protein significantly upregulated the expression of both Sox-2 and Oct-4 genes in H1299 cells, while increased the expression of CD133 (Figure 6). The expression of these stemness-related genes had no dramatic difference between green-light-illuminated groups and non-illuminated groups for both A549 and H1299 cells. These findings were consistent with the results of cell viability.
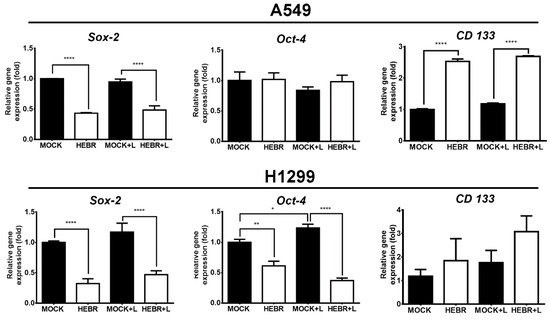
Figure 6. Gene expression of stemness after HEBR treatment in A549 and H1299 cells. The cells were treated with HEBR proteins for 72 h with and without green-light illumination. The gene expression levels of stemness markers included Sox-2, Oct-4, and CD133, for A549 and H1299, respectively. The expression of each marker was normalized to that of GAPDH in each group and then presented as the relative expression level to the mock group and analyzed by GraphPad Prism 5 software. L: treated with green-light illumination. Asterisks indicate statistically significant differences, * p ≤ 0.05, ** p ≤ 0.01, **** p ≤ 0.0001.