Your browser does not fully support modern features. Please upgrade for a smoother experience.
Please note this is a comparison between Version 1 by Nardin Samuel and Version 2 by Lindsay Dong.
The term connectomics broadly refers to the study of networks of structurally and functionally connected regions within the central nervous system. The interaction between glial tumors and structural and functional neuronal networks is becoming increasingly recognized and is reshaping our understanding of the impact of these infiltrative lesions on global brain function.
- glioma
- connectivity
1. Connectomic Methodologies and Applications
The term connectomics broadly refers to the study of networks of structurally and functionally connected regions within the central nervous system. Connectivity can be measured and inferred using both neuroimaging and neurophysiological methods such as diffusion tensor imaging (DTI), functional MRI (fMRI), electroencephalography (EEG), magnetoencephalography (MEG), electrocorticography (ECoG), and awake brain mapping [1][15]. Such studies have yielded novel insights into brain regions traditionally regarded as ‘non-eloquent’ that may actually be essential for brain function, including anatomical regions involved in mentalizing, semantic processing, and language expression [2][4]. In addition, individual connectomic analyses have expanded our understanding of anatomical–functional correlation, including the identification of motor speech areas outside of the traditional topographic location of Broca’s area, characterization of the medial frontal cognitive control networks, and establishment of the second ventral stream of language processing [3][16]. Structural connectivity is typically based on tractography (e.g., DTI) and provides an estimation of axonal fiber or tract connections between topographic brain regions [1][4][15,17]. Functional connectivity can be assessed using various aforementioned modalities, including fMRI, EEG, and MEG. While structural connectomes provide organic pathways for neuronal activity, functional connectomes may inform indirect connections, multiple inputs, or synaptic changes [5][18]. Therefore, both structural and functional connectomics are informative and complementary approaches to better resolve our understanding of brain connectivity. Although discordance between modalities may be observed, it is important to consider that each method is governed by specific principles and should not be interpreted as the failure of an individual method [1][15]. Information gathered from awake neuro-oncological, epilepsy, and DBS surgeries is used to reinforce radiological and neurophysiological models of brain networks. Network analysis can be used to better understand the structural and functional connections linking distinct brain areas in general, and in the context of an intra-axial lesion in particular.
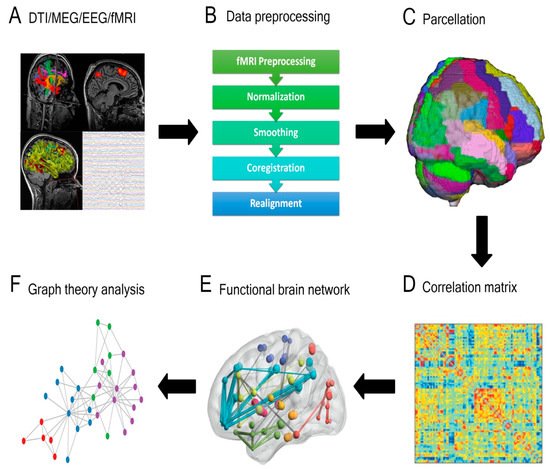
Assembling a connectome using any of the aforementioned approaches utilizes an approximately similar pipeline (Figure 1). The brain is first split into distinct regions through a process known as parcellation. In the case of functional connectomic methodologies, such as fMRI, a blood-oxygen-level-dependent (BOLD) time series is extracted from each parcel and compared with the temporal data from the remaining parcels [1][15]. In contrast, generating a structural connectome involves applying each parcel as a seed within the tractography iteration and the number of fibers subsequently informs putative connections between regions [1][15]. Through either approach, connectivity between distinct brain areas is quantified, often illustrated as a connectivity matrix. This can then be further processed using techniques such as graph theory, whereby specific regions (nodes or hubs) and the links between these regions (edges) are studied [6][7][19,20].

Figure 1. General overview of a connectivity analysis pipeline. (A) Structural or functional data are acquired and (B) pre-processed, then (C) parcellated by dividing the brain into distinct regions. A (D) correlation matrix is then created to estimate the connectedness between regions and (E) functional brain networks are generated. (F) Graph theory analysis is applied to delineate nodes, edges, and central hubs. (DTI = diffusion tensor imaging; MEG = magnetoencephalography; EEG = electroencephalography; Fmri = functional magnetic resonance imaging).
2. Integrating Connectomic Analysis into the Glioma Peri-Operative Pipeline
Connectivity studies have been successfully applied to various indications within functional neurosurgery. For example, the field of DBS is increasingly conceptualizing DBS as a tool to modulate brain networks [8][9][21,22]. DBS offers a window of insight into brain function associated with cognition and emotions, as do awake tumor resections with brain mapping. Viewing DBS as a modality to interrogate dysfunctional neural circuits, or ‘circuitopathies’, has led to broader applications of DBS [10][23]. In particular, DBS is successfully being used to target mood and cognitive circuits for psychiatric and Alzheimer’s disease, respectively [10][23]. Similarly, pre-operative connectomic studies using DTI, fMRI, and resting-state MEG have shown clinical utility in characterizing patients who have a higher likelihood of responding to vagus nerve stimulation (VNS) for intractable epilepsy and in DBS parameter selection for Parkinson’s disease (PD) [11][12][24,25]. Moreover, the efficacy of subthalamic nucleus (STN) DBS for PD has been associated with a distinct structural and functional connectivity profile [13][26]. The efficacy of DBS and VNS is, in part, due to the modulation of remote brain regions that communicate with the site of stimulation and reorganization of neural networks [14][15][16][27,28,29].
Recognizing these remote effects of DBS, one can also conceptualize that connectomic analysis may provide insight into the underlying basis of adverse effects or undesirable symptoms occurring secondary to DBS. Such an approach has been used to map the underlying connectivity of DBS-associated flashback phenomena following forniceal DBS, panic attacks induced by inferior thalamic peduncle DBS, and seizures following subcallosal cingulate DBS for refractory anorexia nervosa [17][18][19][30,31,32]. Similarly, connectivity-derived models can guide effective DBS for less well-understood pathologies, such as central post-stroke pain and neuropsychiatric indications, including obsessive-compulsive disorder [20][21][8,33]. Similar analyses were undertaken to investigate the perturbed networks leading to post-operative morbidity in glioma surgery. One study employed lesion-network mapping (LNM) to examine the connectomic basis for post-operative depression in a patient with a cingulate diffuse low-grade glioma [22][34]. This analysis drew upon principles of connectomic analysis and functional neurosurgery to characterize the neuroanatomical basis of this post-operative morbidity. Specifically, networks associated with subgenual cingulate DBS were compared to networks affected both by the tumor and surgical approach. The analysis showed that the surgical corridor had greater overlap with DBS-based depression networks [22][34].
Collectively, there is an emerging body of literature supporting the feasibility and clinical utility of brain mapping in individual patients, and this can broadly be translated to glioma patients. Although integrating these studies into a pre-surgical planning scheme may present challenges in implementation and application, such analyses hold the potential to identify brain regions that are essential to network function, which may otherwise be at risk from tumor resection [7][20].
34. Practical Applications of Connectivity for Glioma Surgery
3.1. Conceptualizing Glioma Resection in Terms of Oncologic Disconnection
4.1. Conceptualizing Glioma Resection in Terms of Oncologic Disconnection
The primary goals of integrating connectivity into surgical planning include (1) sparing of functional networks leading to anticipated decreases in post-operative morbidity and (2) so-called ‘oncologic’ disconnection. The latter can broadly refer to disconnection of pathways of tumor spread but may also refer to resection of seizure onset zone and disconnection of epileptogenic networks. Proving the possibility of using pre-operative connectivity studies for the sparing of functional networks, one study of glioblastoma patients demonstrated that ‘connectomic signatures’ derived from fMRI connectomes could identify regions critical to network function [7][20]. However, intra-operative direct cortical and subcortical stimulation remains the gold standard for mapping.
3.2. Preservation of Cognitive Eloquence, Higher-Order Behavioral and Social Functions
4.2. Preservation of Cognitive Eloquence, Higher-Order Behavioral and Social Functions
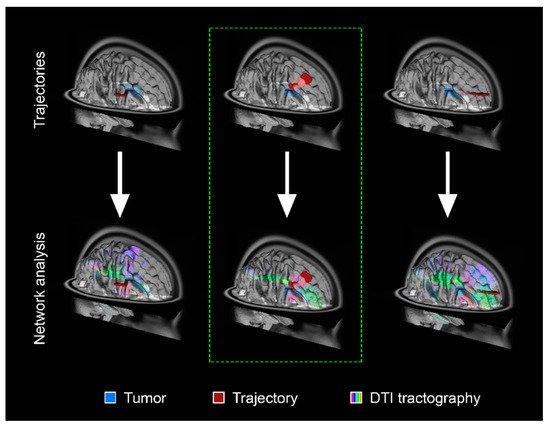
A global perspective that considers the impact of tumors on neural circuitry can endeavor to preserve critical networks to maintain cognitive, social, and occupational function post-operatively [23][6]. Therefore, such strategies must be coupled with formal neuropsychiatric assessments in both the pre-operative and post-operative phases. The concept of cognitive eloquence in neurosurgery has been proposed whereby cortical and subcortical regions of the brain, which are not known to have a definite neurological function, may result in cognitive morbidity when traversed surgically [24][35]. Functional MRI and/or DTI acquired pre-operatively could be leveraged to capture the patient-specific connectome and delineate specific cognitive or affective networks [25][36]. Such an approach can therefore allow the surgeon to plan a minimally disruptive trajectory (Figure 2).


Figure 2. Schematic of pre-operative structural connectivity to identify optimal trajectories for tumor resection and minimal network disruption. The top panels demonstrate a representative schematic of an intra-axial tumor (blue) and possible surgical trajectories (red). The bottom panels show the corresponding network analysis based on DTI tractography. The trajectory demarcated by the dashed green line represents the surgical trajectory with minimal structural network disruption. A similar approach can be applied to visual representations of functional networks derived from other modalities to infer connectivity.
This is clinically relevant as earlier detection of gliomas had led to the increasing recognition of preserving quality of life for these patients [26][37]. Potential regions of cognitive eloquence are thought to coincide with areas central in interconnected brain networks [24][27][35,38]. Evidence for the existence of these so-called brain ‘hubs’ is derived from several studies, including network analysis of DTI data as well as resting-state MRI [28][29][39,40]. Commonly identified hubs, or areas of centrality, include the dorsal superior prefrontal cortex, non-dominant medial superior frontal gyrus, anterior insula, temporal–occipital cortex, precuneus, and the superior and medial occipital gyri [27][38]. In addition to defining potential regions of functional and cognitive eloquence, it is important to have an understanding of neuroplasticity in glioma surgery since functional networks can undergo marked reorganization in the face of an infiltrative or compressive mass lesion [30][41]. Functionally, these may result in a shift of ‘hubs’ from their location in the normal brain due to neuroplastic changes imposed by the presence of an infiltrative mass lesion.
