The presence of stress and anxiety during simulation-based learning may affect the performance outcomes. This study takes advantage of infrared thermal imaging to study the relationship between differences in facial skin temperature and the perception of anxiety throughout a cardiac arrest simulated scenario. The analysis of facial temperature variations showed good correlations with either the anxiety scale or standard quality resuscitation parameters, showing consistent thermographic profiles for the forehead, maxillary and periorbital areas.
- facial temperature
- stress
- anxiety
1. Background
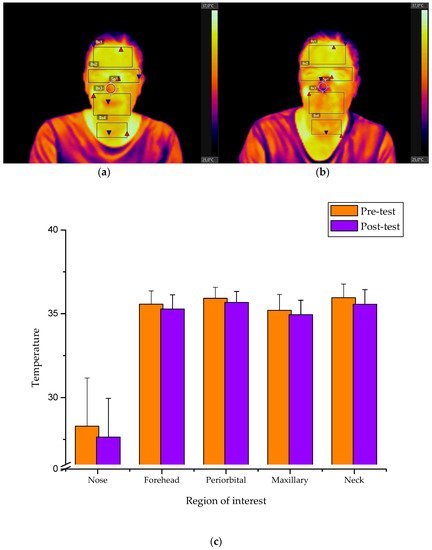
The extent of anxiety and psychological stress can impact upon the optimal performance of simulation-based practices. The current entry describes that the association between differences in skin temperature and perceived anxiety by under- (n = 21) and post-graduate (n = 19) nursing students undertaking a cardiopulmonary resuscitation (CPR) training. Thermal facial gradients from selected facial regions were correlated with the scores assessed by the State-Trait Anxiety Inventory (STAI) and the chest compression quality parameters measured using mannequin-integrated accelerometer sensors. A specific temperature profile was obtained depending on thermal facial variations before and after the simulation event. Statistically significant correlations were found between STAI scale scores and the temperature facial recordings in the forehead (r = 0.579; p < 0.000), periorbital (r = 0.394; p < 0.006), maxillary (r = 0.328; p < 0.019) and neck areas (r = 0.284; p < 0.038). Significant associations were also observed by correlating CPR performance parameters with the facial temperature values in the forehead (r = 0.447; p < 0.002), periorbital (r = 0.446; p < 0.002) and maxillary areas (r = 0.422; p < 0.003). These preliminary findings suggest that higher anxiety levels result in poorer clinical performance and can be correlated to temperature variations in certain facial regions.
2. RCurresultsnt Insight into Effect of Facial Skin Temperature on the Perception of Anxiety
| Sociodemographic Characteristics | Undergraduate Bachelor Students (BS) |
Postgraduate Master Students (MS) |
Statistic Values χ | 2 | /t | p | Value | ||
|---|---|---|---|---|---|---|---|---|---|
| Facial Region | Temperature Value | Moment | Temperature Mean (SD) | Undergraduate Bachelor Students (BS) | Temperature Mean (SD) | Postgraduate Master Students (MS) | t | p | Value Groups |
||||||||
|---|---|---|---|---|---|---|---|---|---|---|---|---|---|---|---|---|---|
| N | = 21 mean ± SD (%) | N | = 19 mean ± SD (%) | ||||||||||||||
| t-Paired | Significance | t-Paired | Significance | ||||||||||||||
| Sex | Female | 18 (85.7) | 16 (84.2) | ||||||||||||||
| Nose | Average | 0.018 | Pre-test | b | 27.87 (2.56) | 0.894 | b | ||||||||||
| −1.014 | 0.323 | 28.76 (3.20) | 4.095 | 0.001 ** | −0.972 | 0.337 | Male | 3 (14.3) | 3 (15.8) | ||||||||
| Post-test | 28.17 (2.31) | 27.06 (2.21) | −0.961 | 0.129 | Age | 21.0 (4) | 23.85 (1.61) | −2.890 | a | 0.006 * | ,a | ||||||
| Difference | 0.30 (1.36) | - | −1.70 (1.81) | - | 1.553 | 0.000 * | Educational level | Baccalaureate | 17 (81) | 0 | 0.000 * | ,b | |||||
| Forehead | Maximum | Pre-test | 35.79 (0.76) | 0.982 | 0.338 | Professional training | 3 (14.3) | 0 | 36.190 | b | |||||||
| Post-test | 35.59 (0.89) | - | 34.95 (0.66) | 3.980 | 0.014 * | Other Bachelor of Science | 1 (4.8) | 19 (100) | |||||||||
| Practicum in special health services | |||||||||||||||||
| Difference | −0.20 (0.91) | - | −0.39 (0.72) | - | 3.923 | 0.462 | Yes | 0 | 19 (100) | 0.000 * | ,b | ||||||
| No | 21 (100) | 0 | 1.84 (0.83) | −9.625 | a | 0.000 | a | ||||||||||
| 35.79 (0.76) | 2.362 | 0.030 * | 1.557 | 0.072 | |||||||||||||
| Average | Pre-test | 34.90 (0.77) | 1.291 | 0.211 | 34.13 (1.34) | 2.939 | 0.009 ** | 1.851 | 0.031 * | 0 | 40.0 | b | |||||
| Number of special health services in practicum | Work in special health services | Yes | 0 | ||||||||||||||
| Post-test | 34.60 (1.10) | 33.52 (1.26) | 1.849 | 0.006 * | |||||||||||||
| Difference | −0.30 (−0.30) | −0.61 (0.91) | 2.578 | 0.317 | 10 (52.6) | 14.737 | b | 0.000 * | ,b | ||||||||
| Minimum | Pre-test | 32.62 (1.64) | −0.432 | 0.671 | 30.40 (2.75) | 0.789 | 0.440 | 2.617 | 0.005 * | No | 21 (100) | 9 (47.4) | |||||
| Post-test | 32.77 (1.03) | 30.09 (2.54) | 0.743 | 0.000 * | Number of special health services working | 0 | 0 | 0.84 (1.05) | −3.618 | a | 0.002 * | ||||||
| Difference | ,a | ||||||||||||||||
| 0.15 (1.57) | −0.31 (1.72) | 0.752 | 0.383 | Training on basic CPR (basic life support) | Yes | Last two years | 1 (4.8) | 6 (31.6) | 6.686 | b | 0.010 * | ,b | |||||
| Periorbital | Maximum | Pre-test | 35.91 (0.63) | 1.142 | 0.267 | 35.93 (0.70) | 2.560 | 0.020 * | 2.247 | 0.935 | More than two years | 2 (9.5) | |||||
| Post-test | 2 (10.5) | ||||||||||||||||
| 35.67 (0.64) | 35.57 (0.67) | 2.190 | 0.346 | No | 18 (85.7) | 9 (47.4) | |||||||||||
| Difference | −0.15 (0.59) | −0.36 (0.62) | 2.906 | 0.267 | Duration basic CPR training | 37.67 (46.11) | 56.33 (37.67) | 6.750 | b | 0.455 | a | ||||||
| Training on advanced CPR (advanced life support) | Yes | 0 | 4 (21.1) | 4.912 | b | 0.027 * | ,b | ||||||||||
| No | 21 (100) | 15 (78.9) | |||||||||||||||
| Average | ||||||||||||
| Pre-test | ||||||||||||
| 34.01 (0.90) | ||||||||||||
| 0.294 | ||||||||||||
| 0.771 | ||||||||||||
| 33.93 (0.82) | ||||||||||||
| 3.670 | ||||||||||||
| 0.002 ** | ||||||||||||
| 2.886 | 0.764 | |||||||||||
| Post-test | 33.96 (0.85) | 33.35 (0.59) | 1.013 | 0.012 * | ||||||||
| Difference | −0.05 (0.81) | −0.58 (.69) | 1.021 | 0.033 * | ||||||||
| Minimum | Pre-test | 28.84 (2.10) | 0.366 | 0.718 | 29.28 (2.07) | 3.596 | 0.002 ** | 3.137 | 0.509 | |||
| Post-test | 28.73 (1.77) | 28.18 (1.66) | 3.062 | 0.323 | ||||||||
| Difference | −0.11 (1.43) | −1.10 (1.33) | 4.443 | 0.030 * | ||||||||
| Maxillary | Maximum | Pre-test | 35.29 (0.99) | 0.579 | 0.569 | 35.11 (0.94) | 2.109 | 0.049 * | 4.282 | 0.548 | ||
| Post-test | 35.177 (0.90) | 34.70 (0.73) | 0.883 | 0.074 | ||||||||
| Difference | −0.11 (0.90) | −0.41 (0.85) | 0.879 | 0.294 | ||||||||
| Average | Pre-test | 33.27 (1.30) | 1.285 | 0.214 | 33.10 (1.25) | 2.872 | 0.010 * | −0.082 | 0.681 | |||
| Post-test | 32.93 (1.08) | 32.42 (1.12) | −0.082 | 0.153 | ||||||||
| Difference | −0.34 (1.21) | −0.68 (1.03) | 0.953 | 0.345 | ||||||||
| Minimum | Pre-test | 27.59 (2.25) | 0.287 | 0.777 | 28.20 (2.55) | 4.011 | 0.001 ** | 0.951 | 0.424 | |||
| Post-test | 27.46 (1.74) | 26.57 (2.08) | 1.126 | 0.148 | ||||||||
| Difference | −0.12 (1.98) | −1.63 (1.77) | 1.123 | 0.016 * | ||||||||
| Neck/ | Upper chest | Maximum | Pre-test | 36.05 (0.92) | 2.177 | 0.042 * | 35.85 (0.71) | 2.189 | 0.042 * | 0.302 | 0.436 | |
| Post-test | 35.652 (0.99) | 35.47 (0.74) | 0.304 | 0.514 | ||||||||
| Difference | −0.40 (0.84) | −0.38 (0.75) | 2.635 | 0.934 | ||||||||
| Average | Pre-test | 34.50 (0.91) | 1.711 | 0.103 | 34.23 (0.62) | 2.547 | 0.020 * | 2.681 | 0.279 | |||
| Post-test | 34.21 (0.93) | 33.84 (0.62) | 2.210 | 0.158 | ||||||||
| Difference | −0.30 (0.79) | −0.38 (0.66) | 2.228 | 0.703 | ||||||||
| Minimum | Pre-test | 31.21 (1.91) | −0.054 | 0.957 | 30.69 (2.01) | 0.763 | 0.455 | −0.667 | 0.407 | |||
| Post-test | 31.23 (1.65) | 30.17 (1.93) | −0.668 | 0.069 | ||||||||
| Difference | 0.02 (2.01) | −0.51 (2.94) | 1.001 | 0.499 |
| Dependent Variable: STAI Pre-Test | Unstandardized Coefficients | Standardized Coefficients | |
|---|---|---|---|
| B | Standard Error | Beta | |
| Constant | −63.284 | 37.913 | |
| Nose temperature | 0.182 | 0.278 | 0.107 |
| Forehead temperature | 6.555 | 1.826 | 1.056 |
| Periorbital temperature | −2.310 | 2.096 | −0.309 |
| Maxillary temperature | −0.806 | 1.175 | −0.157 |
| Neck/upper chest temperature | −1.117 | 1.098 | −0.187 |
3. Summary
The presence of stress and anxiety during simulation-based learning may affect the performance outcomes. Taking advantage of infrared thermal imaging to study the relationship between differences in facial skin temperature and the perception of anxiety throughout a cardiac arrest simulated scenario. The analysis of facial temperature variations showed good correlations with either the anxiety scale or standard quality resuscitation parameters, showing consistent thermographic profiles for the forehead, maxillary and periorbital areas. Consequently, the utilization of facial temperature values should be taken into consideration to predict the influence of anxiety during simulation training. Despite being a pilot experiment, the results are expected to improve assessment performance prior to a simulation practice by providing valuable information on the anxiety traits of simulation participants. Further research is needed to examine the reliability of infrared imaging technology as a valid screening tool for the objective quantification and diagnosis of emotional and cognitive load in simulation training practices.
References
- Gamble, A.S. Simulation in undergraduate paediatric nursing curriculum: Evaluation of a complex ‘ward for a day’ education program. Nurse Educ. Pract. 2017, 23, 40–47.
- Kim, J.; Park, J.-H.; Shin, S. Effectiveness of simulation-based nursing education depending on fidelity: A meta-analysis. BMC Med. Educ. 2016, 16, 152.
- Cabrera-Mino, C.; Shinnick, M.A.; Moye, S. Task-Evoked Pupillary Responses in Nursing Simulation as an Indicator of Stress and Cognitive Load. Clin. Simul. Nurs. 2019, 31, 21–27.
- Bhanji, F.; Donoghue, A.J.; Wolff, M.S.; Flores, G.E.; Halamek, L.P.; Berman, J.M.; Sinz, E.H.; Cheng, A. Part 14: Education: 2015 American Heart Association Guidelines Update for Cardiopulmonary Resuscitation and Emergency Cardiovascular Care. Circulation 2015, 132, S561–S573.
- Judd, B.K.; Currie, J.; Dodds, K.L.; Fethney, J.; Gordon, C.J. Registered nurses psychophysiological stress and confidence during high-fidelity emergency simulation: Effects on performance. Nurse Educ. Today 2019, 78, 44–49.
- Plemmons, C.; Clark, M.; Feng, D. Comparing student clinical self-efficacy and team process outcomes for a DEU, blended, and traditional clinical setting: A quasi-experimental research study. Nurse Educ. Today 2018, 62, 107–111.
- Davey, P.; Whatman, C.; Dicker, B. Comparison of Chest Compressions Metrics Measured Using the Laerdal Skill Reporter and Q-CPR: A Simulation Study. Simul. Healthc. 2015, 10, 257–262.
- Beltrán-Velasco, A.I.; Ruisoto-Palomera, P.; Bellido-Esteban, A.; García-Mateos, M.; Clemente-Suárez, V.J. Analysis of Psychophysiological Stress Response in Higher Education Students Undergoing Clinical Practice Evaluation. J. Med. Syst. 2019, 43, 68.
- Ayuso-Murillo, D.; Colomer-Sánchez, A.; Santiago-Magdalena, C.R.; Lendínez-Mesa, A.; Gracia, E.B.D.; López-Peláez, A.; Herrera-Peco, I. Effect of Anxiety on Empathy: An Observational Study Among Nurses. Healthcare 2020, 8, 140.
- Brugnera, A.; Zarbo, C.; Adorni, R.; Tasca, G.A.; Rabboni, M.; Bondi, E.; Compare, A.; Sakatani, K. Cortical and cardiovascular responses to acute stressors and their relations with psychological distress. Int. J. Psychophysiol. 2017, 114, 38–46.
- Judd, B.K.; Alison, J.A.; Waters, D.; Gordon, C.J. Comparison of Psychophysiological Stress in Physiotherapy Students Undertaking Simulation and Hospital-Based Clinical Education. Simul. Healthc. 2016, 11, 271–277.
- Mills, B.; Carter, O.; Rudd, C.; Claxton, L.; O’Brien, R. An experimental investigation into the extent social evaluation anxiety impairs performance in simulation-based learning environments amongst final-year undergraduate nursing students. Nurse Educ. Today 2016, 45, 9–15.
- Rudland, J.R.; Golding, C.; Wilkinson, T.J. The stress paradox: How stress can be good for learning. Med. Educ. 2020, 54, 40–45.
- Wearne, T.A.; Lucien, A.; Trimmer, E.M.; Logan, J.A.; Rushby, J.; Wilson, E.; Filipčíková, M.; McDonald, S. Anxiety sensitivity moderates the subjective experience but not the physiological response to psychosocial stress. Int. J. Psychophysiol. 2019, 141, 76–83.
- Tempesta, D.; Mazza, M.; Serroni, N.; Moschetta, F.S.; Di Giannantonio, M.; Ferrara, M.; De Berardis, D. Neuropsychological functioning in young subjects with generalized anxiety disorder with and without pharmacotherapy. Prog. Neuropsychopharmacol. Biol. Psychiatry 2013, 45, 236–241.
- Bjørshol, C.A.; Myklebust, H.; Nilsen, K.L.; Hoff, T.; Bjørkli, C.; Illguth, E.; Søreide, E.; Sunde, K. Effect of socioemotional stress on the quality of cardiopulmonary resuscitation during advanced life support in a randomized manikin study. Crit. Care Med. 2011, 39, 300–304.
- Fernández-Ayuso, D.; Fernández-Ayuso, R.; Del-Campo-Cazallas, C.; Pérez-Olmo, J.L.; Matías-Pompa, B.; Fernández-Carnero, J.; Calvo-Lobo, C. The Modification of Vital Signs According to Nursing Students’ Experiences Undergoing Cardiopulmonary Resuscitation Training via High-Fidelity Simulation: Quasi-Experimental Study. JMIR Serious Games 2018, 6, e11061.
- Shinnick, M.A. Validating Eye Tracking as an Objective Assessment Tool in Simulation. Clin. Simul. Nurs. 2016, 12, 438–446.
- Cruz-Albarran, I.A.; Benitez-Rangel, J.P.; Osornio-Rios, R.A.; Morales-Hernandez, L.A. Human emotions detection based on a smart-thermal system of thermographic images. Infrared Phys. Technol. 2017, 81, 250–261.
- Mauriz, E.; Ferradal-Villa, P.; Caloca-Amber, S.; Sánchez-Valdeón, L.; Vázquez-Casares, A.M. Effectiveness of infrared thermography in monitoring ventilation performance during cardiopulmonary resuscitation training: A cross-sectional simulation study in nursing students. In Proceedings of the Seventh International Conference on Technological Ecosystems for Enhancing Multiculturality, Salamanca, Spain, 24–26 October 2018; pp. 361–367.
- Ghahramani, A.; Castro, G.; Becerik-Gerber, B.; Yu, X. Infrared thermography of human face for monitoring thermoregulation performance and estimating personal thermal comfort. Build. Environ. 2016, 109, 1–11.
- Haddad, D.S.; Brioschi, M.L.; Baladi, M.G.; Arita, E.S. A new evaluation of heat distribution on facial skin surface by infrared thermography. Dentomaxillofacial Radiol. 2016, 45, 20150264.
- Ioannou, S.; Gallese, V.; Merla, A. Thermal infrared imaging in psychophysiology: Potentialities and limits: Thermal infrared imaging in psychophysiology. Psychophysiology 2014, 51, 951–963.
- Koprowski, R.; Wilczyński, S.; Martowska, K.; Gołuch, D.; Wrocławska-Warchala, E. Dedicated tool to assess the impact of a rhetorical task on human body temperature. Int. J. Psychophysiol. 2017, 120, 69–77.
- Moliné, A.; Gálvez-García, G.; Fernández-Gómez, J.; De la Fuente, J.; Iborra, O.; Tornay, F.; Mata Martín, J.L.; Puertollano, M.; Gómez Milán, E. The Pinocchio effect and the Cold Stress Test: Lies and thermography. Psychophysiology 2017, 54, 1621–1631.