Your browser does not fully support modern features. Please upgrade for a smoother experience.
Please note this is a comparison between Version 1 by Gail Prins and Version 2 by Rita Xu.
The molecular mechanisms underlying prostate development can provide clues for prostate cancer research. It has been demonstrated that MEK/ERK signaling downstream of androgen-targeted FGF10 signaling directly induces prostatic branching during development, while Rho/Rho-kinase can regulate prostate cell proliferation. MEK/ERK and Rho/Rho kinase regulate myosin light chain kinase (MLCK), and MLCK regulates myosin light chain phosphorylation (MLC-P), which is critical for cell fate, including cell proliferation, differentiation, and apoptosis.
- prostate
- branching morphogenesis
- FGF10
- ERK1/2
- Rho kinase
1. Introduction
Developmental biology contributes greatly to the understanding of cancer biology. Accumulating evidence indicates that cancer contains many features of development gone awry, with several developmental genes frequently reactivated in tumor tissues [1][2][1,2]. Thus, knowledge of the molecular mechanisms underlying organ development is essential for gaining novel insights into cancer growth, its progression, and the development of therapeutical intervention strategies.
Prostate development is dependent on androgens and mesenchymal/epithelial interactions [3][4][5][6][3,4,5,6]. The rodent prostate gland is the traditional model for prostate research. Different from the prostate in rodents that consists of anatomically distinct lobes, the human prostate is more compact and composed of three different histological zones. Although it is hard to make direct analogies to the human prostate, the rat prostate is larger in size and more complex histologically than the mouse prostate, making it a better model for developmental studies [7]. The rat prostate gland consists of three lobes, the ventral (VP), lateral (LP), and dorsal (DP) lobes, which exhibit intricate and unique branching patterns [8][9][8,9]. Rat prostate development starts with the formation of urogenital sinus (UGS) epithelial cells buds that penetrate the surrounding UGS mesenchyme in the ventral, dorsal, and lateral directions. At birth, the rat VP, LP, and DP lobes primarily consist of solid elongating main ducts and subsequent outgrowth occurs postnatally. At this developmental stage, ductal epithelial cells proliferate primarily at the leading edge of distal tips [9][10][11][9,10,11]. Ductal branching begins when the elongating epithelial main ducts interact with the surrounding mesenchymal pads peripheral to the periurethral smooth muscle, inducing secondary, tertiary, and further branching events with increasing complexity [9][10][11][9,10,11]. Formation of the prostate secretory ducts involves lumenization of the tubular epithelium in the proximal to distal direction, a common feature of vertebrate organogenesis [3][8][3,8]. The separate rodent prostate lobes exhibit unique branching patterns suspected to be a function of differential mesenchymal morpho-regulatory gene expression [9][10][11][9,10,11]; however, this remains to be clearly established. As such, comparative studies allow for delineation of the differential mechanisms whereby distinctive branching patterns arise [9][10][12][9,10,12].
Additional insight into prostate development comes from prostate organ culture systems that allow functional testing of a given signaling pathway [5][13][14][15][16][5,13,14,15,16]. However, most studies have not interrogated the branching process in detail but rather report on the final endpoints in the whole cultured VP. While a few studies have performed image analysis of prostatic growth and branching morphogenesis, numerical analysis of lobe-specific comparisons has not been elucidated in detail [10][13][17][10,13,17].
Prostate development is controlled through coordinated expression and crosstalk among multiple stimulatory and inhibitory regulators that include developmental genes; secreted signaling molecules; and transcription factors that are regulated by androgens, estrogens, and retinoids [13][17][18][19][20][21][22][23][24][13,17,18,19,20,21,22,23,24]. While androgens are essential and sufficient for prostate growth, whether androgens drive growth and branching independently of these morpho-regulatory factors remains unknown. We previously determined that androgens regulate expression of several rat prostate morpho-regulatory genes via fibroblast growth factor 10 (FGF10)-dependent and -independent pathways [24][25][24,25]. FGF10, secreted by prostate mesenchymal cells, directly induces prostatic branching through FGFR2iiib on distal tip epithelial cells, and activation of downstream signaling through MEK/ERK is required for both prostate budding and ductal branching [24][25][26][27][28][24,25,26,27,28].
Rho signaling has been implicated in branching morphogenesis of the mammary gland and lung [29], but its role in prostate branching has not yet been studied. Further, crosstalk of the MEK/ERK and Rho signaling pathways as well as their common downstream targets in prostatic morphogenesis regulation have not been reported. Phosphorylation of myosin light chain (MLC-P) plays a key role in cell proliferation, division, and migration. MLC-P is regulated by myosin light chain kinase (MLCK) [30][31][30,31], Ras, and Rho. Ras-activated ERK phosphorylates and stimulates MLCK activity, while Rho increases MLC-P by phosphorylating and inactivating the targeting subunit of myosin phosphatase 1 (MYPT). Therefore, MLC-P regulated by the MEK/ERK and Rho signaling pathways may play a critical role in prostate morphogenesis [32].
2. Prostates Exhibit Distinguishing Lobe-Specific Growth and Branching Patterns
Using a numerical and image analysis system developed in our lab [13][17][13,17], we evaluated lobe-specific prostatic branching in the neonatal VP and LP cultured for four days. At pnd 0, each VP lobe had 3–5 long main ducts emanating from the UGS, while each LP had 5–6 shorter main ducts. Starting from the original ducts, the VP formed branches up to the fourth generation, resembling an elm tree, whereas the LP stopped branching at the second generation, resembling a bushy tree (Figure 1A), descriptors previously used by Hayashi et al. [13]. Compared to the LP, the VP had a significantly longer aggregate ductal segment lengths in each successive branch generation after the original duct over time (Figure 1B) and more total branching events from the original ducts (Figure 1C). As a result, the VP had a higher total tip number over time compared to the LP from 10 h onward (Figure 1D). Branching events were characterized as they occurred over 30 min intervals; terminal bifeds and lateral branches predominated in the VP with terminal trifeds as a minor percent (Figure 1E,F). In the LP, terminal bifeds were the dominant branch form followed by lateral branching and infrequent terminal trifeds.
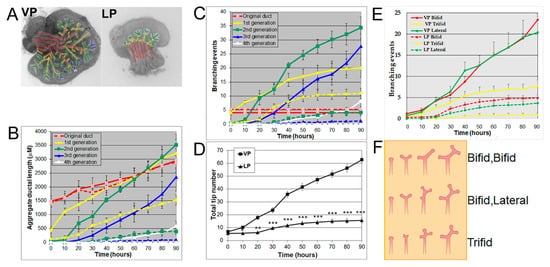
Figure 1. (A) Branch generations of pnd 0 cultured rat VP (left) and LP (right) lobes. Successive images were taken every 30 min for 90 h to track branching events. Representative end-point images at 90 h are shown. A color-coded skeleton is used to indicate branch generations according to the following convention: the primary buds emerging from the UGS are considered the original ducts (red); branches that form off the primary ducts are considered the first generation (yellow); branches that form off the first generation and elongate are considered the second generation (green), third generation (blue), and fourth generation (white). Note that VPs formed branches up to the fourth generation, while LPs stopped branching at the second generation. (B) Kinetics of prostatic bud and ductal elongation and successive branch generations in pnd 0 rat VPs and LPs cultured for 90 h. The aggregate length (µm) of all ductal segments in each successive branch generation over time is shown. Solid lines represent VP data and dashed lines represent LP data. (C) Total number of branch point events in each ductal generation as a function of time. Solid lines represent VP data and dashed lines represent LP data. Error bars denote SEM from 5 sets of experiments. Differences between the two groups are statistically significant (p < 0.05) from 40 h onward except for the original ducts. (D) Total tip number in 3D analysis as a function of time in rat pnd 0 VPs (squares) and LPs (triangles) cultured for 90 h. Each data point represents the mean of 5 sets of experiments and bars denote SEM. * denotes significant differences between VPs and LPs, * p < 0.05, ** p < 0.01, *** p < 0.001. (E) Total counts of specific branching types (terminal bifeds, terminal trifeds, lateral side branches) occurring over time in VPs vs. LPs. Each data point represents the mean of 5 sets of experiments, and bars denote SEM. Differences between VPs and LPs are statistically significant (p < 0.05) from 30 h onward. (F) Illustration of three branching types: terminal bifeds, terminal trifeds, and lateral side branches. The branching schematic at the far right is identical in each row. However, they each came about through 3 different sequences of branching events over time: bifed-bifed, bifed-lateral, and trifed branching. Only sequence imaging over time can correctly clarify the specific branching events.
3. LP1 Had a Longer Original Ductal Length but Fewer Branching Events and Fewer Tips Compared to LP2
At pnd 2, the rat lateral prostate can be further separated into two functionally different subtypes: type 1 (LP1) and type 2 (LP2) lateral prostates. The LP1 extends cranially towards the seminal vesicle and DP, and the LP2 arborizes caudal to the bladder neck and gives rise to compact bushy glands [13]. Hayashi et al. showed that the major secretory proteins of LP1 are DP1 and DP2 proteins, while the major secretory protein of LP2 is probasin [9][10][12][9,10,12]. In the current study, LP1 and LP2 were carefully separated into their individual ductal sub lobes as they emerged from the UGS at pnd 2 and cultured for four days with successive images taken every 30 min for 90 h to track branching events. LP1 and LP2 both had 5–6 original ducts budding from the UGS. LP1 had longer original ducts and formed branches only up to the first generation, resembling a miniature palm tree, whereas LP2 had shorter original ducts and formed branches up to the third generation, resembling a bush (Figure 2A). Numerical and image analysis showed that the aggregate ductal length of LP1 was longer in the original ducts but shorter in the first generation compared to LP2 (Figure 2B). LP1 also had fewer branching events (Figure 2C) and fewer total tips (Figure 2D) than LP2.
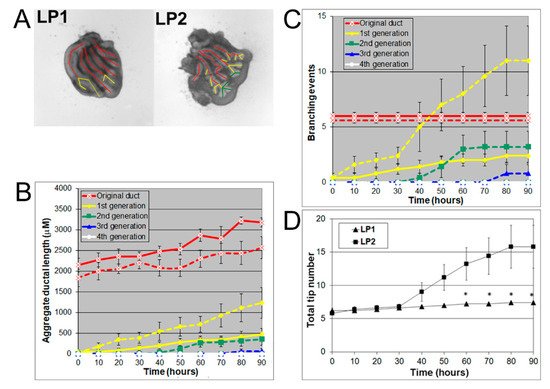
Figure 2. (A) Branch generations of cultured contralateral rat day 2 LP1 (left) and LP2 (right) lobes. Successive images were taken every 30 min for 90 h to track branching events. A color-coded skeleton is used to denote the branch generations as described in Figure 1. Representative end-point images are shown at 90 h. Note that LP1s have longer original ducts and formed branches only up to the first generation over the 4-day culture, whereas LP2s have shorter original ducts and formed branches up to the third generation. (B) Kinetics of prostatic bud and duct elongation over successive branch generations in pnd 2 rat LP1s and LP2s cultured for 90 h. The aggregate length (μm) of all ductal segments in each successive branch generation over time is shown. Solid lines represent data from LP1s, and dashed lines represent data from LP2s. (C) Total number of branch point events in each ductal generation as a function of time. Solid lines represent data from control LP1s, and dashed lines represent data from LP2s. Error bars denote SEM from 5 sets of experiments. Differences between the two groups were statistically significant (p < 0.05) from 20 h onward except for the original ducts. (D) Total tip number in 3D analysis as a function of time in rat day 2 LP1s (squares) and LP2s (triangles) cultured for 90 h. Each data point represents the mean of 5 sets of experiments and bar denotes SEM. * denotes significant differences between LP1s and LP2s, p < 0.05.
4. Effects of MEK Inhibition and FGF10 Supplementation on Ventral or Lateral Prostate Growth and Branching Morphogenesis
Androgens are essential for prostate development, with morphogenesis driven by androgen-dependent, mesenchymal-derived, paracrine-acting factors, including FGF10 [24][25][28][24,25,28], which acts through MEK/ERK signaling [25][27][25,27]. The MEK/ERK signaling pathway was confirmed for the present studies using U0126, a small molecule inhibitor of MEK1/2 activity, the kinase responsible for phosphorylating ERK1/2. Treatment with 20 μM U0126 significantly inhibited VP growth and branching morphogenesis, shifting its pattern towards an LP phenotype (Figure 3A). Numerically, the decrease of total ductal length by U0126 showed an inhibition of ductal elongation (Figure 3B), while the decrease in branching events (Figure 3C) and total tip number (Figure 3D) by U0126 documented the inhibitory effect on prostate branching to LP-type patterns. These results implicate important roles of MEK/ERK signaling in both ductal elongation and prostate branching and suggest that these separate processes are controlled by the same signaling pathway. In control VP cultures, 42.3% of branches were terminal bifid, 19.7% were terminal trifid, and 38% were lateral branch points. U0126 treatment had no significant effect on the distribution pattern of branching types, blocking all three branching types to a similar degree (Figure 3E).
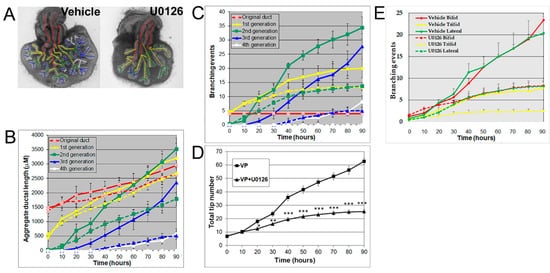
Figure 3. (A) Branch generation in contralateral rat pnd 0 VPs cultured for 90 h in the absence (left) or presence of 20 μM U0126 (right). Successive images were taken every 30 min for 90 h to track branching events. A color-coded skeleton is used to indicate branch generation, as described in Figure 1. Representative end-point images at 90 h are shown. Note that untreated VPs formed branches up to the fourth generation, whereas U0126 treatment blocked the formation of branches at the third generation. (B) Kinetics of prostatic bud and duct elongation over successive branch generations in pnd 0 VPs cultured for 90 h in the absence (solid lines) or presence of 20 μM U0126 (dashed lines). The aggregate length (μm) of all ductal segments in each successive branch generation over time is shown. (C) Total number of branch point events in each ductal generation as a function of time. Solid lines represent data from untreated VPs, and dashed lines represent data from U0126-treated VPs. Error bars denote SEM from 5–7 sets of experiments. Differences between the two groups were statistically significant (p < 0.05) from 50 h onward, except for the original ducts. (D) Total tip number in 3D analysis as a function of time in rat contralateral pnd 0 untreated VPs (squares) and U0126-treated VPs (triangles) cultured for 90 h. Each data point represents the mean of 5–7 sets of experiments and bars denote SEM. * denotes significant differences between two groups, * p < 0.05, ** p < 0.01, *** p < 0.001. (E) Total counts of branching events occurring as terminal bifeds, terminal trifeds, or lateral side branches in VPs cultured in the absence or presence of 20 µM U0126. Differences between the vehicles and U0126 treatments are statistically significant (p < 0.05) from 50 h onward.
Since the present results using image and numerical morphometry showed that blocking FGF10 downstream signaling using a MEK1 inhibitor reduced VP growth and branching morphogenesis and shifted the branching pattern towards a LP phenotype, we next examined the effects of exogenous FGF10 on LP morphogenesis. As predicted, FGF10 (1 µg/mL) supplementation to LP cultures significantly stimulated LP prostate growth and increased the total branching events towards a VP branching pattern (Figure 4).
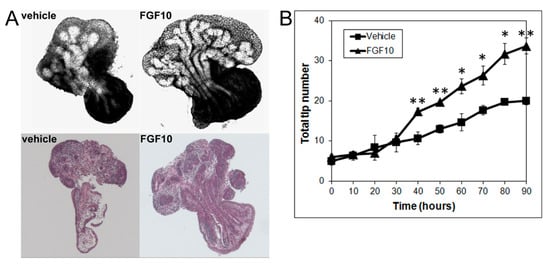
Figure 4. (A) Branch generations of contralateral rat pnd 0 LPs cultured for 90 h in the absence (left) or presence of 1 µg/mL FGF10 (right). Representative end-point images at 90 h are shown (upper panel). H&E staining of corresponding tissues are also shown (lower panel). Note the increased branch formation in 1 µg/mL FGF10-treated LPs. (B) Total tip number in 3D analysis as a function of time in contralateral pnd 0 untreated LPs (squares) and 1 µg/mL FGF10-treated LPs (triangles) cultured for 90 h. Each data point represents the mean of 4 sets of experiments, and bars denote SEM. * denotes significant differences between vehicle and FGF10 treatment, * p < 0.05, ** p < 0.01.
5. Effects of Rho, ROCK, and MLCK Inhibitors on Ventral Prostate Growth and Branching Morphogenesis
Rho/Rho-kinase signaling regulates branching morphogenesis in the mammary gland and lung [29]. To investigate the role of Rho/Rho kinase signaling in prostate morphogenesis, we treated the VP with inhibitors of Rho (C3 transferase, 2 µg/mL) or Rho kinase (Y27632, 20 µM). Both C3 transferase and Y27632 significantly inhibited VP growth and branching by decreasing the total ductal length, branching events, and total tip number, indicating an important role of Rho/Rho kinase signaling in prostate growth (Figure 5).
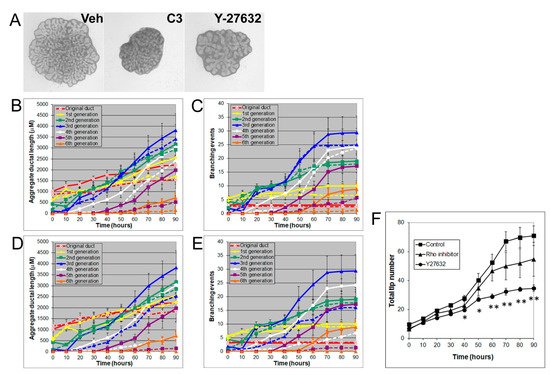
Figure 5. (A) Branch generations of contralateral rat pnd 0 VPs cultured for 90 h with vehicle control (left), 2 µg/mL C3 transferase (middle), or 20 µM Y-27632 (right). Successive images were taken every 30 min for 90 h to track branching events. Representative end-point images at 90 h are shown. Note that there were fewer branch formations in the second to fifth generation with both C3 transferase and Y-27632 treatments. (B) Kinetics of prostatic bud and duct elongation over successive branch generations in pnd 0 VPs cultured for 90 h in the absence (solid lines) or presence of 2 µg/mL C3 transferase (dashed lines). The data show the aggregate length (µm) of all ductal segments in each successive branch generation over time. (C) Total number of branch point events in each ductal generation as a function of time. Solid lines represent data from untreated VPs, and dashed lines represent data from 2 µg/mL C3-transferase-treated VPs. Error bars denote SEM from 4 sets of experiments. Differences between the two groups were statistically significant (p < 0.05) from 20 h onward, except for the original ducts. (D) Kinetics of prostatic bud and duct elongation over successive branch generations in pnd 0 VPs cultured for 90 h in the absence (solid lines) or presence of 20 µM Y-27632 (dashed lines). Data show the aggregate length (µM) of all ductal segments in each successive branch generation over time. (E) Total number of branch point events in each ductal generation as a function of time. Solid lines represent data from untreated VPs, and dashed lines represent data from 20 µM Y-27632-treated VPs. Error bars denote SEM from 4 sets of experiments. Differences between the two groups were statistically significant (p < 0.05) from 20 h onward except for the original ducts. (F) Total tip number in 3D analysis as a function of time in rat pnd 0 untreated VPs (squares), 2 µg/mL C3 transferase-treated VPs (triangles), and 20 µM Y-27632-treated VPs (circles) cultured for 90 h. Each data point represents the mean of 4 sets of experiments, and bars denote SEM. * denotes significant differences between control and treatments, * p < 0.05, ** p < 0.01.
MLC-P, which is regulated by MLCK, plays an important role in cell proliferation, division, and migration [30][31][30,31]. Indeed, 1 to 10 µM of ML-7 dose-dependently inhibited VP growth (Figure 6A) and blocked branching morphogenesis, as denoted by decreases in total ductal length, branching events, and tip numbers (Figure 6B–D).
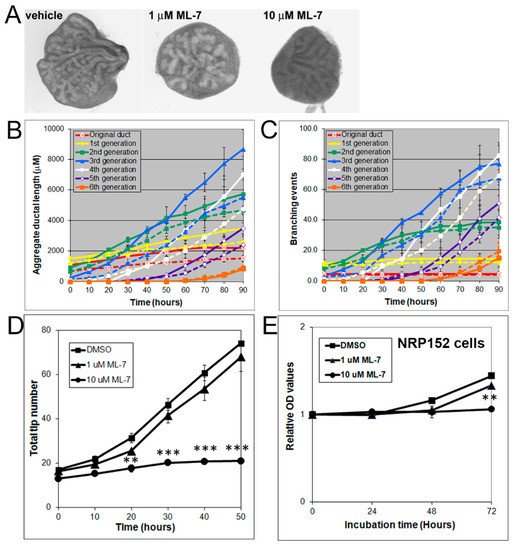
Figure 6. (A) Branching of rat pnd 0 VPs cultured for 40 h in the absence (left) or presence (middle and right) of 1–10 µM ML-7. Successive images were taken every 30 min for 90 h to track branching events. Representative end-point images at 90 h are shown. Note that ML-7 dose-dependently inhibited branch formation in VPs. (B) Kinetics of prostatic bud and duct elongation over successive branch events in pnd 0 VPs cultured for 40 h in the absence (solid lines) or presence (dashed lines) of 10 µM ML-7. Data show the aggregate length (µm) of all ductal segments in each successive branch generation over time. (C) Total number of branch point events in each ductal generation as a function of time. Solid lines represent data from untreated VPs, and dashed lines represent data from 10 µM ML-7 treated VPs. Error bars denote SEM from 4 sets of experiments. Differences between the two groups were statistically significant (p < 0.05) from 20 h onward except for the original ducts. (D) Total tip number in 3D analysis as a function of time in rat contralateral day 0 untreated VPs (squares) and ML-7 treated VPs (1 µM triangles, 10 µM circles) cultured for 40 h. Each data point represents the mean of 4 sets of experiments, and bars denote SEM. * denotes significant differences between controls and treatments, ** p < 0.01, *** p < 0.001. (E) Effects of an MLCK inhibitor on proliferation of cultured NRP152 rat prostate epithelial cells. NRP152 cells were treated with different doses of ML-7 (1, 10 µM) for 24, 48, or 72 h. Cell proliferation activity was evaluated by an MTS cell proliferation assay using the CellTiter 96®AQueous non-radioactive cell proliferation assay kit. * denotes significant differences between control and treatments, ** p < 0.01, N = 4.