Your browser does not fully support modern features. Please upgrade for a smoother experience.
Please note this is a comparison between Version 1 by Emre Kantar and Version 2 by Nora Tang.
One of the most important causes of insulation system failure is the breakdown of the interface between two solid dielectrics; understanding the mechanisms governing this breakdown phenomenon is therefore critical. Solid–solid interfaces in accessories have non-uniform distributions of electrical fields within them in comparison to cables, where the distribution is mostly radial and symmetrical.
- cable insulation
- contact surface
- dielectric breakdown
- electrical breakdown
1. Interfaces in Subsea Cable Connections
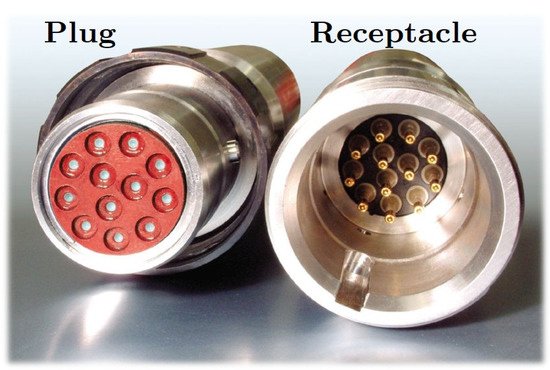
Subsea cable connectors are a pertinent example of modern, sophisticated connector solutions available for cable connectors. They are categorized as “wet-mate” connectors, “dry-mate” connectors, and penetrators. A modern wet-mate connector is composed of a plug and a receptacle, as presented in Figure 12 [1][2]. In subsea applications, the retrieval of pumps or transformers for repairs on the surface is of paramount importance, and wet-mate connectors significantly facilitate performing this task [2][3][4][3,4,5]. Wet-mate connectors can be connected/disconnected underwater, allowing the equipment to be disconnected before retrieval to the surface and to be connected after being installed in the subsea grid [2][3][4][5][6][3,4,5,6,7]. On the other hand, dry-mate connectors require equipment to be assembled on a vessel along with the cable before being lowered to the seabed. Penetrators are essentially cable terminations, allowing high-voltage cables to be run through equipment enclosures [2][3]. High differential pressures are often tolerated by penetrators, and hence they allow equipment requiring a 1-atm environment to be connected [2][3].
Wet-mate subsea connectors have been in operation in the oil and gas industry for a long time because the plugging can take place in water/underwater effortlessly [2][3][4][6][7][3,4,5,7,8]. As the transition to “green energy” is gaining pace recently thanks to the increased awareness of climate change, wet-mate connectors are becoming increasingly popular in renewable energy applications such as offshore wind farms (both floating and fixed-bottom), tidal energy systems, and floating-type photovoltaic power stations (solar farms). However, recent and future subsea extensions require that the wet-mate connector technology be improved in a cost-effective manner so that it can provide higher power ratings with reduced losses and operate at higher voltages and higher temperatures, in deeper waters, and with longer tiebacks [2][3][4][3,4,5].
Currently, wet-mate cable connectors up to 45 kV (dry-mate connectors/penetrators up to 145 kV) are commercially available and applicable for deepwater and dynamic applications, including power umbilicals. Wet-mate connectors are crucial to future subsea substations or mid-point compensation for long high-voltage AC cables. The inter-array voltage level of 33 kV has been upgraded to 66 kV in modern offshore wind parks. The average capacity of an individual wind turbine is likely to increase to above 14 MW, which means the average total capacity of modern wind parks will also rise along with it. Within a few years, inter-array connections in offshore systems will likely require even higher voltage levels above 100 kV. This calls for higher voltage ratings, especially for wet-mate connectors used as vital components in future subsea inter-array grids (e.g., in junction boxes or subsea substations). Thus, further steps must be taken to achieve higher voltage levels (>220 kV for dry-mate, >100 kV for wet-mate) needed for AC longer step-out offshore electrification as a cost-efficient alternative to high-voltage DC.
A connector includes two different insulation systems within a controlled environment: one oil chamber is placed in the other, separated by a diaphragm, as illustrated in Figure 23. The main potentially weak parts in subsea connectors are the interfaces between the solid–solid and solid–liquid dielectric materials. Leading causes of failure are the presence of imperfections, defects, impurities at the interfaces, and water intrusion [8][1]. They are likely to result in locally high field stresses that, in turn, initiate surface discharges through the guide pin, possibly leading to a premature electrical breakdown.
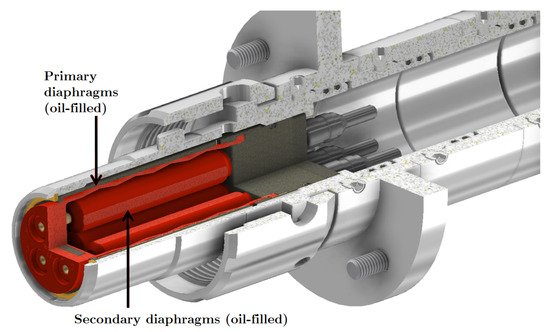
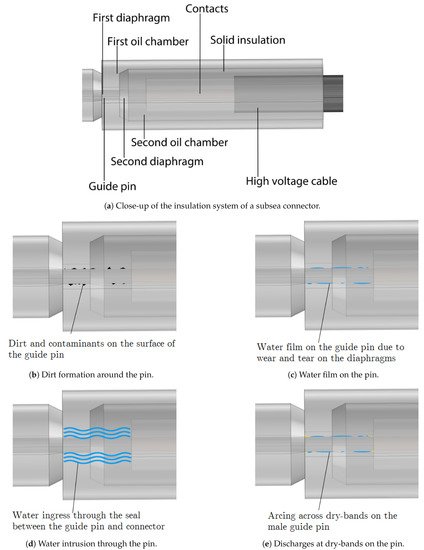
Figure 34a illustrates an engaged subsea connector in operation. The main causes of failure are illustrated in Figure 34b–e at the plug component. Water ingress adversely influences the dielectric performance of insulating oil [5][6]. Several options exist, allowing water to penetrate the connector’s insulation; diffusion through the primary diaphragm is the most common mechanism. In fact, diffusion through the diaphragms inevitably occurs to some extent. Although diffusion is a gradual process, it leads to moderately elevated relative humidity (RH) inside the connector. Increased RH can easily be measured using pertinent readily available humidity sensors [5][6]. Additionally, dirt or water residue on the guide pin or diaphragms as well as mechanical damage may lead to water ingress (Figure 34b,c) [5][6]. Last but not least, while wet-mating, water may enter the oil. A thin conductive layer may also form on the guide pin as a result of inadequate contact pressure between the seal and the guide pin (Figure 34d) as well as the deformation/damage/aging/fatigue of the sealing material. The presence of conductive material will lead to locally high field stresses. Surface discharges through the guide pin may ensue, possibly leading to a complete flashover [5][6].
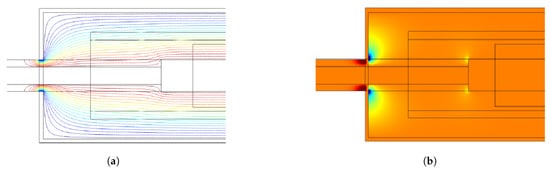
Analyzing a simplified geometry of a subsea connector using finite element methods (FEM) can help reveal problematic areas, as presented in Figure 45a. FEM analysis indicates that the edges where the guide pin engages with the first diaphragm have the greatest local electric field strength. The locally high electric stress holds a high potential for failure based on the voltage rating and material properties of the connector. Electric field grading techniques seem necessary to distribute the electric field more uniformly inside the connector. The tangential component of the electric field (along the pin), depicted in Figure 45b, suggests that the primary diaphragm and contact areas are likely to experience surface discharges. The reason for this is that, in the case that several of the mechanisms become present simultaneously, surface tracking or arcing along the dry bands between impurities, e.g., water droplets, may ensue, as illustrated in Figure 4e. The causes of failure presented here are not inherent only to subsea connectors. In the next section, we focus on solid–solid interfaces.
2. Interfaces in Polymer-Insulated Cable Connections
The simple structure of the insulation in cross-linked polyethylene (XLPE) cables led to the early development of easy-fit prefabricated joints and terminations, whose field control elements are prefabricated and tested in the factory [7][8]. In the past, such accessories were initially developed for medium-voltage (MV) applications, which were then upgraded for the high-voltage (HV) and extra-high-voltage fields (EHV). However, a large number of alternative solutions are currently competing with these prefabricated elements.
Recent developments have progressed to prefabricated and routine-tested slip-on units, even for straight joints and polymer-insulated cables [7][8]. Field control components are already incorporated in these joints [9]. Accessories with slip-on stress cones for HV and EHV cables usually utilize field control deflectors, as shown in Figure 56a [7][10][8,10]. Properly contoured deflectors made from an elastic conductive material are positioned into a similar elastic insulator permanently, then pressed in one piece onto the suitably prepared polymer-insulated cable precisely, such as EPR (ethylene propylene rubber), PE (polyethylene), LDPE (low-density polyethylene), or XLPE.
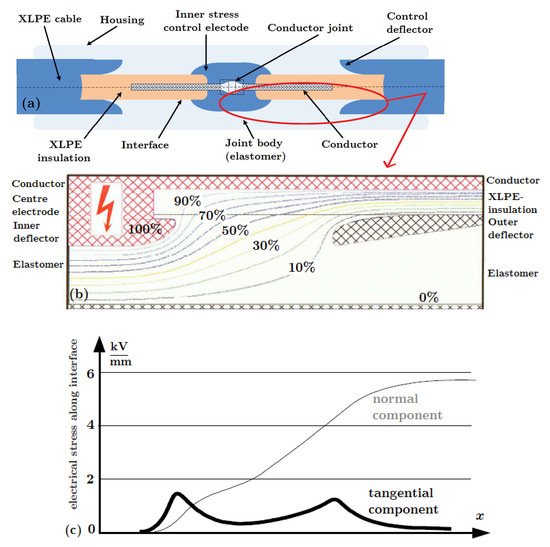
Figure 56. Illustration of a cable joint highlighting the parts where the solid–solid interfaces exist and why the tangential electric field is of concern: (a) prefabricated EHV silicone joint for 400 kV XLPE-insulated cables. Reproduced from [11], NTNU: 2016. (b) Calculated potential distribution in a prefabricated slip-on joint. Reproduced from [8][1], CIGRE: 2000. (c) Calculated field patterns in a prefabricated slip-on joint. Reproduced from [8][1], CIGRE: 2000.
Figure 6a shows the cross-section of a slip-on joint, consisting of two opposing control deflectors and a field smoothing sheet for the conductor connection [7][8]. A conductive coating for the surface of the joint is needed to provide the outer screening. Lastly, a metal housing (durable against corrosion) is used to avoid ingress of moisture and mechanical damage [7][8].
3. Factors Affecting the Interfacial Breakdown Strength
Solid–solid interfaces in cable joints usually arise between a soft material (elastomer/ polymer) and a hard (polymer) material such as XLPE–EPDM (EPDM: ethylene propylene diene monomer), XLPE–SiR (SiR: silicone rubber), XLPE–EPR, and XLPE–PEEK (PEEK: polyether ether ketone), or between the same materials. With soft materials, improved contact and sealing is possible even at low and moderate contact pressures.
Despite the presence of deflectors with identical structures, different field conditions arise in joints to those in sealing ends. In particular, the tangential component of the electrical field that is locally enhanced at the interface between the cable dielectric and joint insulation becomes more significant relative to the maximum field strength within the body of the joint [7][8]. Accurate field calculations, as illustrated in Figure 56, are essential to avoid intolerably high stresses and to optimize the shape of the joint. Figure 56b,c depicts the results of field calculations in the form of the potential distribution and the field distribution of the normal and tangential components in a 400 kV slip-on joint, respectively [7][8].
The electrical performance of solid–solid interfaces are dependent on the following:
-
Surface roughness;
-
Contact force;
-
Mechanical and electrical characteristics of the insulation materials, such as elasticity and tracking resistance;
-
Surrounding/insulating dielectric medium; and
-
Care exercised and conditions during assembly.
In the next section, the individual effect of each above-listed parameter is present.
4. Contact Surfaces at Solid–Solid Interfaces
Prefabricated and pretested/qualified cable accessories do not necessarily guarantee ideal assembly conditions because the site conditions in which they are usually assembled may be suboptimal and hard-to-control [7][8]. As long as the fitting is not performed in a laboratory or cleanroom environment, the interfaces will be vulnerable during installation. Consequently, cavities, protrusions, and impurities are likely to develop at solid–solid interfaces [8][1]. Figure 56c illustrates the locally enhanced electric field stresses originating from imperfections at an interface (complementary to Figure 45). To be more specific, rough surfaces lead to various cavities at the interfaces, whereas contact force affects the size and deformation of the cavities and contact areas, as shown in Figure 67. Mechanical and electrical characteristics of the insulation materials, such as elasticity and interfacial tracking resistance, strongly affect the interfacial BDS. The type and quantity of lubricant/grease used during assembly, water penetration to the interface, or assembly at dry and optimal conditions change the insulating dielectric medium filling the cavities. Lastly, poor workmanship, wear and tear of materials, contaminants, and impurities cause a substantial reduction in the BDS [7][8].
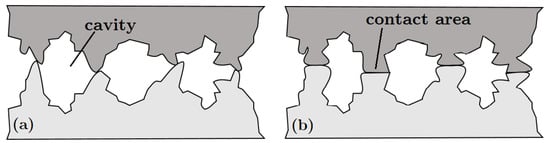
Figure 67. Illustration of surface asperities leading to cavities and contact spots at solid–solid interfaces at (a) no-load, (b) increased contact area and reduced cavity size under load. Reproduced from [12], Macedonian Journal of Chemistry and Chemical Engineering: 2018.
As previously stated, the presence of the solid–solid interfaces (i.e., imperfect contact) increases the risk of locally high electric field stresses, leading to partial discharges (PD) and eventually a premature flashover [8][7][13][14][15][16][17][18][19][1,8,13,14,15,16,17,18,19].
A major failure process for power cable connectors is the breakdown of the interfacial layer between two solid insulating materials, as reported in [8][7][13][15][17][18][1,8,13,15,17,18]. When dimensioning the thickness of the insulation walls of the cable and joint body, Peschke and Olshausen [7][8] recommend restricting the operational stress on the outer conductive layer to around 6–7 kV/mm even if the installation is performed with due care, and the mechanical and electrical design of the apparatus is optimal [7][8].
Cavities on a dielectric surface differ in size and distribution based on the surface roughness, contact force, and mechanical properties of the material, as well as the care taken during manufacturing and installation [8][7][1,8]. Surface irregularities cause discrete contact points that form when two rough, nominally flat surfaces are brought into contact. Figure 78a,b illustrates the formation of numerous cavities between contact spots. Figure 78b elucidates the significantly low ratio of “actual contact area” to “nominal contact area”. An interfacial cavity along the tangential axis (x- or y-axis) is generally considerably larger, as illustrated in Figure 78c [20].
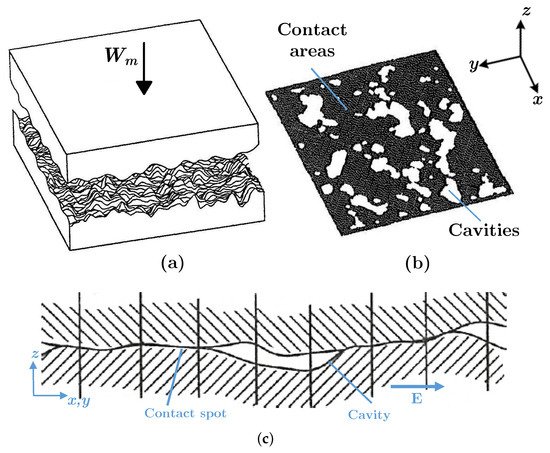
Figure 78. (a) Demonstration of two rough surfaces in contact. (b) Contact area and cavities at the interface in 3D. (c) A two-dimensional illustration of cavities at the interface. Reproduced from [21], ASME Journal of Tribology: 1996.
In light of the overview of the important parameters discussed in this section, the primary parameters influencing the distribution and size of microcavities and hence the electrical breakdown strength of solid–solid interfaces are summarized in Figure 89a with their individual effects on the interfacial dielectric strength illustrated in Figure 89b.
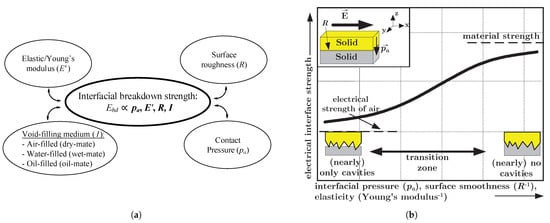
Figure 89. Parameters influencing the breakdown voltage (dielectric strength) of solid–solid interfaces. (a) Balloon chart summarizing the parameters. (b) Electrical interface strength vs. pressure and roughness. Reproduced from [22], CIGRE: 2002.