Helicobacter pylori (HP) infection and the autoimmune inflammation of the gastric mucosa are recognized as the leading etiological factors of chronic atrophic gastritis, a disease associated with an increased risk of stomach cancer development. Additionally, in relation to HP-associated gastritis, there is international and national consensus on the diagnosis and treatment of infection; however, with regard to autoimmune inflammation, clinicians have faced diagnostic difficulties. At the same time, autoimmune inflammation of the gastric mucosa, in addition to the formation of atrophy and an increase in the risk of stomach cancer, carries additional risks, both in relation to neoplasms (neuroendocrine tumors) and in relation to the deficiency of a number of micronutrients with the involvement of other organs and systems.
- chronic autoimmune gastritis
- atrophic gastritis
- nutritional status
- vitamin B12 deficiency
- megaloblastic anemia
- neuroendocrine tumors
- gastric adenocarcinoma
- gastric neuroendocrine hyperplasia
1. Introduction
The role of nutrition in the development of autoimmune inflammation has not been reliably established. It is believed that a widespread Western diet, which is high in calories, simple carbohydrates, refined foods, saturated fats, and red meat, and low in omega-3 and omega-9 polyunsaturated fatty acids and plant fiber, may increase the risk of autoimmune diseases [13,14][1][2]. For the prevention and inhibition of autoimmune inflammation, an autoimmune protocol diet was developed, which is a modification of the Paleolithic diet with the elimination of specific foods, including cereals, beans, solanaceous family, dairy products, eggs, coffee, alcohol, nuts and seeds, refined sugars, oils, and food additives [15][3].
CAG is characterized by a decrease in the absorption of valuable micronutrients, primarily vitamin B12 and iron, with the development of their deficiency symptoms, which can help in identifying such patients ( Table 21 ).
| Micronutrient | Development Frequency | Development Mechanisms | Manifestations |
|---|---|---|---|
| Vitamin B12 | 37–69% | Decreased production of intrinsic Castle’s factor by parietal cells of the gastric body and decreased absorption of vitamin B12 in the ileum | Hematological, gastroenterological, neuropsychiatric disorders |
| Iron | 52% | The presence of erosive lesions of the mucous membrane and possible latent blood loss, concomitant infection with H. pylori and bacteria competition for dietary iron, hypochlorhydria, and increased hepcidin synthesis against a background of a concomitant inflammatory process | Microcytic anemia |
| Vitamin C | Unknown | Breakdown of ascorbic acid in the stomach due to increased pH (hypo-, achlorhydria) and concomitant bacterial overgrowth in the small intestine | Decreased antioxidant defense, immunity, and protein synthesis |
| Calcium | Unknown | Dissolution, ionization, and absorption of calcium salts decrease under conditions of hypo-, achlorhydria | Osteopenia/Osteoporosis |
| Vitamin D | 12.1% | Not determined | Secondary hyperparathyroidism, osteopenia/osteoporosis, decreased immunity, increased risk of autoimmune disease development |
According to epidemiological studies, the prevalence of concomitant autoimmune diseases in patients with CAG reaches 40%, and the most common disorders are thyroid diseases, type 1 diabetes mellitus, hemolytic anemia, vitiligo, alopecia, rheumatoid arthritis, psoriasis, autoimmune hepatitis, myasthenia, and Sjogren disease [18][4]. The spectrum of autoimmune diseases associated with CAG is presented in Table 32 .
| Disease | Association Degree |
|---|---|
| Autoimmune thyroiditis (Hashimoto’s thyroiditis) and Graves’ disease | ++++ (multiple cohort studies, two crossover studies, and two case–control studies) |
| Type 1 diabetes mellitus | +++ (one case–control study and several cohort studies) |
| Vitiligo | ++ (one cohort study and several clinical observations) |
| Alopecia | ++ (several cohort studies) |
| Celiac disease | ++ (several cohort studies) |
| Myasthenia gravis | + (single clinical observations) |
| Connective tissue disease | ++ (one cohort study and several clinical observations) |
| Primary biliary cholangitis | ++ (one cohort study and several clinical observations) |
| Primary sclerosing cholangitis | + (single clinical observations) |
| Autoimmune hepatitis | + (single clinical observations) |
| Addison’s disease | + (single clinical observations) |
| Primary ovarian insufficiency | + (single clinical observations) |
| Primary hypoparathyroidism | + (single clinical observations) |
| Lambert-Eaton syndrome | + (single clinical observations) |
| Oral lichen planus | + (single clinical observations) |
2. Diagnostic Approaches
2.1. Laboratory Methods
| Indicant | Value | Comments |
|---|---|---|
| Antibodies to parietal cells | ↑ | They are found in 80–90% of patients with CAG, but they can also be present in 7.8–19.5% of healthy adults, as well as in people infected with HP or with other autoimmune diseases. They may not be determined in the later stages of the disease, as atrophy of the gastric mucosa progresses. |
| Antibodies to the intrinsic Castle’s factor | ↑ | Specificity—98.6%, sensitivity—30–60%. They correlate with atrophy of the gastric mucosa. |
| Pepsinogen I | ↓ | It is produced by the main cells of the stomach’s body. A decrease in the indicator shows the presence of atrophy in the mucous membrane of the stomach’s body. Serum level decreases in proportion to the severity of atrophy. |
| Pepsinogen II | Not changed | It is produced mainly in the stomach’s antrum and duodenum; therefore, it does not change with CAG. |
| Pepsinogen I/Pepsinogen II | ↓ | They decrease linearly with increasing severity of atrophy of the stomach’s body glands. |
| Gastrin-17 | ↑ | It is produced by gastrin-producing cells of the stomach’s antrum. With a decrease in acid production against the background of the stomach’s body glands atrophy, it increases by the mechanism of a negative feedback loop. |
| Chromogranin A | ↑ | It correlates with the degree of ECL cell hyperplasia under conditions of hypo- and achlorhydria. Due to the low sensitivity and specificity, its widespread use in routine practice is limited. |
2.2. Endoscopic Examination
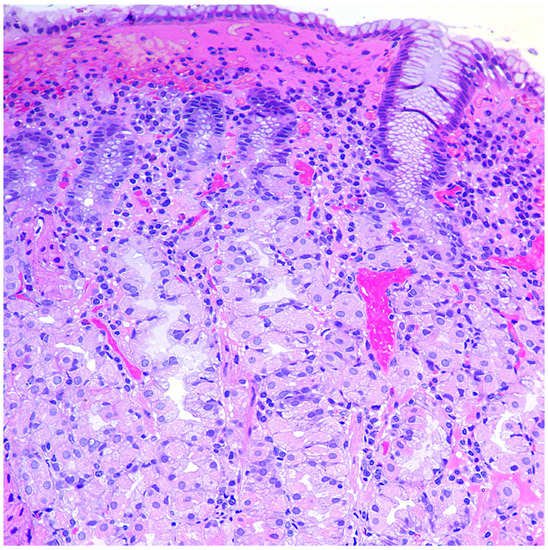
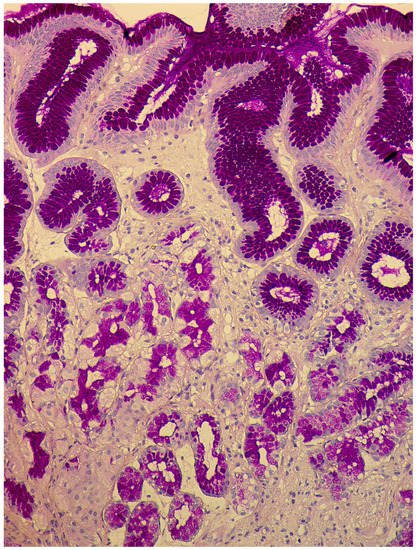
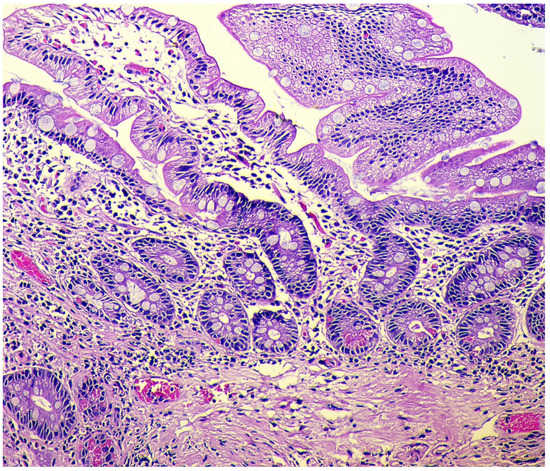
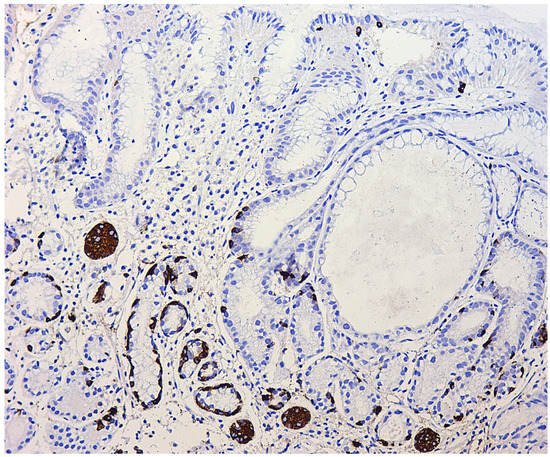
2.3. Morphological Examination
-
Simple diffuse hyperplasia. This is characterized by a more than two-fold increase in the population of ECL cells. Diagnosis is difficult due to the lack of clear quantitative criteria. The diagnosis is poorly reproduced on biopsy material.
-
Linear hyperplasia. The presence in one visual field of at least two groups of linearly located neuroendocrine cells, consisting of five or more cells. Usually, changes are diagnosed in the area of the neck glands (Figure 4).
-
Micronodular hyperplasia. The presence of the cells’ cluster in contact with the basement membrane, but not exceeding the diameter of the gland, up to 150 μm in diameter, or a similar cluster located freely in the lamina propria of gastric mucosa.
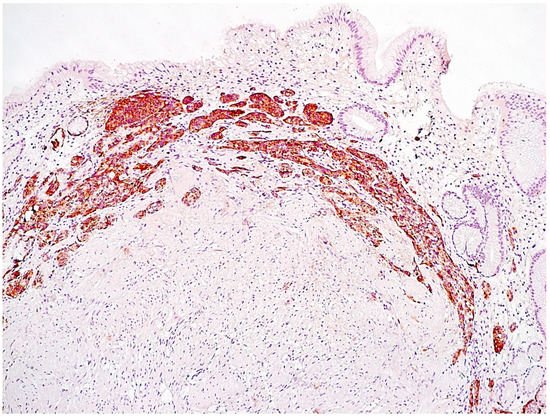
-
Adenomatous (adenomatoid) hyperplasia. The presence of an aggregate of five or more clusters (Figure 5).
-
Neuroendocrine cells dysplasia. Merging clusters with diameters of more than 150 µm but less than 500 µm.
References
- Venter, C.; Eyerich, S.; Sarin, T.; Klatt, K.C. Nutrition and the Immune System: A Complicated Tango. Nutrients 2020, 12, 818.
- Manzel, A.; Muller, D.N.; Hafler, D.A.; Erdman, S.E.; Linker, R.A.; Kleinewietfeld, M. Role of “Western diet” in inflammatory autoimmune diseases. Curr. Allergy Asthma Rep. 2014, 14, 404.
- Abbott, R.D.; Sadowski, A.; Alt, A.G. Efficacy of the Autoimmune Protocol Diet as Part of a Multi-disciplinary, Supported Lifestyle Intervention for Hashimoto’s Thyroiditis. Cureus 2019, 11, e4556.
- Carabotti, M.; Lahner, E.; Esposito, G.; Sacchi, M.C.; Severi, C.; Annibale, B. Upper gastrointestinal symptoms in autoimmune gastritis: A cross-sectional study. Medicine 2017, 96, e5784.
- Toh, B.H. Diagnosis and classification of autoimmune gastritis. Autoimmun. Rev. 2014, 13, 459–462.
- Rusak, E.; Chobot, A.; Krzywicka, A.; Wenzlau, J. Anti-parietal cell antibodies—Diagnostic significance. Adv. Med. Sci. 2016, 61, 175–179.
- Lahner, E.; Norman, G.L.; Severi, C.; Encabo, S.; Shums, Z.; Vannella, L.; Delle Fave, G.; Annibale, B. Reassessment of intrinsic factor and parietal cell autoantibodies in atrophic gastritis with respect to cobalamin deficiency. Am. J. Gastroenterol. 2009, 104, 2071–2079.
- Bizzaro, N.; Antico, A. Diagnosis and classification of pernicious anemia. Autoimmun. Rev. 2014, 13, 565–568.
- Antico, A.; Tampoia, M.; Villalta, D.; Tonutti, E.; Tozzoli, R.; Bizzaro, N. Clinical usefulness of the serological gastric biopsy for the diagnosis of chronic autoimmune gastritis. Clin. Dev. 2012, 2012, 520970.
- Lombardo, L.; Leto, R.; Molinaro, G.; Migliardi, M.; Ravarino, N.; Rocca, R.; Torchio, B. Prevalence of atrophic gastritis in dyspeptic patients in Piedmont. A survey using the GastroPanel test. Clin. Chem. Lab. Med. 2010, 48, 1327–1332.
- Telaranta-Keerie, A.; Kara, R.; Paloheimo, L.; Härkönen, M.; Sipponen, P. Prevalence of undiagnosed advanced atrophic corpus gastritis in Finland: An observational study among 4,256 volunteers without specific complaints. Scand. J. Gastroenterol. 2010, 45, 1036–1041.
- McNicholl, A.G.; Forné, M.; Barrio, J.; De la Coba, C.; González, B.; Rivera, R.; Esteve, M.; Fernandez-Bañares, F.; Madrigal, B.; Gras-Miralles, B.; et al. Accuracy of GastroPanel for the diagnosis of atrophic gastritis. Eur. J. Gastroenterol. Hepatol. 2014, 26, 941–948.
- Baudin, E.; Bidart, J.M.; Bachelot, A.; Ducreux, M.; Elias, D.; Ruffié, P.; Schlumberger, M. Impact of chromogranin A measurement in the work-up of neuroendocrine tumors. Ann. Oncol. 2001, 12, S79–S82.
- Zhang, C.; Huang, Y.; Long, J.; Yao, X.; Wang, J.; Zang, S.; Qu, W.; Wang, F. Serum chromogranin A for the diagnosis of gastroenteropancreatic neuroendocrine neoplasms and its association with tumour expression. Oncol. Lett. 2019, 17, 1497–1504.
- Wang, Y.H.; Yang, Q.C.; Lin, Y.; Xue, L.; Chen, M.H.; Chen, J. Chromogranin A as a marker for diagnosis, treatment, and survival in patients with gastroenteropancreatic neuroendocrine neoplasm. Medicine 2014, 93, e247.
- Tian, T.; Gao, J.; Li, N.; Li, Y.; Lu, M.; Li, Z.; Lu, Z.; Li, J.; Shen, L. Circulating Chromogranin, A as A Marker for Monitoring Clinical Response in Advanced Gastroenteropancreatic Neuroendocrine Tumors. PLoS ONE 2016, 11, e0154679.
- Peracchi, M.; Gebbia, C.; Basilisco, G.; Quatrini, M.; Tarantino, C.; Vescarelli, C.; Massironi, S.; Conte, D. Plasma chromogranin A in patients with autoimmune chronic atrophic gastritis, enterochromaffin-like cell lesions and gastric carcinoids. Eur. J. Endocrinol. 2005, 152, 443–448.
- Massironi, S.; Fraquelli, M.; Paggi, S.; Sangiovanni, A.; Conte, D.; Sciola, V.; Ciafardini, C.; Colombo, M.; Peracchi, M. Chromogranin A levels in chronic liver disease and hepatocellular carcinoma. Dig. Liver Dis. 2009, 41, 31–35.
- Coati, I.; Fassan, M.; Farinati, F.; Graham, D.Y.; Genta, R.M.; Rugge, M. Autoimmune gastritis: Pathologist’s viewpoint. World J. Gastroenterol. 2015, 21, 12179–12189.
- Pimentel-Nunes, P.; Libânio, D.; Marcos-Pinto, R.; Areia, M.; Leja, M.; Esposito, G.; Garrido, M.; Kikuste, I.; Megraud, F.; Matysiak-Budnik, T.; et al. Management of epithelial precancerous conditions and lesions in the stomach (MAPS II): European Society of Gastrointestinal Endoscopy (ESGE), European Helicobacter and Microbiota Study Group (EHMSG), European Society of Pathology (ESP), and Sociedade Portuguesa de Endoscopia Digestiva (SPED) guideline update 2019. Endoscopy 2019, 51, 365–388.
- Torbenson, M.; Abraham, S.C.; Boitnott, J.; Yardley, J.H.; Wu, T.T. Autoimmune gastritis: Distinct histological and immunohistochemical findings before complete loss of oxyntic glands. Mod. Pathol. 2002, 15, 102–109.
- Stolte, M.; Baumann, K.; Bethke, B.; Ritter, M.; Lauer, E.; Eidt, H. Active autoimmune gastritis without total atrophy of the glands. Z. Gastroenterol. 1992, 30, 729–735.
- Itsuno, M.; Watanabe, H.; Iwafuchi, M.; Ito, S.; Yanaihara, N.; Sato, K.; Kikuchi, M.; Akiyama, N. Multiple carcinoids and endocrine cell micronests in type A gastritis. Their morphology, histogenesis, and natural history. Cancer 1989, 63, 881–890.
- Graham, D.Y.; Rugge, M.; Genta, R.M. Diagnosis: Gastric intestinal metaplasia—What to do next? Curr. Opin. Gastroenterol. 2019, 35, 535–543.
- Wada, Y.; Nakajima, S.; Kushima, R.; Takemura, S.; Mori, N.; Hasegawa, H.; Nakayama, T.; Mukaisho, K.I.; Yoshida, A.; Umano, S.; et al. Pyloric, pseudopyloric, and spasmolytic polypeptide-expressing metaplasias in autoimmune gastritis: A case series of 22 Japanese patients. Virchows Arch. 2021, 479, 169–178.
- Rugge, M. Biologic profiles meet clinical priorities: Incorporating pseudopyloric, and spasmolytic-expressing metaplasia in the assessment of gastric atrophy. Virchows Arch. 2020, 477, 487–488.
- Silva, S.; Filipe, M.I.; Pinho, A. Variants of intestinal metaplasia in the evolution of chronic atrophic gastritis and gastric ulcer. A follow up study. Gut 1990, 31, 1097–1104.
- Jencks, D.S.; Adam, J.D.; Borum, M.L.; Koh, J.M.; Stephen, S.; Doman, D.B. Overview of Current Concepts in Gastric Intestinal Metaplasia and Gastric Cancer. Gastroenterol. Hepatol. 2018, 14, 92–101.
- Rugge, M.; Fassan, M.; Pizzi, M.; Zorzetto, V.; Maddalo, G.; Realdon, S.; De Bernard, M.; Betterle, C.; Cappellesso, R.; Pennelli, G.; et al. Autoimmune gastritis: Histology phenotype and OLGA staging. Aliment. Pharmacol. Ther. 2012, 35, 1460–1466.
- Zullo, A.; Hassan, C.; Romiti, A.; Giusto, M.; Guerriero, C.; Lorenzetti, R.; Campo, S.M.; Tomao, S. Follow-up of intestinal metaplasia in the stomach: When, how and why. World J. Gastrointest. Oncol. 2012, 4, 30–36.
- Vannella, L.; Lahner, E.; Osborn, J.; Bordi, C.; Miglione, M.; Delle Fave, G.; Annibale, B. Risk factors for progression to gastric neoplastic lesions in patients with atrophic gastritis. Aliment. Pharmacol. Ther. 2010, 31, 1042–1050.
- Capelle, L.G.; de Vries, A.C.; Haringsma, J.; Ter Borg, F.; de Vries, R.A.; Bruno, M.J.; van Dekken, H.; Meijer, J.; van Grieken, N.C.; Kuipers, E.J. The staging of gastritis with the OLGA system by using intestinal metaplasia as an accurate alternative for atrophic gastritis. Gastrointest. Endosc. 2010, 71, 1150–1158.
- Shah, S.C.; Piazuelo, M.B.; Kuipers, E.J.; Li, D. AGA Clinical Practice Update on the Diagnosis and Management of Atrophic Gastritis: Expert Review. Gastroenterology 2021, 161, 1325–1332.e7.
- Rugge, M.; Fassan, M.; Pizzi, M.; Farinati, F.; Sturniolo, G.C.; Plebani, M.; Graham, D.Y. Operative link for gastritis assessment vs operative link on intestinal metaplasia assessment. World J. Gastroenterol. 2011, 17, 4596–4601.
- Kononov, A.V.; Mozgovoĭ, S.I.; Shimanskaia, M.V.; Markelova, M.V.; Osintseva, I.L.; Vas’kina, T.V.; Paniushkin, L.V. The Russian revision of chronic gastritis classification: Reproducibility of the pathomorphologic picture. Arkhiv Patol. 2011, 73, 52–56. (In Russian)
- Wei, N.; Zhong, Z.; Shi, R. A novel method of grading gastric intestinal metaplasia based on the combination of subtype and distribution. Cancer Cell Int. 2021, 21, 61.
- La Rosa, S.; Vanoli, A. Gastric neuroendocrine neoplasms and related precursor lesions. J. Clin. Pathol. 2014, 67, 938–948.
- Cockburn, A.N.; Morgan, C.J.; Genta, R.M. Neuroendocrine proliferations of the stomach: A pragmatic approach for the perplexed pathologist. Adv. Anat. Pathol. 2013, 20, 148–157.
- Hsing, A.W.; Hansson, L.E.; McLaughlin, J.K.; Nyren, O.; Blot, W.J.; Ekbom, A.; Fraumeni, J.F. Pernicious anemia and subsequent cancer. A population-based cohort study. Cancer 1993, 71, 745–750.
- Borch, K.; Ahren, B.; Ahlman, H.; Falkmer, S.; Granerus, G.; Grimelius, L. Gastric carcinoids: Biologic behavior and prognosis after differentiated treatment in relation to type. Ann. Surg. 2005, 242, 64–73.