Your browser does not fully support modern features. Please upgrade for a smoother experience.
Please note this is a comparison between Version 2 by Jason Zhu and Version 6 by Jason Zhu.
In lithium-ion battery manufacturing, wetting of active materials is a time-critical process. Consequently, the impact of possible process chain extensions such as lamination needs to be explored to potentially improve the efficiency of the electrode and separator stacking process in battery cell manufacturing.
- electrolyte wetting
- lamination
- gravimetric measurement
- electrochemical impedance spectroscopy
1. Introduction
The demand for battery cells, and in particular lithium-ion batteries, has been rising for years, and a further increase is forecast for the next several years [1]. These increasing demands are contrasted by various challenges on the battery cell production side: High energy and power density, low process times, reliable safety concepts, high quality, and low costs [2]. Within the process chain of battery production, these challenges can be addressed at different stages. Promising process steps to reduce process time and production costs are electrolyte filling and wetting [3]. These are quality-critical process steps since without sufficient wetting of all cell components, optimal performance of the cell is not achieved by formation, and, in the worst case, cell failure occurs [4]. In practice, this aspect leads to long storage times during the wetting process to ensure complete wetting and to avoid quality degradation during formation. Typically, storage times could take up to 24 h [3].
In order to investigate and better understand these property relationships of the wetting process, different measurement methods have been developed. Electrochemical methods provide access to investigations of the electrolyte wetting process. Above all, the measurement of the cell resistance as a function of the wetting time can provide a wide range of information about the wetting behavior of battery cells. Here, electrochemical impedance spectroscopy (EIS) can be used to determine this quantity [5][6]. The electrochemical methods can not only be used to study the influence of various cell components on electrolyte wetting, but also be for standardized inline investigations of individual battery cells within the production process. This way, storage times that occur before the cell formation can be significantly reduced, thus saving production costs. Another benefit of the electrochemical methods is that they allow the detection of microscopic wetting. Thus, the electrolyte inflow into the electrode pores can also be investigated [6]. The knowledge gained serves as a starting point for new processes [7] or material improvements [8][9][10] to accelerate wetting without having to accept quality losses.
The duration of wetting is subject to a complex relationship of different process-structure-property relationships. Although the wettability depends particularly on the material properties of the electrodes, the separator, and the electrolyte [11], other parameters such as the type of cell stack assembly (stack vs. jelly roll), which affects the diffusion path and distance, or the geometric dimensions of the electrodes can also influence the duration of wetting [12]. Likewise, process parameters of electrolyte filling, such as evacuation pressure, also influence the wetting time. In addition to material-related influences or process-related influences from the electrolyte filling process, process steps that precede electrolyte filling can also have an impact on the wettability of the cell components or the cell assembly. The process step lamination, in which the electrode and the separator suitable for lamination are joined together by applying temperature and pressure, represents such a process step. The material bond between the electrode and the separator creates an electrode-separator composite with advantageous mechanical properties such as increased bending stiffness or fixed individual components [13], advantageous electrochemical properties such as improved fast-charging properties in the cell assembly [14], and promising properties with regard to electrolyte wetting. Due to the material bond between separator and electrode, dead volume in which electrolyte accumulates can be avoided between these two layers. Additionally, due to the connection of separator and electrodes and the resulting interface between them, capillary effects can occur, which accelerate the wetting process.
2. Experiment
With the goal of obtaining meaningful results that are as holistic as possible, data were triangulated using three different measurement methods (gravimetric, optical, and electrochemical) to determine the wetting rate of laminated electrode-separator assemblies for pouch cells. The gravimetric experiments in test series 1 (VR1) determine the wetting rate effects via the mass increase in the sample material, whereas the optical method (VR2) visually records the rise in height and the electrochemical experiments (VR3) measure the change in resistance to infer the wetting rate effects of lamination. VR1 and VR2 were measured simultaneously with the same sample, but with different methods, whereby the electrolyte always remains at a temperature of 20 °C. Each of the experimental data points listed below was repeated three times with punched out samples of 20 mm × 40 mm in size under uniform conditions in the drying room (dew point −40 °C, 20 °C ambient temperature):- (i) cathode—separator (non-laminated)
- (ii) cathode—separator (laminated at 120 °C, contact pressure of 5.5 Nmm−2)
- (iii) cathode—separator (laminated at 80 °C, contact pressure of 5.5 Nmm−2)
- (iv) anode—separator (non-laminated)
- (v) anode—separator (laminated at 120 °C, contact pressure of 5.5 Nmm−2)
- (vi) anode—separator—cathode as a compartment (non-laminated)
- (vii) anode—separator—cathode (laminated at 130 °C, contact pressure of 5.5 Nmm−2)
- The electrode-separator laminates used in VR1 and VR2 were all laminated using the SDL 50 pro lamination system from company Polatek SL-Laminiertechnik GmbH at a feed rate of 1 mm/min by pressing the electrode and the separator with two heated rollers together to form a material bond between them.
-
3.Gravimetric Measurement
- The left part of Figure 1 illustrates the m2-t diagram of the tensiometer measurement for the cathode tests i–iii with the associated standard deviations. All data points show the typical degressive behavior of a root function and thus the expected curve of the experiment. In the right picture, the m-t0.5 graph is shown, which was linearized by the transformation of the m2-t graph using a root function. The slope of the graphs was evaluated in the time interval of 10–15 s0.5 to determine the penetration rate K.
-
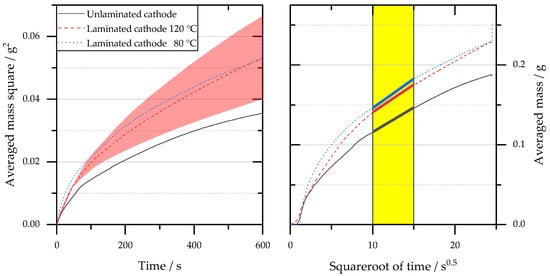 Figure 1. Results of gravimetric measurement of the cathode separator measurement series (i) to (iii). Smoothed measurement data of the tensiometer measurement (left) and transformed measurement data with an evaluation range of 10 to 15 s0.5 (right).Qualitatively, it can be seen from the left graph (the bigger increase in the measured electrolyte mass) and quantitatively from the right graph (higher slope of the graphs) that the wetting for the experimental points ii and iii of the laminated samples is stronger than the wetting of the non-laminated sample (i). The quantitative results of the evaluation are shown in Table 1. Both samples with a lamination temperature of 80 °C as well as with a lamination temperature of 120 °C led to an increase in the penetration rate. This increase shows a significant difference (5% significance level). No differences can be detected between the lamination temperatures with respect to the penetration rate K, which is converted into the wetting rate k by means of Equation (3). The latter indicates the experimentally determined height of rise from the gravimetric measurement and serves as a comparative value to the measurement result of the optical test VR1.Table 1.Evaluated parameters penetration rate K and wetting rate k for the cathode separator measurement series (i) to (iii).
As expected, the same qualitative test results with regard to the penetration rate were obtained for the test series of the anode (iv–v) and the compartment (vi–vii), see Appendix A Figure A1 and Figure A2. The laminated samples wetted significantly better than the non-laminated samples. The reason for the improved wetting is assumed to arise from the interconnection between the cellular materials. Wetting between the materials is more distinct via the pronounced PVDF bridges (trans-material wetting). The formation of thin channels/pore systems is also possible, which serve as new wetting pathways in the way of a new wetting layer.Material Penetration Rate K
[g/s0.5]Standard Deviation
[g/s0.5]Wetting Rate k
[mm/s0.5]Standard Deviation
[mm/s0.5]Non-laminated compound Non-laminated separator2.40 × 10−3 4.84 × 10⁻⁴ 1.69 × 10⁻² 3.40 × 10⁻³ Laminated compound 80 °C 3.76 × 10⁻³ 8.54 × 10⁻⁴ 2.64 × 10⁻² 6.00 × 10⁻³ Laminated compound 120 °C 3.79 × 10⁻³ 5.22 × 10⁻⁴ 2.67 × 10⁻² 3.67 × 10⁻³ 4. Optical Measurement
Figure 2 shows the h-t graph of the optically determined rise height. The evaluation was performed for the laminated samples (ii and iii) for one wetting front. For the non-laminated sample, the two materials were wetted at different rates, so both wetting fronts (separator and cathode) were evaluated separately. The mean wetting front of the non-laminated compound was calculated according to Equation (5). In some cases, a digressively decreasing behavior can be observed in the measurement graphs.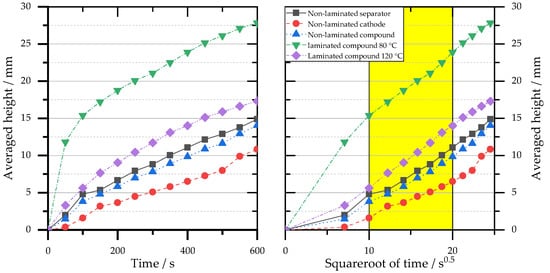 Figure 2. Results of optical measurement of the cathode separator measurement series (i) to (iii). Data points of the time course of mean wetting heights (left) and transformed mean heights with evaluation ranges from 10 to 20 s0.5 (right).The h-t0.5 graph is shown in the right image of Figure 2. Here, in the same way as with the gravimetric measurement, the wetting rate k [mm/s0.5] can be determined in the linear range (10–20 s0.5). The quantitative evaluation with the wetting rate k as well as with the mean heights at different times is plotted in Table 2. The materials of the non-laminated sample show different wetting rates, with the separator always wetting faster than the cathode. A comparison of the averaged non-laminated sample riser height with the two laminated samples again indicates that the laminated samples have a superior wetting rate. Thus, also based on the results of the optical observation, it can be concluded that lamination has a positive effect on the wetting property of the samples. Between the different lamination variants, a significantly higher wetting rate is shown at a temperature of 80 °C compared to the samples laminated at 120 °C.Table 2.Average heights at three time-points and evaluated parameters wetting rate k for the cathode separator measurement series (i) to (iii).
Material Avg. Height at t = 100 s
[mm]Avg. Height at t = 300 s
[mm]Avg. Height at t = 600 s
[mm]Wetting Rate k
[mm/s0.5]4.82 8.81 14.89 6.48 × 10 −1 Non-laminated cathode 1.58 5.06 10.81 4.67 × 10⁻¹ Non-laminated compound 3.82 7.80 14.04 6.09 × 10⁻¹ Laminated compound 80 °C 15.42 21.05 27.81 8.27 × 10⁻¹ Laminated compound 120 °C 5.62 11.70 17.30 3.83 × 10⁻¹ Figure 3 illustrates for five concise time points the images taken by the camera showing the wetting fronts. For the non-laminated sample, the different wetting fronts for the separator and cathode are drawn. While only a light gray tone was visible with the separator wetting, a deep gray tone was seen with additional wetting of the cathode. A distinction between the two wetting fronts could not be determined for the laminated samples. However, the samples with a lamination temperature of 80 °C showed uneven wetting between separator/cathode areas over the entire surface. Despite a similar wetting rate k, the sample laminated at 80 °C shows a significantly higher absolute slope height than the sample laminated at 120 °C. Thus, the sample laminated at 120 °C shows a higher absolute slope height. This is due in particular to the wetting within the 100 s. In particular, the u- or v-shape of the wetting front stands out in the images. At the side edges of the specimen holder, where the glass plates and electrode-separator assemblies come into contact with the sample holder, the wetting front is particularly pronounced. This can be observed with all sample specimens. In the narrow gap between the sample holder and the glass plates, an additional wetting front is formed due to the capillary forces. Because of the small gap, this force is significantly greater than the wetting by the materials themselves, which is why there is a tendency for lateral wetting results. However, since across all experiments the measurements were performed under identical conditions, the lateral wetting tendency does not affect the validity of the inferred results regarding the positive effect of lamination on wetting. As expected, the same qualitative test results with regard to the wetting fronts were obtained for the test series of the anode (iv–v) and the compartment (vi–vii), see Appendix A Figure A3 and Figure A4.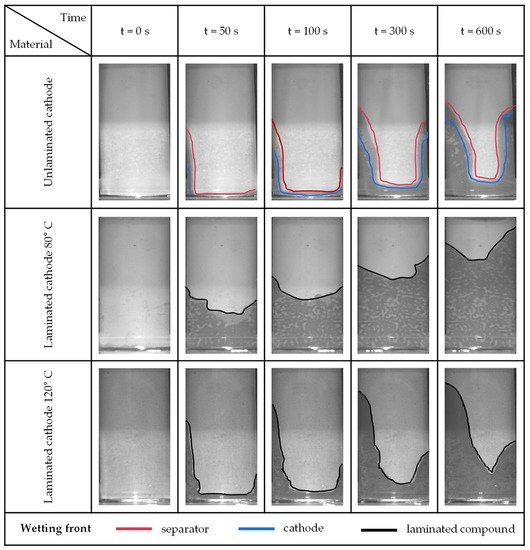 Figure 3. Images of the optical measurement of the cathode separator measurement series at four time points. The shape and height of the wetted visible surface are shown. Start of the measurement at t = 0 s.
5. Conclusions
Three different measurement methods for evaluating the wetting behavior were compared to each other to determine the advantages and limitations of each measurement method. Both the macroscopic measuring methods (optical and gravimetrical) and the microscopic measuring method (electrochemical) can be used to determine the wetting rate and wetting time, respectively. Moreover, the result shows that the lamination of separator and electrode significantly improves the wetting behavior of an electrode-separator assembly, and consequently, lamination is a promising process step for battery cell production to reduce wetting time and thus process-related storage times.
References
- Mohammadi, F. Lithium-ion Battery Market Analysis for Hybrid, Plug-in and Solar-Powered Electric Vehicles. J. Solar Energy Res. 2019, 4, 23–29.
- Kwade, A.; Haselrieder, W.; Leithoff, R.; Modlinger, A.; Dietrich, F.; Droeder, K. Current status and challenges for automotive battery production technologies. Nat. Energy 2018, 3, 290–300.
- Wood, D.L., III; Li, J.; Daniel, C. Prospects for reducing the processing cost of lithium ion batteries. J. Power Sources 2015, 275, 234–242.
- Lithium-Ion Batteries: Basics and Applications; Korthauer, R. (Ed.) Springer: Berlin/Heidelberg, Germany, 2018; ISBN 9783662530719.
- Wu, M.-S.; Liao, T.-L.; Wang, Y.-Y.; Wan, C.-C. Assessment of the wettability of porous electrodes for lithium-ion batteries. J. Appl. Electrochem. 2004, 34, 797–805.
- Günter, F.J.; Habedank, J.B.; Schreiner, D.; Neuwirth, T.; Gilles, R.; Reinhart, G. Introduction to Electrochemical Impedance Spectroscopy as a Measurement Method for the Wetting Degree of Lithium-Ion Cells. J. Electrochem. Soc. 2018, 165, A3249–A3256.
- Schilling, A. Design of an automated system to accelerate the electrolyte distribution in lithium-ion batteries. Int. J. Mech. Eng. Robot. Res. 2018, 162–166.
- Sheng, Y.; Fell, C.R.; Son, Y.K.; Metz, B.M.; Jiang, J.; Church, B.C. Effect of calendering on electrode wettability in lithium-ion batteries. Front. Energy Res. 2014, 2, 2.
- Liu, M.; Zhang, P.; Gou, L.; Hou, Z.; Huang, B. Enhancement on the thermostability and wettability of lithium-ion batteries separator via surface chemical modification. Mater. Lett. 2017, 208, 98–101.
- Suharto, Y.; Lee, Y.; Yu, J.-S.; Choi, W.; Kim, K.J. Microporous ceramic coated separators with superior wettability for enhancing the electrochemical performance of sodium-ion batteries. J. Power Sources 2018, 376, 184–190.
- Schilling, A.; Wiemers-Meyer, S.; Winkler, V.; Nowak, S.; Hoppe, B.; Heimes, H.H.; Dröder, K.; Winter, M. Influence of Separator Material on Infiltration Rate and Wetting Behavior of Lithium-Ion Batteries. Energy Technol. 2020, 8, 1900078.
- Knoche, T.; Reinhart, G. Electrolyte Filling of Large-Scale Lithium-Ion Batteries: Challenges for Production Technology and Possible Approaches. Appl. Mech. Mater. 2015, 794, 11–18.
- Leithoff, R.; Dilger, N.; Duckhorn, F.; Blume, S.; Lembcke, D.; Tschöpe, C.; Herrmann, C.; Dröder, K. Inline monitoring of battery electrode lamination processes based on acoustic measurements. Batteries 2021, 7, 19.
- Frankenberger, M.; Trunk, M.; Seidlmayer, S.; Dinter, A.; Dittloff, J.; Werner, L.; Gernhäuser, R.; Revay, Z.; Märkisch, B.; Gilles, R.; et al. SEI Growth impacts of lamination, formation and cycling in lithium ion batteries. Batteries 2020, 6, 21.
More