Humanity’s overreliance on fossil fuels for chemical and energy production has resulted in uncontrollable carbon emissions that have warranted widespread concern regarding global warming. To address this issue, there is a growing body of research on renewable resources such as biomass, of which cellulose is the most abundant type. In particular, the electrochemical reforming of biomass is especially promising, as it allows greater control over valorization processes and requires milder conditions. Driven by renewable electricity, electroreforming of biomass can be green and sustainable. Moreover, green hydrogen generation can be coupled to anodic biomass electroforming, which has attracted ever-increasing attention.
1. Introduction
Climate change is arguably humanity’s greatest challenge today. In 2019, an Intergovernmental Panel on Climate Change (IPCC) special report established several conditions required to restrict global temperature rise to 1.5 °C above pre-industrial levels. By 2030, carbon emissions would need to be halved, and by 2050, the net carbon released into the atmosphere must be zero
[1]. Worryingly, according to IPCC’s 6th assessment report
[2], Earth is perilously close to breaching the 1.5 °C goal by 2030. Limiting temperature rise will require extensive effort, but inaction could result in sea level rise of 180 cm by 2100, resulting in damages to the tune of USD 27 trillion per year
[3]. With additional temperature rise, considerable increases in heat-related mortality can be expected, with warmer and poorer regions experiencing a disproportionate burden
[4]. Consequently, water stress and food shortages could increase in frequency and severity
[5][6][5,6]. The window for intervening is open but rapidly dwindling
[7].
Replacing the burning of fossil fuels as our main energy source will be crucial. The solid and gaseous wastes humankind produces from the consumption of plants (biomass) go into the environment as carbon. The carbon in the air and soil is utilized by plants and turned into biomass and fuel. In this carbon cycle, biomass provides a renewable fuel. The utilization of such biodegradable waste can produce fuel resources and energy which does not result in as much carbon emissions as burning fossil fuel does. The annual biomass production in nature is estimated to be equivalent to 108 billion tons of oil, which is about ten times the world’s energy consumption
[8][9][8,9]. With a potential 200 billion tons of yield yearly, lignocellulosic biomass is the most abundant kind of natural biomass
[10]. It consists primarily of cellulose, which constitutes between 30% and 50% of lignocellulosic biomass
[11][12][13][11,12,13]. Cellulose is a crystalline biopolymer, constructed from long chains of D-glucose monomers, and has been isolated from plant matter and studied since the 17th century
[14]. However, it was only in recent years that investigations into the valorization of cellulose feedstock became popular because of the growing awareness of green chemistry
[15]. More importantly, cellulose is viewed as the significant feedstock component, as it does not compete with dietary sources, for example, edible crops for traditional biofuel production
[16]. Methods to reform raw biomass, however, need to overcome cellulose’s recalcitrance. Strong β-1-4-glycosidic linkages between glucose monomers lead to low reactivity, and the network of inter and intramolecular hydrogen bonding between long chains impedes dissolution in chemical solvents.
Several methods have been developed to break down cellulose, including hydrothermal processes
[17], chemical hydrolysis
[18], and biological treatments
[19]. Hydrothermal processes generally use hot compressed water as the reaction medium to liquefy biomasses, and valuable products such as bio-oils are extracted through organic solvents
[20]. Chemical catalysts are similarly employed to depolymerize cellulose, either in an acidic
[21] or an alkaline medium
[22]. Ethanol is the most common end product from biological treatments and is produced in two steps: cellulase enzymes initially catalyze the hydrolysis of cellulose into short chain sugars, which are then fermented into ethanol using yeasts or bacteria
[23]. Each method has its unique benefits and drawbacks in terms of time required, capital costs, chemicals consumed, and control over quality and distribution of products
[24][25][24,25].
Electrochemistry represents an effective tool in many important applications. For instance, in wastewater treatment by removal of organic pollutants or drugs (such as antibiotic waste tetracycline hydrochloride) from wastewater
[26][27][26,27]. In addition, it also represents a promising tool in the valorization of cellulose thanks to its green and sustainable features, as illustrated in
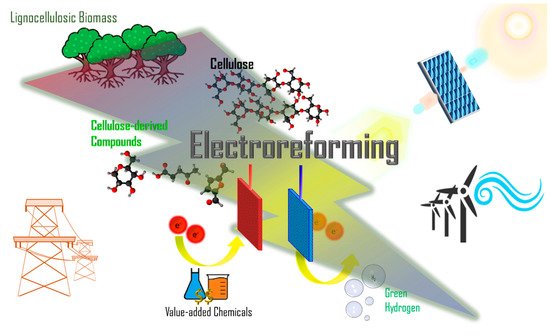
Figure 1. Through applying a potential difference across two electrodes, chemical reactions can be driven, with oxidation occurring at the anode (positive electrode) and reduction at the cathode (negative electrode). Two types of desired products—valorized chemicals on the anode and hydrogen gas on the cathode—can be obtained via cellulose electroreforming
[28]. Depolymerization and oxidation of cellulose at the anode can produce valuable chemical products, which could reduce reliance on traditional fossil fuel-based and resource-intensive methods of production. Moreover, research on green hydrogen as a fuel source is receiving much attention because combusting hydrogen does not produce pollutants or greenhouse gases, and hydrogen has a high specific energy density
[29][30][29,30]. Cellulose electroreforming requires catalysts, which can be homogeneous (dispersed in solution) or heterogeneous (often anchored on electrode). In most cases, the electrolyte is generated by dissolving cellulose in sodium hydroxide (NaOH) via the freeze–thaw method first reported in 1998
[31]. Dissolution allows for greater access to active sites on β-1-4-glycosidic linkages
[32]. When these linkages are fully broken, cellulose can be depolymerized into its monomer, glucose.
Figure 1. Schematic of biomass electroreforming. The most abundant lignocellulosic biomass is taken as an example. Electroreforming of the major component of lignocellulosic biomass, cellulose, or its derivatives, could offer value-added chemicals and green hydrogen fuel. Electroreforming can be powered by electricity from the grid or renewables, which makes it a promising method of renewable energy storage and green chemistry for a sustainable future.
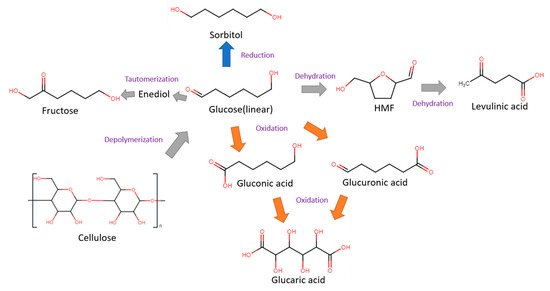
Glucose is a simple monosaccharide with molecular formula C6H12O6, and is the main source of energy for most life forms on earth. Apart from cellulose, glucose can also be stored in other polymeric forms, such as starch in plants or glycogen in animals. Glucose can be electrochemically converted to gluconic, glucaric and levulinic acids, as well as 5-HMF. These products can be further valorized into other valuable compounds through electrochemical oxidation (anodic reaction) or hydrogenation (cathodic reaction). Some common glucose transformations are shown in Figure 2.
Figure 2. Cellulose, glucose and its derivatives.
2. Electroreforming of Biomass at the Anode
2.1. Cellulose
Cellulose monomers comprise two anhydroglucose rings of C
5H
10O
5. The rings share an ether (C-O-C) bond between carbon-1 of a glucose ring and carbon-4 of the other, also known as a β-1-4-glycosidic bond. Additionally, intramolecular hydrogen bonding between the hydroxyl group and oxygen on adjacent glucose rings straightens and stabilizes cellulose chains. Intermolecular hydrogen bonding between adjoining cellulose chains also promotes stability and forms crystalline structure
[33]. Cellulose exists in four polymorphic varieties: I, II, III and VI. Cellulose I will be focused on here, since it is the natural cellulose found in plant matter, and can be used to form other polymorphs.
The earliest study passing electricity through cellulose was reported in 1947. O’Sullivan investigated passing current through regenerated cellulose with varying salt and moisture contents to understand the conductance properties of cellulose. In 1963, Murphy performed the first electrolysis of cellulose and observed that hydrogen gas was produced at the anode. However, studies of cellulose electrolysis remained relatively scarce and sporadic until the 21st century, when ever-increasing demand for green and sustainable chemistry appeared.
In 2010, Sugano et al. performed electrooxidation of cellulose at a polycrystalline gold (Au) electrode at a pH of 14 to understand its mechanism
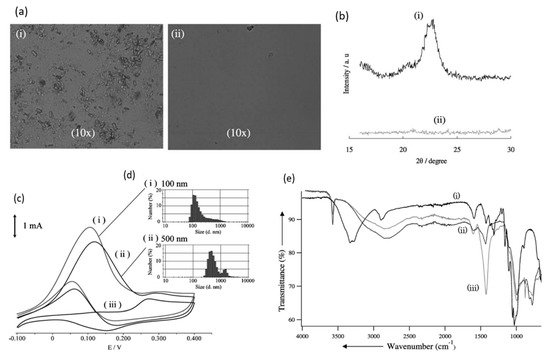
[34]. Cellulose powder was first dissolved in NaOH using the freeze–thaw technique, after which the cellulose’s structure was no longer crystalline, suggesting the breakage of intra- and intermolecular hydrogen bonding, which is verified by both microscopic images and X-ray diffraction (XRD) spectroscopy, as presented in
Figure 3a,b, respectively. Cyclic voltammetry (CV) revealed two oxidation peaks for dissolved cellulose but not for undissolved cellulose. To explore the effects of particle sizes, ball mill crushing was used to generate cellulose particles of two size ranges, 500 and 100 nm, as shown in
Figure 3c,d. Smaller particles led to 13% higher peak current at similar applied potentials, indicating that ball mill pretreatment was efficient in promoting the dissolution of cellulose. Fourier transform infrared imaging (FTIR) scans (
Figure 3e) suggested the formation of carboxyl groups, confirming the oxidation of cellulose. To produce direct electricity from oxidation of cellulose nanoparticles, the fuel cell was created and could attain maximum power density of 44 mW/m
2.
Figure 3. (
a) Microscopic images before (i) and after (ii) dissolution. (
b) X-ray diffraction of cellulose before (i) and after (ii) dissolution. (
c) cyclic voltammogram (vs. Ag/AgCl) of cellulose ball milled to average particle size of 100 nm (i), 500 nm (ii) and without cellulose (iii). (
d) size distribution after ball milling to 100 nm (i) and 500 nm (ii). (
e) FTIR scans of cellulose before dissolution (i), after dissolution (ii) and after oxidation (iii). Reprinted with permission from Ref.
[34]. Copyright 2010, Electroanalysis.
Later, their team studied the electroreforming mechanism in a similar alkaline medium
[35]. CV scans suggested that cellulose electrooxidation is irreversible and diffusion-controlled. FTIR was conducted during CV to understand interactions between cellulose and the Au electrode, which suggests that the adsorbed cellulose displaces OH
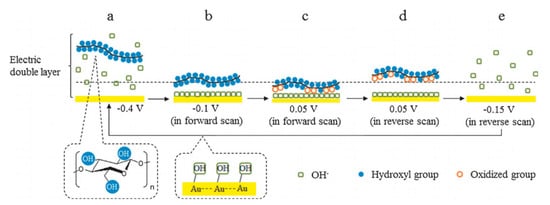
− ions near the electrode surface; and during oxidation, the strength of intermolecular H bonds decreases while that of intramolecular bonds increases. The authors proposed the reaction pathway, as illustrated in
Figure 4. Firstly, OH
− ions adsorb onto the surface of gold electrodes to form OH-Au sites. These active sites then allow cellulose to adhere electrochemically with Au electrode surface. Cellulose is oxidized and remains adsorbed until reversed potential is applied. The authors hypothesized that the adsorption and desorption of OH
− ions play an important catalytic role in cellulose electrooxidation. Nuclear magnetic resonance (NMR) spectra and scanning electron microscope (SEM) imaging suggested the differences in the structure of cellulose after electroreforming; however, the exact products were not identified.
Figure 4. Proposed cellulose oxidation mechanism on electrode surface in alkali media in CV cycle. (
a) initial state, with cellulose dissolved in alkali solution. (
b) in forward scan region: adsorption of OH
− ions to surface of electrode, cellulose molecule approaches OH-Au active sites. (
c) oxidation of cellulose at electrode. (
d) in reverse scan region: desorption of oxidation product and further oxidation of cellulose at revealed electrode surface. (
e) desorption of OH
− ions from electrode surface. Reprinted with permission from Ref.
[35]. Copyright 2014, ChemSusChem.
A notable investigation was conducted in 2016, when Xiao and coworkers reported the use of gold nanoparticles (AuNP) for cellulose electroreforming
[36]. Motivated by similar works on cellobiose
[37][38][37,38], the authors explored the use of nitric acid (HNO
3)-pretreated carbon aerogel with AuNP as an anode, as shown in
Figure 5. Carbon aerogel was fabricated as per a previous report
[39], before acid pretreatment. A mixture containing Au precipitates was prepared by reacting HAuCl
4 and NaB
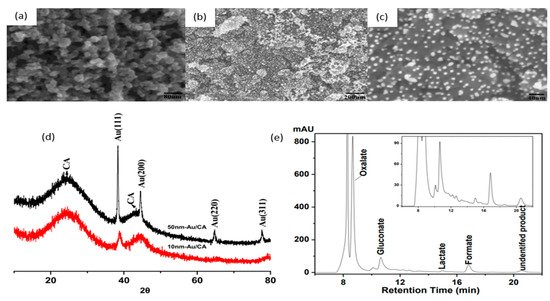
4 [40]. Deposition of AuNP onto carbon aerogel was performed by repeatedly dipping aerogel into the mixture and drying it. The anode was used to oxidize cellulose in 0.125 M NaOH (pH of 13.1) with insufflated air. Introduction of oxygen was proposed to speed up the formation of active oxygen species to accelerate oxidation. The authors compared three anodes to study the activities of AuNP with different sizes: 50 nm gold particles on graphite, 50 nm gold particles on carbon aerogel, and 10 nm gold particles on carbon aerogel, as shown in
Figure 5a–c. AuNP sizes were calculated from XRD data (
Figure 5d) and supported by SEM measurements. Cellulose oxidation was controlled at 10 mA/cm
2 and products were evaluated with high-performance liquid chromatography (HPLC), as presented in
Figure 5e.
Figure 5. (
a) SEM image of pretreated CA. (
b) SEM of 10 nm Au/CA. (
c) Magnified SEM of 10 nm Au/CA. (
d) XRD results of 10 nm Au/CA and 50 nm Au/CA electrodes. (
e) High performance liquid chromatography results of products using 10 nm Au/CA electrodes. Reprinted with permission from Ref.
[36]. Copyright 2015, Catalysis.
Comparing anodes consisting of 10 and 50 nm AuNP on the same supporting substrate (CA), one can see that the 50 nm NP anode also obtained high cellulose conversion, but selectivity towards gluconate was significantly lower, suggesting that the size of AuNP influences the selectivity of oxidation products. Reducing aeration did not change oxidation products but decreased the rate of reaction. Ten-nanometer gold particles on acid-pretreated carbon aerogel produced gluconic acid at a 67.8% yield with a conversion yield of at least 88.9%.
When comparing anodes with the same 10 nm gold particles on different supporting substrates, the pretreated carbon aerogel supports resulted in better cellulose conversion than that of graphite support. The authors hypothesized that acid pretreatment of CA led to a higher surface area and oxidized surface carbon, favoring the adsorption of cellulose molecules.
Sugano et al. also attempted to understand cellulose electroreforming mechanism using AuNPs, again in alkaline (pH of 14) conditions
[41]. Carbon paper supports were loaded with AuNPs through the chemical precipitation-deposition method. The electrodes were then calcinated at different temperatures (40, 250, and 350 °C). The author observed that calcination at 40 °C led to the formation of Au
+ (52.5%) and Au
3+ (30%), while calcinations at higher temperature led to completely metallic AuNPs. Moreover, calcination at 250 °C produced AuNPs with sizes ranging in a narrow band (10–25 nm), whereas a further increased temperature of 350 °C resulted in larger clusters (20–30 nm). CVs were conducted with 1.3 M NaOH against a Ag/AgCl reference, with and without (1 wt%) cellulose present. Anode calcinated at 40 °C displayed no electrocatalytic activity. Moreover, the anode calcinated at 350 °C shows lower electrocatalytic activity than the anode calcinated at 250
°C, indicating that small AuNPs (<25 nm) have higher activity.
Meng et al. electrolyzed cellulose powder in 0.5 M sulfuric acid (pH of 0.3), rather than in alkali solution, using lead/lead dioxide (Pb/PbO
2) electrodes
[42], as depicted in
Figure 6a. Under ambient conditions, with a controlled current density of 30 mA/cm
2 for 8 h, the degree of polymerization (DP) at average decreased from 1100 to 367. Conversely, the sample that was exposed only to acid had a final DP of 840, as displayed in
Figure 6b,c. XRD measurement showed a reduced degree of crystallinity, while FTIR showed lower intensities associated with H and C-O-C bonds without the formation of new groups. A maximum soluble sugar content yield of 2.5% and the highest 5-HMF yield of 1.8% were obtained.
Figure 6. (
a) CVs (vs. SCE) of 0.5 M sulfuric acid (i) and 0.5 M sulfuric acid with 10 g/L cellulose (ii). (
b) Decrease in DP over time at 30 mA/cm
2. (
c) Decrease in DP over time without applied current. Reprinted with permission from Ref.
[42]. Copyright 2011, Polymer Degradation and Stability.
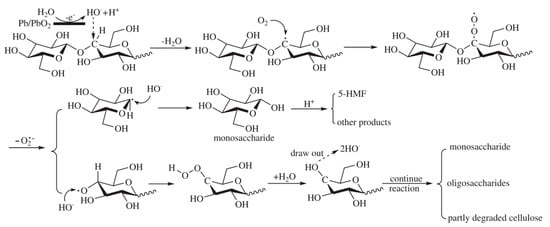
Meng and coworkers proposed an electrocatalytic depolymerization process, as presented in Figure 7. Firstly, water molecules lose electrons at the anode to form hydroxyl radicals (OH−). Next, the OH− attacks the C-H bond and removes the hydrogen atom from carbon-4 of the glucose unit, leaving a carbon radical (C−) in cellulose. C− is then oxidized to become a superoxide radical (O−2). Finally, the glycosidic bond is cleaved through the removal of the superoxide radical.
Figure 7. Proposed cellulose depolymerization mechanism in acidic media. Reprinted with permission from Ref.
[42]. Copyright 2011, Polymer Degradation and Stability.
2.2. Glucose
Glucose is the most abundant monosaccharide on Earth
[43]. Electrolysis of glucose was reported as early as 1866 to produce acetaldehyde; early reports also speculated on the possible formation of alcohol and many other substances
[44]. Indeed, studies have revealed a variety of useful products from glucose electroreforming, including 5-HMF, gluconic acid, glucaric acid, gluconolactone and levulinic acid, among others. The synthesis of glucaric acid in particular has been widely acknowledged for its high value. With applications in many industries, glucaric acid has being listed as one of the most value-added chemicals by the US Department of Energy
[45][46][47][45,46,47]. However, conventional methods for glucaric acid production often require intense pressures, temperatures and harsh chemicals
[48]. Gluconic acid is an intermediate towards the production of glucaric acid, and by itself has other commercial applications
[49][50][49,50]. Levulinic acid and 5-HMF are platform compounds for producing other useful chemicals
[51][52][53][51,52,53].
In 2014, Bin et al. optimized conversion of glucose to glucaric and gluconic acids with nano-manganese dioxide (MnO
2) loaded tubular porous titanium (Ti) electrodes in a flow-through electrolytic cell, as shown in
Figure 8a,b
[54]. Interestingly, unlike most other studies, pH was concluded to be less significant in this case—increasing pH from 2 to 10 only changed glucose conversion slightly, from 90% to 93%. Selectivity to gluconic acid (GLA) and glucaric acid (GA) rose from 87% at a pH of 2 to a maximum of 94% at a pH of 7, before decreasing to 78% at pH 10. The flow-through cell (
Figure 8b) was believed to limit the expansion of the electrochemical diffusion layer and promote glucose access to anode surface by convection. The effects of current density on glucose conversion to product selectivity were also studied (
Figure 8c). With MnO
2 loading of 4.98%, glucose concentration of 50.5 mM, temperature of 30 °C, pH of 7, residence time of 19 min, and current density of 4 mA/cm
2, 98% glucose conversion was achieved with selectivity towards gluconic acid and glucaric acid of 43% and 55%, respectively. Increasing current density to 6 mA/cm
2 further led to 99% glucose conversion, with gluconic and glucaric selectivities of 15% and 84%, respectively.
Figure 8. Nano MnO
2/Ti electrocatalysts in flow-through cells for glucaric acid (GA) and gluconic acid (GLA) production from glucose. (
a) SEM image of 5% MnO
2/Ti electrode. (
b) Schematic diagram of electrocatalytic flow reactor system. (
c) Products at different current densities (under 5% MnO
2 loading, glucose concentration of 50.5 mmol/L, pH of 7, 30 °C, 19 min). Reprinted with permission from Ref.
[54]. Copyright 2014, Electrochimica Acta.
In 2017, Solmi et al. investigated the effects of varying ratios of different reactants (glucose to NaOH, glucose to metal catalyst, and glucose concentration levels), temperature and pressure, on glucose conversion to glucaric acid
[55]. Under optimal conditions using AuNPs on activated carbon support, the highest yields of glucaric acid, gluconic acid and other by-products attained were 31%, 18% and 40%, respectively. The authors proposed that the optimal glucose concentration was 5% and that the molar ratio of glucose to metal should be 500:1 for obtaining glucaric acid.
Moggia et al. compared electrooxidative performance of bare copper (Cu), platinum (Pt) and Au at varying potentials for different functional groups
[56]. The researchers first compared CVs of 0.04 M glucose added to 0.1 M sodium hydroxide with Cu, Pt and Au electrodes, and concluded that glucose oxidation is strongly correlated with metal catalysts. Next, gluconic acid, glucuronic acid and glucaric acid were used to identify if different functional groups are oxidized by metal catalysts. Cu was found to selectively oxidize glucose aldehyde group at 0.8–1.2 V, but not the hydroxymethyl group. Pt oxidized hydroxymethyl groups at lower potentials and aldehyde groups at higher potentials, while Au oxidized hydroxymethyl at higher potentials and aldehydes at lower ones. Finally, to minimize competing side reactions (glucose isomerization and sugar degradation
[57]) the authors performed glucose electroreforming at 5 °C at pH 13 for all three metal catalysts. Although good selectivity to glucaric acid was observed at lower potential (38.4% at 0.86 V), current densities with Cu were too low. Increasing potentials resulted in formic acid as the major product. Pt and Au exhibited similar catalytic action: at low potentials (0.55–0.70 V), both exhibited high selectivity to gluconic acid (78.4–86.8%). Increasing potential to 1.34 V for Pt and prolonged electrolysis at 0.70 V for Au produced glucaric acid selectivities of 13.5% and 12.6%, respectively.
Moggia and co-workers then went on to optimize conditions for each of the two oxidation steps at Au anodes: (1) glucose to gluconic acid, and (2) gluconic acid to glucaric acid
[58]. For the first step, pH, glucose concentration, and temperature were all found to influence conversion. Optimal parameters of pH of 11.3, glucose concentration of 0.04 M, temperature of 5 °C and potential of 0.6 V resulted in the highest gluconic acid selectivity of 97.6%, with glucose conversion of 25% across a 6 h reaction. Increasing conversion by elevating pH or temperature produced lower selectivity. Increasing glucose concentration likely affected mass transfer to Au active sites, which also reduced selectivity. On the other hand, none of the above parameters were significant for oxidizing gluconic acid to glucaric acid. Instead, applied potential considerably influenced the product distribution. As illustrated, the maximum selectivity of 89.5% was attained at 1.1 V vs. RHE. Unfortunately, gluconic acid conversion was low (4.6%). Nevertheless, the highest possible glucaric acid concentration obtained was 1.2 mM. Furthermore, the drastic drop in current density was observed after a few hours, likely due to the adsorption of glucaric acids at Au active sites, as reported previously
[59].
Liu et al. used both nanostructured bimetallic nickel-iron oxide (NiFeO
x) and nitride (NiFeN
x) electrodes for gluconic and glucaric acid production
[60]. NiFeO
x nickel foam (anode) was used in 0.5 M glucose and 1 M potassium hydroxide, while NiFeN
x nickel foam was used as the cathode in 1 M KOH. At a constant applied voltage of 1.4 V, glucose conversion of 21.3% was attained, and glucaric acid and gluconic acid yields were 11.6% and 4.7%, respectively. The Faradaic efficiencies for both glucaric and gluconic acids were 87%. The current density at 1.4 V decreased from 101.2 to 97.8 mA/cm
2 over a 24 h run. The authors’ technoeconomic analysis suggests that this method produces glucaric acid at 54% lower cost compared to conventional production methods.
In 2021, Neha et al. created platinum-bismuth alloy (Pt
9-Bi
1) electrocatalyst on glassy carbon electrode for glucose conversion to gluconic acid, accompanied by methyl-glucoside conversion to methyl-glucuronate
[61]. In an electrolyte consisting of 0.1 M NaOH (0.1 M glucose added), linear sweep voltammetry (LSV) scans showed the onset voltage to be less than 0.06 V and a broad peak at 4.58 mA/cm
2 around 0.6 to 0.8 V. Chronoamperometric measurement at a fixed potential of 0.3 V was conducted with Pt
9-Bi
1/C anode and Pt/C cathode for 6 h, in a filter press cell. After about 90 min, the current halved (~0.020 to 0.010 A) and plateaued at around 0.005 A. These readings suggest that some poisoning occurred. The product after a 6 h reaction was confirmed to be gluconate with 100% selectivity using HPLC and NMR, with 40% glucose conversion.
Poisoning of electrodes is a significant challenge in scaling up glucose electroreforming, suspected to be caused by the action of reaction intermediates
[62]. In 2005, Tominaga et al. compared glucose electrooxidation between pure Au plate and AuNPs (2 nm in diameter) on carbon electrode
[59], as shown in
Figure 9a. While CV scans suggested a similar voltametric response, gold nanoparticle catalysts exhibited significantly smaller decreases in current over time, displaying better resistance to poisoning, as displayed in
Figure 9b. The reduction in current density was mitigated by increasing pH. Additionally, Tominaga et al. identified that high selectivity towards gluconate can be obtained at a high pH of 13.7, while electroreforming at neutral conditions (pH of 7) produced a mixture of gluconate and oxalate. Similarly, applied potential can be another factor to influence products, as seen in
Figure 9c. Most later studies have therefore focused on employing nanoparticle electrocatalysts in alkali media.
Figure 9. (
a) TEM image of AuNP capped with decanethiolate monolayer shell (for deposition on electrode). (
b) Change in current ratios across time with gold nanoparticles in alkali medium (i), bulk gold in alkali medium (ii), gold nanoparticles in neutral medium (iii), and bulk gold in neutral medium (iv). (
c) Plots of electrolysis products with 2 nm AuNP in 0.1 M NaOH, 0.01 M glucose, at different potentials (vs. Ag/AgCl); total current efficiency of all products (i), gluconolactone (ii), oxalate (iii), glyconate (iv), formate (v). Reprinted with permission from Ref.
[59]. Copyright 2005, Electrochemistry Communications.
2.3. 5-Hydroxylmethylfurfural
5-hydroxylmethylfurfural (5-HMF) was included in a 2010 revision of the US Department of Energy’s list for most valuable chemicals due to its versatility in forming a wide range of useful chemicals. In particular, one of its products, 2,5-furandicarboxylic acid (FDCA), has been widely acknowledged for its potential to replace polyethylene terephthalate (PET) in plastic production with comparable mechanical strength and superior cost savings
[63][64][65][63,64,65]. The recent advances in anodic electroreforming of 5-HMF will be discussed in this section.
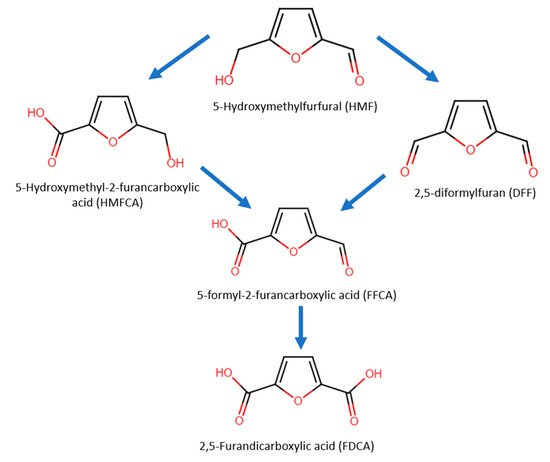
In 5-HMF oxidation, either the alcohol group or aldehyde group can be oxidized first, forming the intermediates 2,5-diformylfuran (DFF) or 5-hydroxymethyl-2-furancarboxylic acid (HMFCA), respectively (Figure 10). Next, the intermediates further undergo oxidization into 5-formyl-2-furancarboxylic acid (FFCA) and lastly into FDCA.
Figure 10. Oxidation pathways and products of 5-HMF.
In 2018, Liu et al. fabricated NiFe layered double hydroxide (LDH) nanosheets on carbon paper as electrocatalysts to electroreform 5-HMF to 2,5-furandicarboxylic acid (FDCA)
[66]. Upon adding 10 mM 5-HMF, LSV scans revealed onset potential at 1.25 V (vs. RHE) occurred earlier than the oxygen evolution reaction (OER) at 1.37 V for double layer capacitance, which further supported the suggestion that there is a greater electrochemically active area for 5-HMF oxidation than that for oxygen evolution. Among the LDH materials, including bimetallic nickel-aluminum (NiAl), nickel-gallium (NiGa), and Ni(OH)
2, NiFe displayed the best performance. Additional chronoamperometric tests at a potential of 1.33 V resulted in the best 5-HMF conversion of 98% and an FDCA yield of 98%, with Faradaic efficiency of 98.6% in 1 M potassium hydroxide electrolyte with 10 mM 5-HMF. When the concentration of 5-HMF was increased to 100 mM, good conversion, yield, as well as efficiency were still observed (all values >90%).
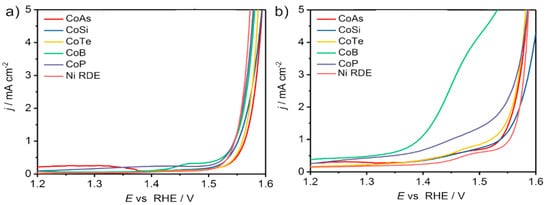
Weidner et al. investigated the electrooxidation of 5-HMF to FDCA with bimetallic cobalt-metalloid alloys to replace OER in water splitting
[67]. Among cobalt phosphide (CoP), cobalt boride (CoB), cobalt telluride (CoTe), dicobalt silicide (Co
2Si) and cobalt arsenide (CoAs), CoB had the highest current activity (2.69 mA/cm
2 at 1.45 V), where OER is negligible, and the lowest onset potential for 1 mA/cm
2 was 1.39 V, as displayed in
Figure 11a,b.
Figure 11. LSV scans of cobalt alloys in half cell in 1 M KOH, (
a) without the addition of 5-HMF (OER), and (
b) with the addition of 10 mM 5-HMF (5-HMF oxidation to FDCA). Reprinted with permission from Ref.
[67]. Copyright 2018, Beilstein Journal of Organic Chemistry.
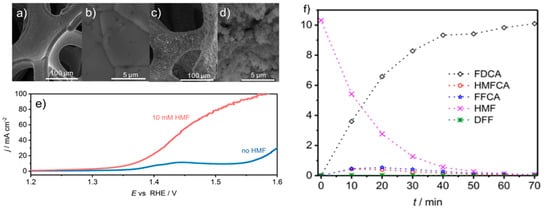
A flow reactor was then constructed with CoB-doped Ni foam as a positive electrode and Ni foam as a negative electrode, separated by anion exchange membrane. Figure 12 a,b show the smooth surface of the Ni foam, whereas Figure 12c,d reveal the rough appearance of the CoB-doped foam due to agglomerations of CoB after spray coating deposition. As illustrated in Figure 12e, the current density at anodic potential of 1.45 V was 55 mA/cm2 with additional 10 mM 5-HMF. Furthermore, by maintaining potential at 1.45 V, complete conversion of 5-HMF was realized. The FDCA yield attained was 94% and Faradaic efficiency was 98%, as seen in Figure 12f. Notably, the degradation of 5-HMF into humin-type structures, typically observed at high pH, was suppressed. Remarkably, the current density at the applied voltage (1.45 V) recorded at 55 mA/cm2, much lower than the 1.63 V required for the same current density at OER.
Figure 12. (
a,
b) SEM images of nickel foam before CoB deposition. (
c,
d) SEM of foam after CoB deposition. (
e) LSV in flow reactor with and without 5-HMF. (
f) Concentration against time for various products. Reprinted with permission from Ref.
[67]. Copyright 2018, Beilstein Journal of Organic Chemistry.
Suspecting that highly alkali conditions favor the degradation of 5-HMF into insoluble humin products, Nam et al. used an electrolyte with a pH of 13 (0.1 M KOH), rather than a pH of 14, for electroreforming 5-HMF to FDCA
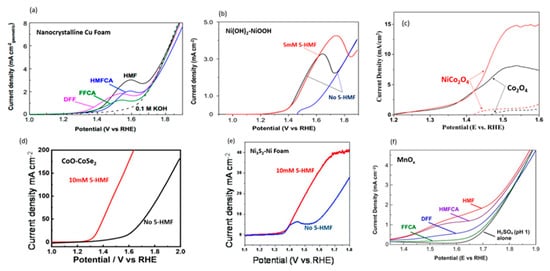
[68]. Nanocrystalline Cu foam was used as the electrocatalyst due to Cu’s high overpotential requirement for the competing reaction (i.e., oxygen evolution). LSV scans of 5-HMF and intermediates confirmed that complete conversion 5-HMF to FDCA can be accomplished without oxygen evolution, as shown in
Figure 13a. Anodic potential of 1.62 V with 0.1 mM 5-HMF at pH of 13 led to 99.9% of 5-HMF conversion, 96.4% of FDCA yield, and 95.3% of Faradaic efficiency. The authors also tested bulk Cu electrode, while maintaining high conversion (99.1%), achieving lower FDCA yield (80.8%) and Faradaic efficiency (79.9%). Although LSV scans indicated lower activity for bulk Cu, with a potential (at 1 mA/cm
2) of 1.58 V compared to 1.45 V for nanoparticle Cu, it was still significantly lower than the 1.8 V required for OER. From the product analysis, substantial amounts of FFCA were found, suggesting that oxidation of FFCA to FDCA was the rate limiting step.
Figure 13. Comparison of LSV graphs with different catalysts. (
a) LSV scans of 5 mM of 5-HMF and intermediates (solid lines) and without 5-HMF (dashed line) at a pH of 13 using nanocrystalline Cu foam. Reprinted with permission from Ref.
[68]. Copyright 2018, ACS Catalysis. (
b) LSV of Ni(OH)
2 catalysts without (blue and black lines) and with 5 mM 5-HMF (red line) at a pH of 13. Reprinted with permission from Ref.
[69]. Copyright 2019, ACS Catalysis. (
c) LSV of NiCo
2O
4 and Co
3O
4 catalysts without (dashed lines) and with (solid lines) 5 mM 5-HMF, at a pH of 13. Reprinted with permission from Ref.
[70]. Copyright 2019, Applied Catalysis B: Environmental. (
d) LSV of CoO-CoSe
2 electrocatalysts without (black line) and with (red line) 10 mM 5-HMF at a pH of 13. Reprinted with permission from Ref.
[71][72]. Copyright 2020, Green Chemistry. (
e) LSV of Ni
3S
2-Nickel foam without (black line) and with (red line) 10 mM 5-HMF at a pH of 13. Reprinted with permission from Ref.
[72][74]. Copyright 2021, Dalton Transactions. (
f) LSV of 20 mM 5-HMF and intermediates (colored lines) and without (black line) with MnO
x at a pH of 1. Reprinted with permission from Ref.
[73][75]. Copyright 2018, ChemSusChem.
3. Electroreforming of Biomass at the Cathode
In addition to oxidation at the anode, hydrogenation or reduction can also be conducted at the cathode of electrolytic cells. In hydrogenation, H+ ions in the solution are reduced to surface-bound atomic hydrogen. Oxygenated organic molecules can react with adsorbed hydrogen to form valuable products. This section details some case studies of electroreforming biomass-derived compounds via cathodic reactions.
3.1. Cellulose
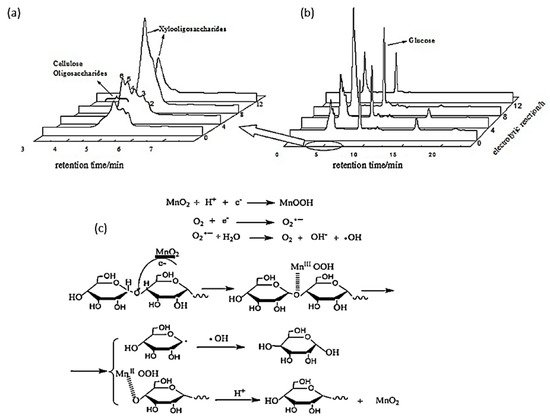
In 2014, Yang et al. investigated the electroreduction of cellulose oligosaccharides into glucose in acidic media
[74][90]. Short chain oligosaccharides were first produced via hydrothermal treatment with an acidic catalyst. The authors varied the pH, applied voltage, electrolysis duration, and electrode preparation to optimize glucose yield. With a 5% MnO
2/graphite/polytetrafluoroethylene (PTFE) cathode calcinated at 500 °C for 3 h, a glucose yield of 72.4% with 100% selectivity was reported under optimal electrolysis conditions (pH of 3, 8-h reaction duration, and potential of −0.58 V vs. RHE).
Figure 145a,b depicted the product analysis by HPLC before and after electroreforming.
Figure 145. (
a) HPLC of oligosaccharides after electrolysis. (
b) HPLC of products after hydrothermal treatment of cellulose. (
c) Proposed mechanism for cellulose oligosaccharide depolymerization with MnO
2 cathode. Reprinted with permission from Ref.
[74][90]. Copyright 2014, Journal of Industrial and Engineering Chemistry.
Similar to the electrooxidation mechanism with a gold electrode proposed by Sugano’s group
[35], Yang et al. hypothesized that cellulose would first adsorb onto the surface of a MnO
2/graphite/PTFE cathode, as shown in
Figure 145c. Mn (VI) (in MnO
2) would be reduced to Mn (III) (in MnOOH) after reaction with a H
+ ion and electron. Afterwards, MnOOH coordinates with oxygen in the glycosidic bond, depolymerizing the cellulose chain. Lastly, MnOOH is re-oxidized into MnO
2 in the acidic medium.
3.2. 5-Hydroxylmethylfurfural
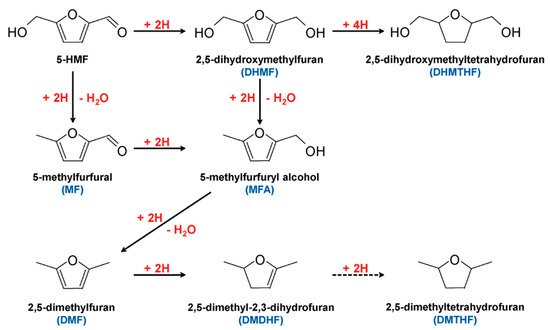
5-HMF can undergo hydrogenation to form valued products, as shown in
Figure 156. Products such as 2,5-dimethylfuran (DMF) are considered potential gasoline alternatives, due to their high carbon and energy density
[66][75][76][77][66,91,92,93]. 2,5-dihydroxymethylfuran (DHMF) is a platform chemical for polyester and polyurethane foam production
[78][94]. Conventional hydrogenation of 5-HMF often requires high temperatures and/or pressures, as well as hydrogen atmosphere
[79][95]. Electrochemical hydrogenation represents an attractive alternative to produce these chemicals without requiring harsh conditions.
Figure 156. Hydrogenation pathways of 5-HMF. Reprinted with permission from Ref.
[76][92]. Copyright 2015, ChemSusChem.
In 2013, Nilges and Schroder first demonstrated electrochemical hydrogenation of 5-HMF to DMF
[80][87]. At a constant 10 mA/cm
2 in a 0.5 M sulfuric acid electrolyte with Cu electrodes, the highest DMF selectivity of 35.6% was attained. As reaction proceeded, a significant decrease in Faradaic efficiency was observed alongside a decrease in 5-HMF concentration in the solution. The authors proposed that a flow reactor would allow for sparingly soluble DMF products to be continuously removed, therefore maintaining high Faradaic efficiencies for 5-HMF electroreforming.
Kwon et al. explored electrocatalytic hydrogenation of 5-HMF using different metal catalysts in neutral media (0.1 M sodium sulfate buffer, pH ~7.2) in the presence and absence of glucose
[75][91]. Based on the similar onset potentials (~−0.5 V) observed for all metals, they found that the rate of electrocatalytic hydrogenation is not strongly influenced by the catalyst. However, the choice of catalyst was found to influence hydrogenation pathway and products. Broadly, the metal catalysts used were classified into three groups depending on products obtained in neutral media. Firstly, Fe, Ni, silver (Ag), zinc (Zn), cadmium (Cd), and indium (In) formed DHMF as the major product. Secondly, hydrogenolysis products of 5-HMF were mainly formed on Co, Au, Cu, tin (Sn), and antimony (Sb). Finally, using palladium (Pd), Al, bismuth (Bi), and Pb could form either DHMF or other hydrogenolysis products by controlling the applied potential. Upon the addition of glucose, Zn, Cd, In, Fe, Ni, Ag, Co, and Au electrocatalysts favored the hydrogenation of 5-HMF into DHMF, while no such effects of initial glucose concentration on final product preference were observed using Bi, Pb, Sn or Sb.
Similarly, different metal electrocatalysts were tested in acidic media (0.5 M H
2SO
4, pH of 0.3)
[76][92], and classified into three groups according to major products. In acidic media, Fe, Ni, Cu, and Pb formed DHMF as the major product. 2,5-dimethyl- 2,3 dihydrofuran (DMDHF) was the major product using Pd, Pt, Al, Zn, In, and Sb. Using Co, Ag, Au, Cd, Sb, and Bi formed either DHMF or DMDHF as the major product by controlling the applied potential.
In 2019, Chadderdon et al. performed the paired electrocatalytic hydrogenation of 5-HMF at the cathode to produce 2,5-bis(hydroxymethyl)furan (BHMF)
[81][96]. The hydrogenation reaction was catalyzed by Ag nanoparticles on carbon support in 0.5 M borate buffer solution of pH 9.2. Electrooxidation of 5-HMF at the anode was performed with homogenous 4-acetamido-TEMPO catalysts. Pairing these anodic and cathodic electroreforming reactions achieved co-generation of valuable products.
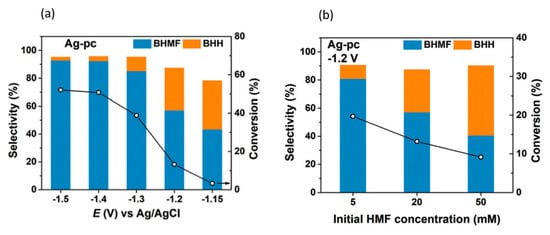
5-HMF hydrogenation products were found to be dependent on cathodic potential and 5-HMF concentration, as shown in Figure 167a,b. Increasing the potential or 5-HMF concentration shifted selectivity towards 5,5-bis(hydroxymethyl)hydro-furoin (BHH) rather than BHMF. At the optimum conditions of −0.46 V (vs. RHE) and a 5-HMF concentration of 5 mM, 5-HMF conversion reached 19.7%, while the selectivity and Faradaic efficiency of BHMF production were highest, at 80.9% and 89.3%, respectively.
Figure 167. (
a) Product selectivities at different cathodic potentials (vs. Ag/AgCl). (
b) Product selectivities at different 5-HMF concentrations. Reprinted with permission from Ref.
[81][96]. Copyright 2019, Green Chemistry.
Zhang et al. investigated acidic media for the electrocatalytic hydrogenation of 5-HMF into DMF
[82][97]. Specifically, a bimetallic CuNi electrode (composed of 82% Cu, 17% Ni and trace O
2) was synthesized. After that, LSV scans in 0.2 M sulfate buffer (pH of 2) were performed. The scans showed a considerable decrease in the magnitude of potential required for 5 mA/cm
2 when 2 g/L (15.9 mM) 5-HMF was added (−0.6 V vs. −0.36 V), suggesting good electrocatalytic activity for 5-HMF reduction. When the anodic potential of −0.46 V (vs. RHE) was maintained for 70 s, a maximum selectivity to DMF of 91.1% and a Faradaic efficiency of 84.6% were obtained. Under these conditions, however, the conversion of 5-HMF was low, at 37.8%.
In 2021, Liu et al. conducted electrocatalytic hydrogenation of 5-HMF with Ag foil and oxide-derived Ag (OD-Ag) electrodes
[83][98]. These reactions occurred in 0.5 M borate buffer at pH of 9.2 and 20 mM of 5-HMF.
Figure 178a,b demonstrates the electrolysis setup that was performed in an H-cell and the-electrode flow cell, respectively. At cathodic potential of −0.51 V (vs. RHE), 5-HMF conversion and selectivity to 2,5-bis(hydroxymethyl)furan (BHMF) were higher with OD-Ag electrocatalysts instead of Ag foil, and in the flow cell rather than the H-configuration cell. Consequently, this led to the highest 5-HMF conversion of almost 30%, and a selectivity to BHMF of 95.3% (
Figure 178c).
Figure 178. (
a) H cell diagram. (
b) Flow cell diagram. (
c) BMHF and 5,5-bis(hydroxymethyl)hydrofuroin (BHH) results from 5-HMF hydrogenation using Ag or OD-Ag, in H cell or flow cell. Reprinted with permission from Ref.
[83][98]. Copyright 2021, Green Chemistry.
Likewise, using OD-Ag in a flow cell, cathodic hydrogenation of 5-HMF into BHMF was coupled with TEMPO electromediated oxidation of 5-HMF into FDCA at a platinum anode. Overall, the cell energy efficiency of the flow cell was higher than the H-cell, i.e., 24.5% compared to 5.7%. The resultant selectivity to BHMF was consistently around 90%, accompanied by complete selectivity to FDCA.
3.3. Levulinic Acid
Combustion of biofuels could result in zero net carbon release into the atmosphere, representing a greener mode of energy production
[84][85][99,100]. For instance, one example of a biofuel is octane, which can be produced from levulinic acid. The traditional reforming of levulinic acids calls for elevated temperatures and pressures (250–400 °C and 10–35 bar), which require significant energy resources to sustain
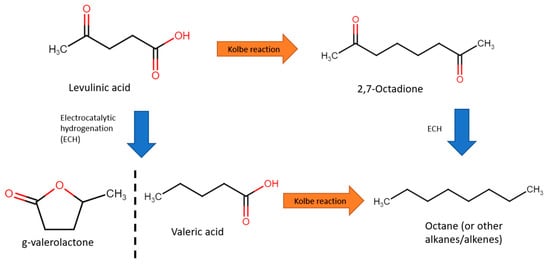
[86][87][88][101,102,103]. Electroreforming levulinic acid might be an attractive alternative for synthesising hydrocarbons for energy generation. This is usually performed at the cathode (reduction) under acidic media, and consists of two steps: the Kolbe reaction and electrocatalytic hydrogenation (ECH), as shown in
Figure 189. Several such studies will be explored in this section.
Figure 189. Reaction pathways from levulinic acid to octane.
In 2012, Nilges et al. first performed ECH of levulinic acid to valeric acid with lead cathode
[89][77]. Valeric acid was then converted to octane via the Kolbe reaction with a Pt cathode. Intially, ECH was performed in 0.5 M sulfuric acid (pH of 1) and 0.1 M levulinic acid at a fixed −1.405 V vs. RHE, with a current density of 20–40 mA/cm
2. With a Pb electrode, Faradaic efficiency of 27% and selectivity to valeric acid of 97.2% were achieved. Subsequently, for the Kolbe step, water and methanol as solvents were compared. Overall, water resulted in better activity, with 40–50 mA/cm
2 at 3.895 V, achieving selectivity of 51.6% and Faradaic efficiency of 66.5%. In addition, easier extraction of water insoluble products, of which, at 1 M valeric acid and pH of 5.5, 72% octane selectivity was achieved.
In 2013, Xin et al. studied the electroreforming of levulinic acid to valeric acid and g-valerolactone
[90][104]. Identical to valeric acid, g-valerolactone is an essential precursor to biofuel
[91][105] or can be blended into gasoline directly
[92][106]. The authors compared CVs of Cu and Pb electrodes at pH of 0, and found that the onset potential of Cu was of lower magnitude than that of Pb (−0.4 V vs. −1.1 V). However, upon adding 0.2 M levulinic acid, onset potential of Pb increased by 0.2 V while Cu displayed little change, suggesting that adsorption of levulinic acid on Cu was suppressed by fast hydrogen evolution reaction (HER). At low overpotentials (−1.1 V) with a Pb electrode, conversion of 1.2% and selectivities towards valeric acid and g-valerolactone of 81.5% and 18.5%, respectively, were attained. In contrast, higher overpotentials (−1.5 V) led to conversions of 20.3% with selectivity of 97% to valeric acid. Additionally, the effects of pH were studied by contrasting CVs in 0.5 M sulfuric acid (pH of 0) and phosphate buffer (pH of 7.5). In an acidic medium, this resulted in 94% selectivity to valeric acid with 12.7% conversion and 84% Faradaic efficiency. The opposite behavior in neutral medium was observed with 100% selectivity to g-valerolactone, although conversion and Faradaic efficiency were low (1.3% and 6.2%, respectively).
Xin’s and coworkers then constructed a flow cell for continual electrolysis with applied potential fixed at −1.3 V (Figure 1920a). When operating in the flow cell reactor, higher efficiencies and conversion were recorded accordingly in Figure 1920b,c. This was likely due to the high flow rate, which addressed the mass transport issues. Stability tests were conducted across a 20 h reaction with 0.2 M levulinic acid. Conversion rates were consistent and no Pb leaching was observed, although the efficiency of Faradaic processes decreased over time.
Figure 1920. (
a) Schematic of flow cell reactor. (
b) Comparison of conversion and (
c) Faradaic efficiencies of half-cell against flow cell reactor, at −1.3 V, 0.2 M levulinic acid, 0.5 M H
2SO
4, with Pb electrode. Reprinted with permission from Ref.
[90][104]. Copyright 2013, ChemSusChem.
