Citrus processing industry, one of the most important agro-industry, produces large volumes of wastewater (CPWW). The large variability of these volume is coupled to physico-chemical characteristics of CPWW. The qualitative and quantitative variability of CPWW are discussed and the severe constraints for its disposal are presented.
- Quantitative variability
- physico-chemical characteristics
- Citrus industry
- pH
- COD
- essential oils
- Nutrients
1. Production of Citrus-Processing Wastewater
The citrus-processing chain mainly consists of fruit temporary storage, washing, grading and sorting, juice extraction and finishing, heat treatment, and product packaging and storage. A detailed description of citrus-processing technologies is reported in Zema et al.[1] [12]. The citrus-processing operations produce CPWW as liquid residue of the following phases:
- Fruit washing by rotating brushes under a water spray (in the case of wax-coated fruits or excessive dirt or microbiological contamination) after removing leaves and prior to processing;
- Centrifugation of the water/oil slurry produced by spraying water on squeezed or cut peel (depending on the use of FMC or brown juice/oil extractors, respectively), in order to recover EO contained in the peel and flavedo[2]; this phase yields the largest volume of CPWW; [22]; this phase yields the largest volume of CPWW;
- Drying of the cut peel after lifting from a washing tank, to release the EO;
- Washing of the pulp discarded by juice extractors and finishers, to recover juice, pectin, and other solid fractions that are added back to the juice after evaporation, in order to increase appeal and palatability;
- Evaporation of the citrus juice to obtain a concentrated and microbiologically stable product;
- At the end of the production cycle and during cleaning operations of industrial equipment and factories.
2. Characteristics of Citrus-Processing Wastewater
2.1. Quantitative Variability
CPWW production shows a seasonal variability of its qualitative and quantitative characteristics[3][4] [5,23], reflecting the large variability of flows and physicochemical properties (e.g., pH, COD, and suspended and settleable solids, EOs[2][5] [22,24]). In order to give indications on the most suitable system for CPWW management, it is important to analyze its quantitative and qualitative variability and the factors which influence these characteristics.
A citrus processing plant requires large flows of fresh water and consequently produces comparable amounts of wastewater. CPWW production mainly depends on (i) water consumption per weight unit of processed fruit, (ii) amount of citrus processed, and (iii) overall water management in the plant.
Water consumption per weight unit of processed fruit varies in function of the adopted processing technology and is largely variable; in[6] [14], a use of 1 m3 per ton of processed fruits in plants without peel dryers, using water-recirculation systems, was estimated, while Corsino et al.[3] [5] observed that a citrus factory processing 25 t h−1 of lemon produced about 17 m3 of wastewater per ton of processed fruits.
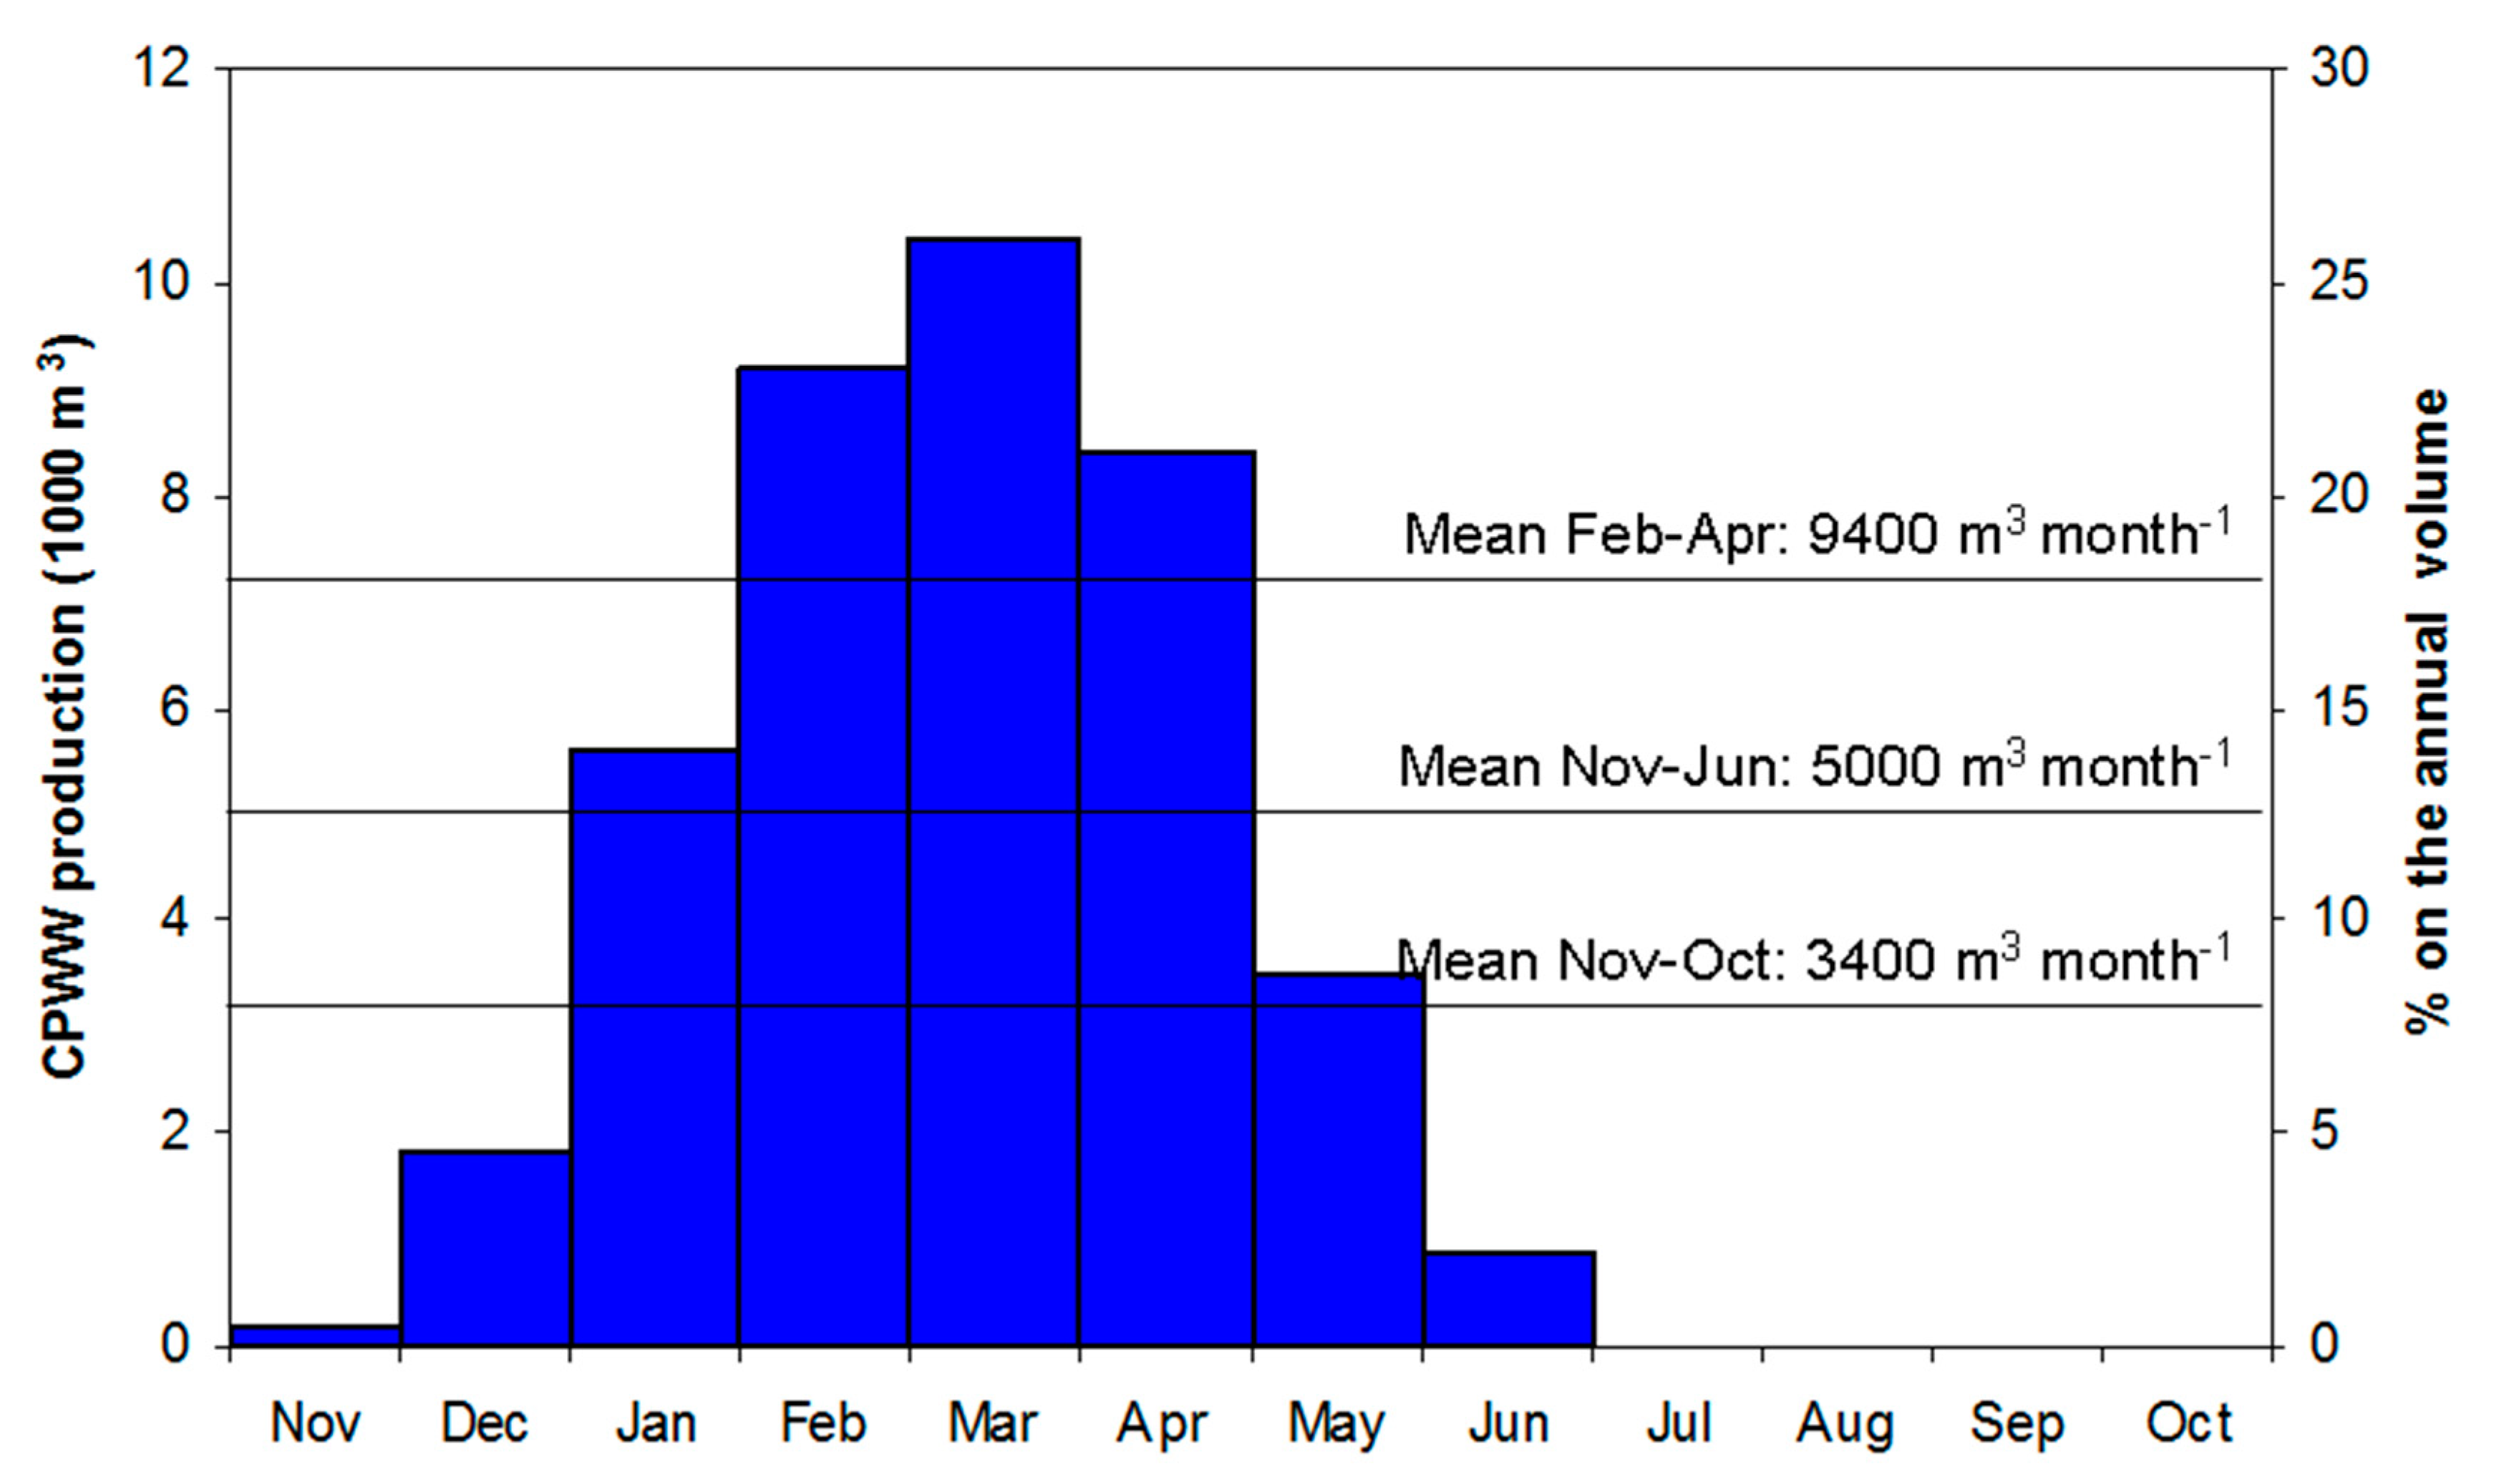
The amount of citrus processed is characterized by a noticeable interannual and intra-annual variability. The interannual variability of citrus processing is linked to the variations of the fruit production from one year to another, since the citrus amount processed each year depends on both agricultural production and market trends. The intra-annual variability mainly depends on plant operation. Since over 70% of citrus production destined to transformation is concentrated between February and April[7] [25], in the Mediterranean areas citrus processing plants mainly operate in this period. The monthly variability depends, beside the amount of processed citrus, on the variability of water unit consumption, which, in turn, is significantly affected by residual factors (citrus-fruit quality, plant management, etc.). Figure 1 shows a typical monthly distribution of wastewater production in a citrus-processing company with a potentiality of 40,000 tons yr−1 of processed citrus[6] [14].

Figure 1. Typical monthly distribution of citrus-processing wastewater (CPWW) produced in a citrus-processing industry of Sicily (Italy)[6] [14].
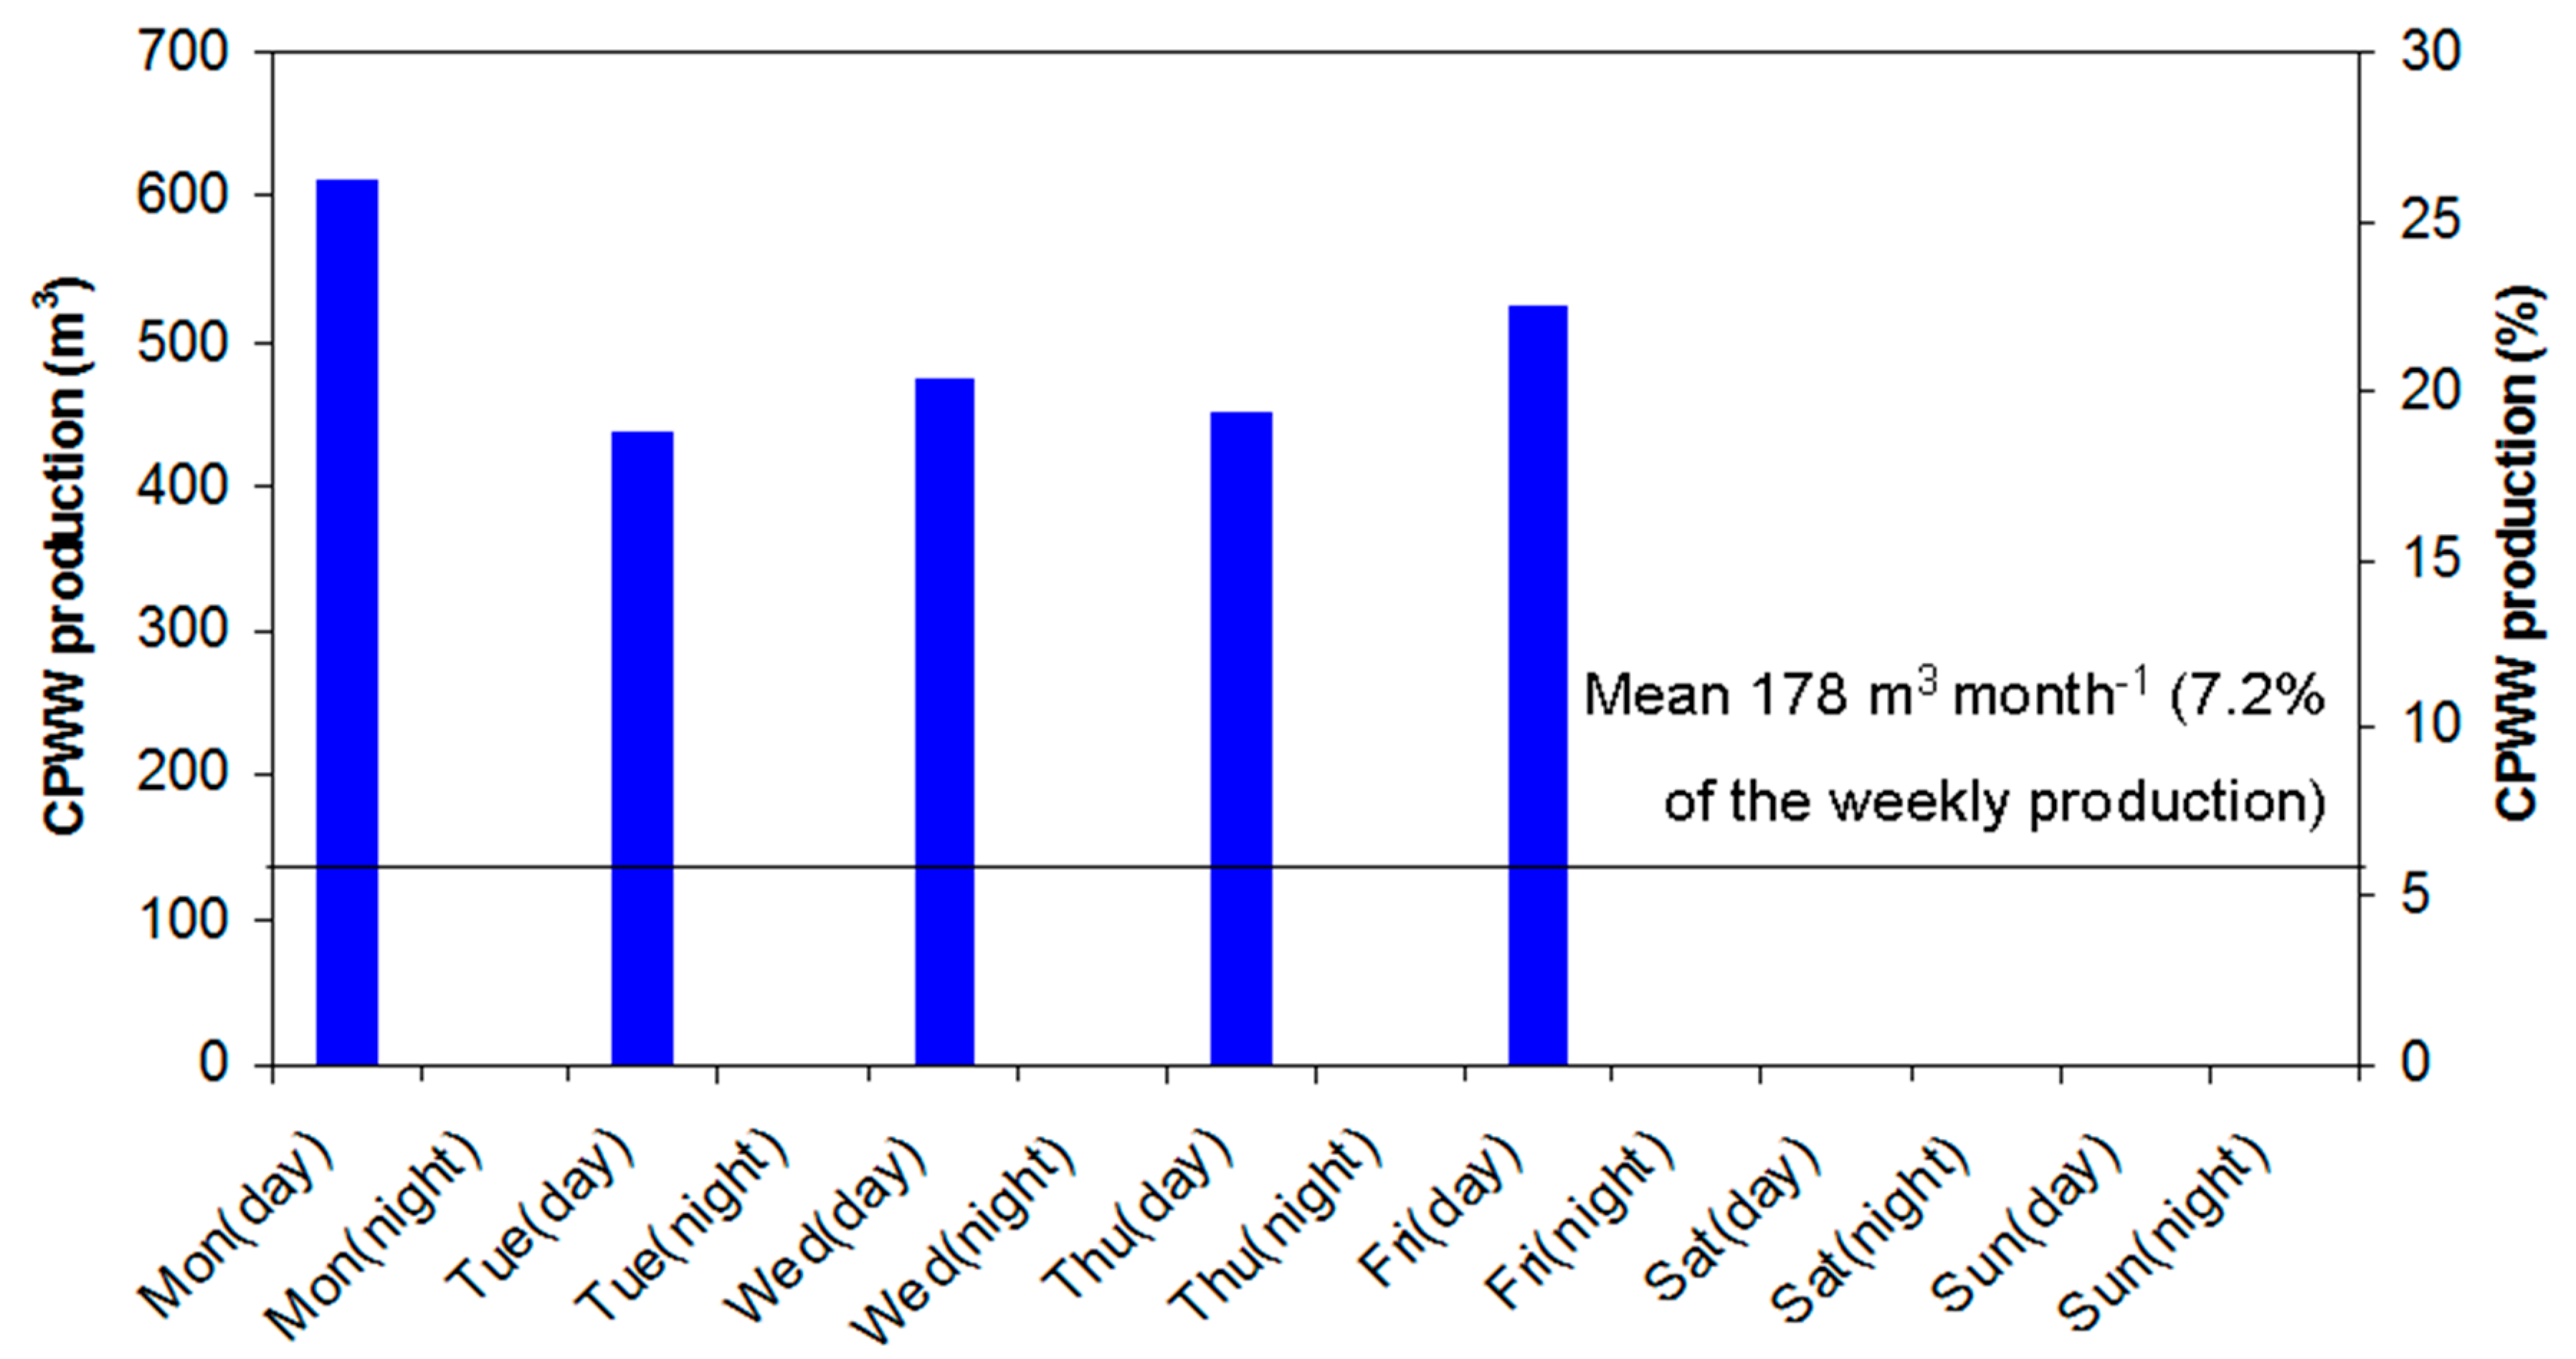
CPWW production is also characterized by a large weekly and daily variability (Figure 2) due to plant inactivity in the night and on the weekend. This variability can be quantified by a peak factor evaluated as the ratio between the average flow in working hours (generally 12 per day) in the maximum production day and the weekly mean value: using the data of this factor is equal to 3.3; peak hour flow respect to weekly average is instead about 13. A value of 13 is achieved by the product between the above calculated peak (3.3) factor and the flow of the 12 working hours (4-fold the average flow).

Figure 2. Daily distribution of wastewater production per week in a citrus-processing industry of Sicily (Italy)[6] [14].
Techniques minimizing fresh-water requirement and wastewater production in citrus processing plants have been widely investigated, developed, and applied to processing industries[8] [26]. The basic concept for water-use minimization is the maximization of water reuse and the identification of regeneration opportunities[9] [27]. Use of regenerated wastewater in some operations requires installation of a treatment unit (such as gravity settling, filtration, membranes, activated carbon system, and biological treatment)[8] [26] and, therefore, basically depends on the economic viability of the regeneration versus the purchase, use, treatment, and discharge of fresh water.
2.2. Qualitative Variability
As mentioned above, CPWW is also characterized by a large variability of its physicochemical properties, which depends on the processing techniques. Table 1 summarizes the main qualitative characteristics of CPWW. Moreover, these characteristics significantly vary throughout the same working day. This variability mainly depends on processing-plant operation and, secondarily, on species and ripening stage of processed citrus. As a result of the first variability factor, the very large range of qualitative variability of CPWW is due to several factors, such as (i) emptying of the tanks, which feed the processing lines, e.g., daily or weekly, thus determining peaks of the hydraulic load; (ii) discharge of the water produced by EO extractors at the end of the day, with COD over 10 g L−1 and high concentration of EOs; and (iii) plant washing by alkaline solutions (sodium hydroxide and calcium hydroxide), which generally increases pH to a peak value of about 12[10][11] [8,28]. Other factors explaining the qualitative variability of CPWW, mainly linked to plant and process design, are as follow: (i) the type of water-cooling system (i.e., the open-cycle system, using large water flows with high dilution effects of the final effluent, or the closed-cycle system, with cooling towers requiring very limited water addition); (ii) the recirculation level of the EO extractors; (iii) the presence/absence of a peel-dehydrating system, which generally produces water with a very high organic load (over 60 g of COD per kg of processed fruit); (iv) the amount of peel produced and destined to drying processes (rarely 100% of the available amount).
The main concerns linked to treatment of CPWW are the low pH, the low concentration of nutrients, and the very high concentration of EOs.
Table 1. Main qualitative characteristics of wastewater of citrus processing industry (from literature data).
|
Parameter |
Reference |
||||
|
|
|||||
|
Koppar et al.[12] |
Parish et al.[13] |
Andiloro et al.[14] |
Zema et al.[7] |
Zema et al.[15] |
|
|
pH |
4.6–4.8 |
4.8 |
3.3–4.0 |
4.2–4.4 |
5.1–5.5 |
|
TS (g L−1) |
3.5 ** |
- |
- |
- |
- |
|
COD (g L−1) |
8.6 * |
9.0 |
21.2–27.2 |
5.0 |
6.6 |
|
TKN (g L−1) |
0.06 |
0.3 |
- |
- |
- |
|
EO (g L−1) |
- |
2.8 |
0.3–1.0 |
0.5 |
0.6 |
Notes: COD = chemical oxygen demand; TS = total solids (dry residue at 105 °C); EO = essential oil; TKN = total Kjeldahl nitrogen; * referred to soluble COD; ** referred to total dissolved solids.
The organic load of CPWW is generally high, since COD ranges from 1 to 10 g L−1 and more. This parameter has a large range of variability according to the different stages of the production process[3] [5]. On the other hand, CPWW has a low concentration of nutrients (i.e., nitrogen and phosphorous) with respect to the organic load (imbalanced ratio COD/N/P). Finally, the very high concentrations of EOs (of which d-Limonene is the primary constituent) can interfere with the biological processes, which can even stop if EO concentration is over 50 mg L−1[16][17] [33,34], due to its bacteriostatic action. In the case of orange EOs, their recovery from wastewater is not convenient due to the high dilution and the limited value, differently from more costly essences (as bergamot or lemon).
This publication can be found here:https://www.mdpi.com/2073-4441/11/12/2481
