Remote sensing technology aims to monitor and capture the earth’s information without making direct contact and destroying it. The utilization of the electromagnetic spectrum, ranging from visible to microwave for measuring the earth’s properties, is the main idea behind remote sensing technology. Machine learning (ML) and deep learning (DL) remote sensing techniques have successfully produced a high accuracy map for detecting weeds in crops using RS platforms. Therefore, this technology positively impacts weed management in many aspects, especially in terms of the economic perspective. The implementation of this technology into agricultural development could be extended further.
- precision agriculture
- remote sensing
- rice farming
- site-specific weed management
1. Introduction
2. Controlling Weed in Paddy Fields at Different Growth of Stages
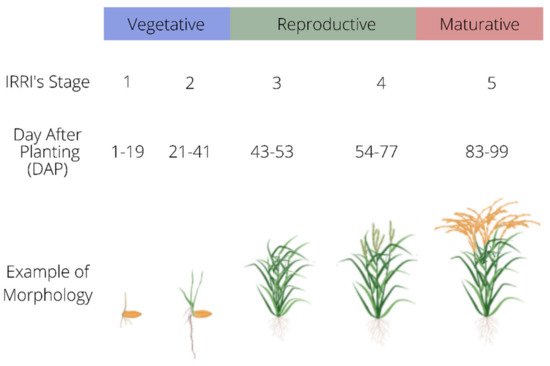
In general, rice growth periods can be identified in three stages. They are the vegetative stage, reproductive stage, and maturative or ripening stage [5][21]. Depending on agricultural and environmental conditions, the whole cycle takes about 120 to 125 days. The International Rice Research Institute (IRRI) splits the growth cycle into five stages [6][22]. A general idea of the growth cycle is presented in Figure 1, with morphology examples.
3. Weed Detection Using Remote Sensing Technique
The image processing workflow to detect weed in paddies can generally be divided into five stages: image data collection, pre-processing, feature extraction and selection, training, image classification and validation [16][36].3.1. Image Data Collection
3.2. Image Mosaicking and Calibration
Images acquired from UAVs can be mosaicked using a Pix4D mapper (Pix4D, Prilly, Switzerland), Agisoft Photoscan Pro (Agisoft LLC, 52 St. Petersburg, Russia), and any available commercial software to generate qualitative, high-resolution orthomosaic images. After mosaicking, the process will continue with radiometric calibration and rescale the intensity of the electromagnetic radiation or digital number (DN) into the percentage of reflectance values [22][53]. There are numerous methods that have been implemented by researchers, such as the traditional empirical line correction approach and modern automatic radiometric calibration using available commercial software.3.3. Feature Extraction and Selection
Following the spectral calibration, feature extraction can be extracted or computed for different image processing purposes using various approaches. This process will be helpful for the classification and identification of weeds in paddy fields. Feature extraction techniques are beneficial, especially in shape and pattern recognition. As features define the behavior of an image, they show its place in terms of storage taken, classification efficiency, and, obviously, in time consumption [23][60]. Therefore, optimizing the feature subset is required before feeding it into the machine learning (ML) and deep learning (DL) algorithms for improving the classification process and making it cost and time-efficient [24][61].3.4. Image Classification and Validation
Many machine learning (ML) and deep learning (ML) algorithms are available for image classification. However, choosing the best one that fits the research’s objective is crucial, because different algorithms have different difficulty levels. Overall, the assessment can be carried out by comparing the classified pixels with ground truth pixels using a confusion matrix [25][67]. The result for weed classification is presented in terms of producer accuracy and overall accuracy. Producer accuracy (Equation (1)) is the probability that a pixel in the classification correctly shows class X. Given the ground truth class is X, producer accuracy can be calculated using where:
- -
- -
 where:
- -
- -
 where:
- -
4. An Overview of Machine Learning in Agriculture
- = row sums.
-
4. An Overview of Machine Learning in Agriculture
In recent years, machine learning (ML) has provided a new criterion for agriculture with big data technology and high-performance computing. The development of ML has created new opportunities in agriculture operational management to unravel, measure, and analyze complex data [26][72]. Generally, the ML framework involves learning from ‘experience’, known as training data, to execute the classification, regression, or clustering tasks. These training data are usually regarded as a feature described by a set of attributes or variables. The machine learning model works by predicting the pattern and trend of future events in crop monitoring and assessment [27][73]. The ML model’s performance in a particular task is evaluated by performance metrics improved by experience over time. As a result, classification techniques have been a prominent research trend in machine learning for many years, informing various studies. This method seeks to create features from the input data. Furthermore, it is highly field-specific and requires significant human effort, leading to deep learning techniques [16][36].-
In deep learning (DL), CNN is the most well-known and widely used algorithm [28][29][30][69,70,77]. The fundamental advantage of CNN over the other DL algorithms is that it automatically detects significant elements without the need for human assistance [36]. Comparable to the multi-layer perceptron (MLP), where it consists of three layers known as the input, output, and hidden layer [31][78], CNN has many convolution layers before sub-sampling (pooling) layers, with fully connected (FC) layers as the last layers. An illustration of the CNN framework for image classification is shown in Figure 2.
-
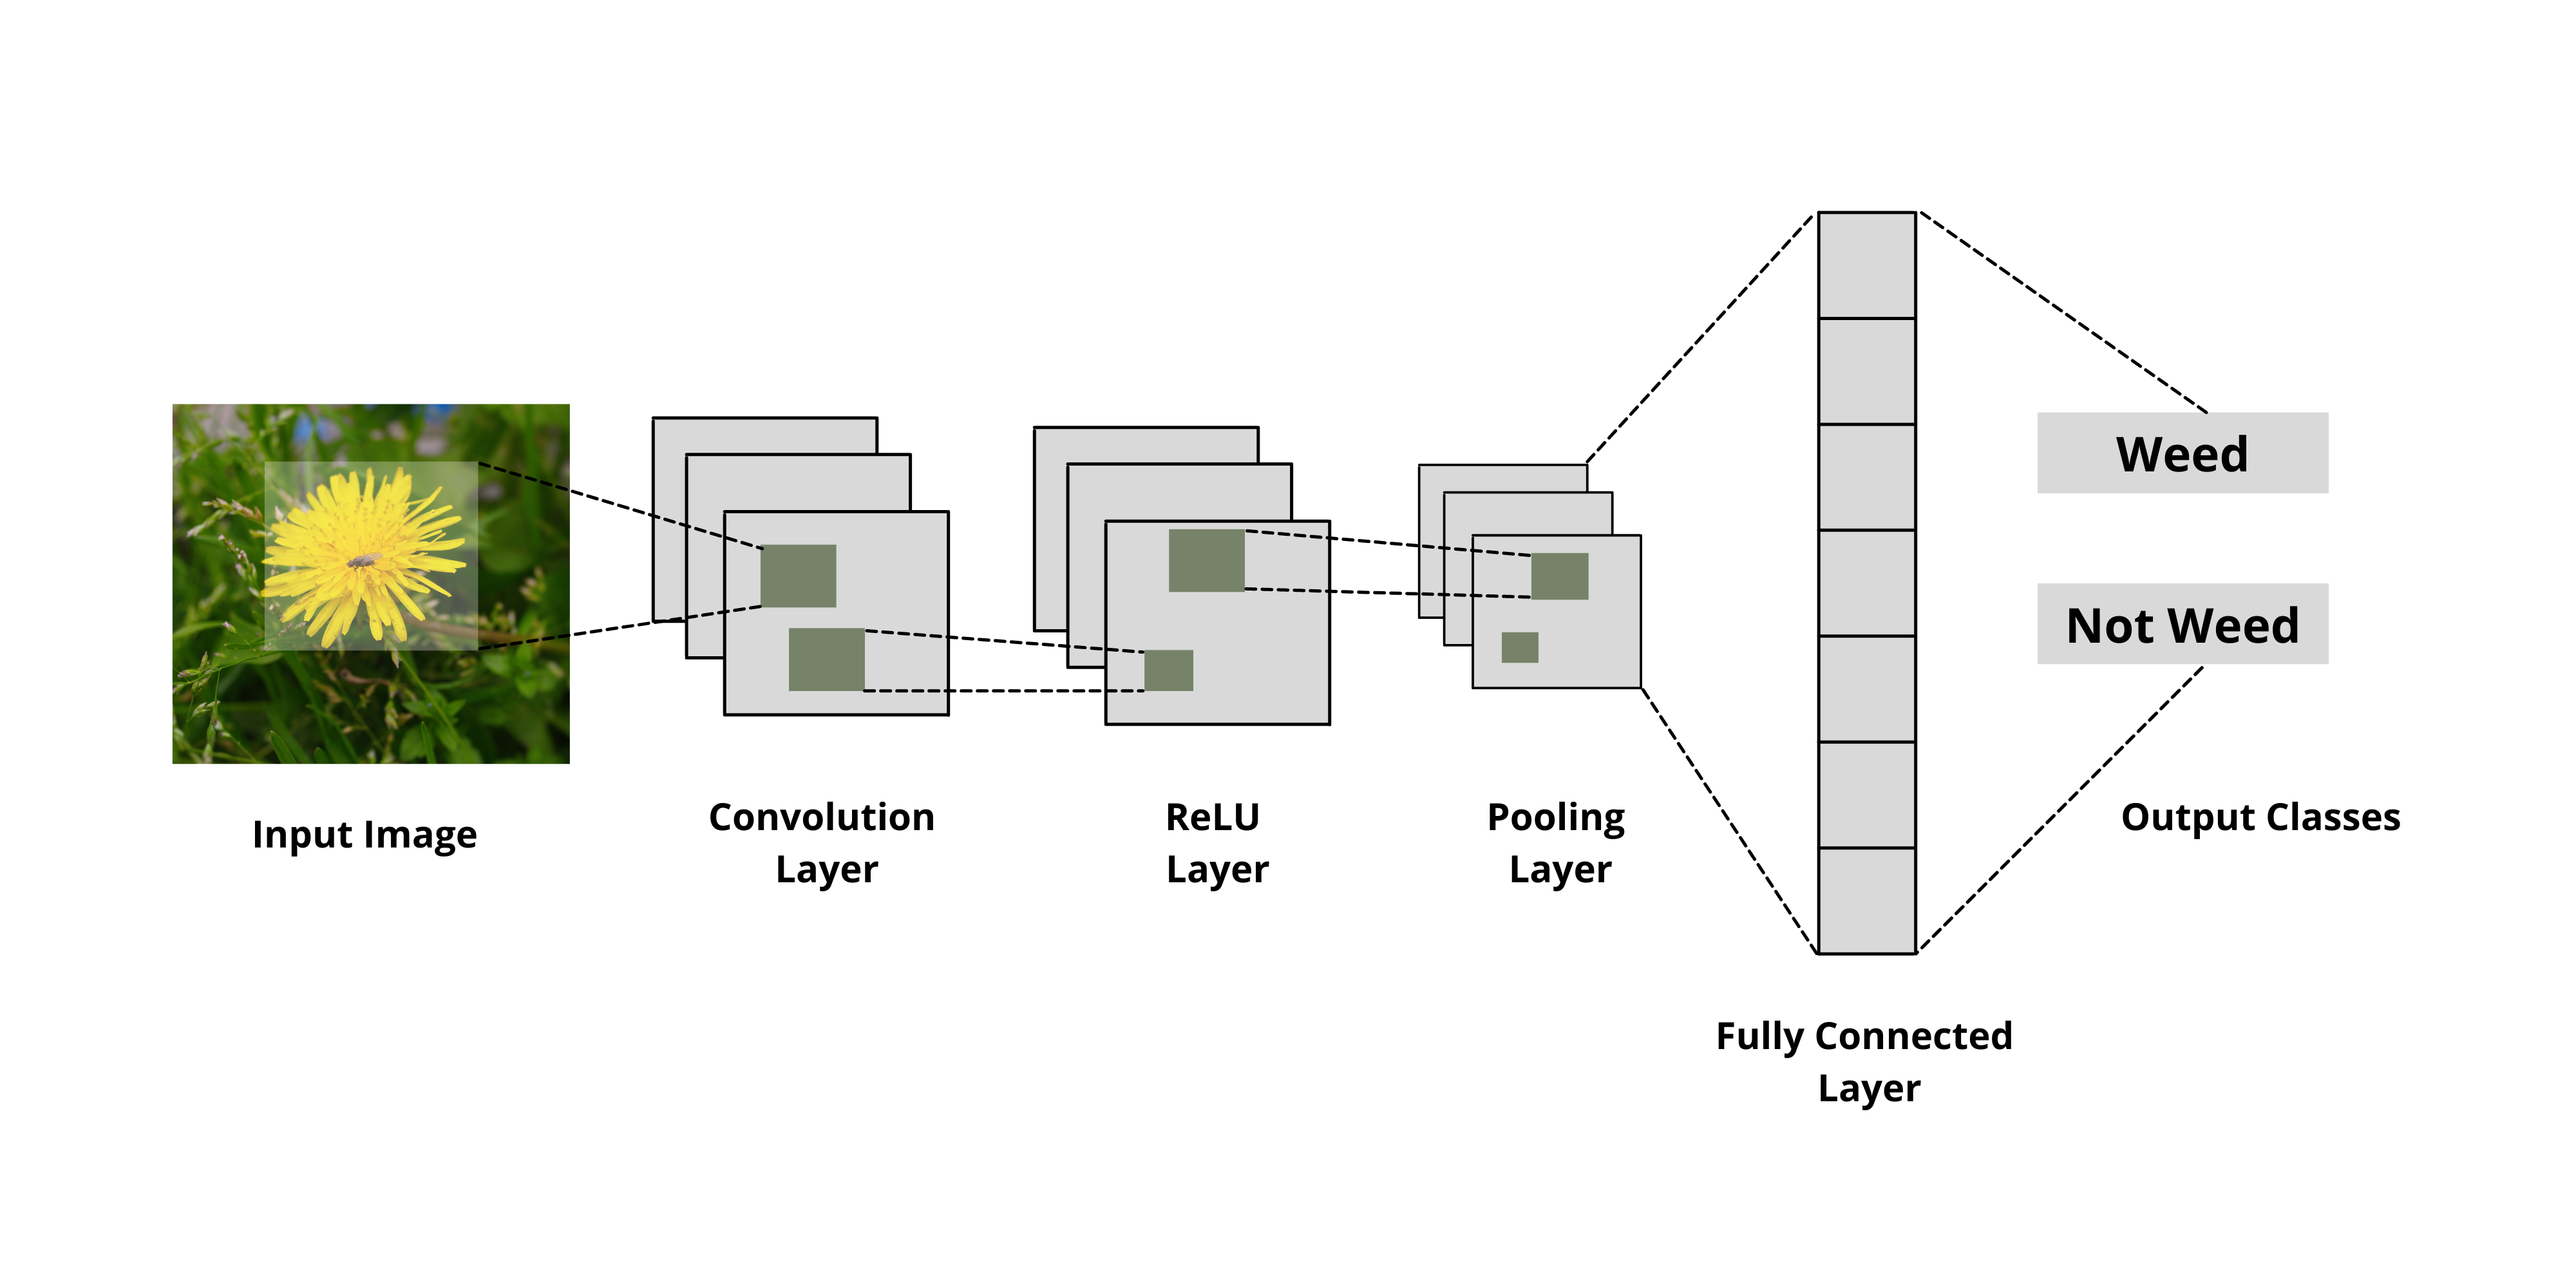
- Figure 2.An illustration of the CNN framework for image classification.
-
4.1. The Application of Remote Sensing and Machine Learning Technique into Weed Detection
Choosing remote sensing (RS) and machine learning algorithms for SSWM can improve precision agriculture (PA). This situation has resulted in integrating remote sensing and machine learning becoming critical, as the need for RGB, multispectral, and hyperspectral processing systems has developed. Numerous researchers who tested the RS technique successfully produced an accurate weed map with promising implications for weed detection and management.
4.1.1. Machine Learning (ML)
Machine learning is a part of artificial intelligence that enables machines to recognize patterns and judge with little or no human input. Back during the early introduction to machine learning, Aitkenhead et al. [32][81] proposed a simple morphological characteristic measurement of a leaf shape (perimeter2/area) and a self-organizing neural network to discriminate weeds from carrots using a Nikon Digital Camera E900S. Their proposed method enables the system to learn and differentiate between species with more than 75% accuracy without predefined plant descriptions. Meanwhile, Eddy et al. [33][86] tested an artificial neural network (ANN) to classify weeds (wild oats, redroot pigweed) from crops (field pea, spring wheat, canola) using hyperspectral images. The original data were 61 bands that were reduced to seven bands using principal component analysis (PCA) and stepwise discriminant analysis. A total of 94% overall accuracy was obtained from the ANN classification.4.1.2. Deep Learning (DL)
Deep learning has recently become a machine learning component widely utilized in agricultural crop monitoring and management. It has taken a directive in many crop monitoring objectives such as weed detection, nutrient disorder, and disease detection. Huang et al. [34][43] utilized the fully convolutional network (FCN) method to map weeds in rice using unmanned aerial vehicle red-green-blue (UAV-RGB) imagery. Transfer learning was used to optimize the generalization capacity, and skip architecture was chosen to boost prediction accuracy. The result was then compared with the patch-based convolutional neural networks (CNN) algorithm and the pixel-based CNN method. The findings showed a proposed FCN method that outperformed others, both in efficiency and efficacy in terms of accuracy. The overall accuracy of the FCN method was up to 93.5%, and the accuracy for weed recognition was 88.3%.5. Advantages of Implementation of Remote Sensing in Weed Detection through PA
The usage of herbicides, also known as agrochemicals, to control weeds in paddy fields has caused several impacts on the environment and human health [35][100]. Therefore, the authorities can consider reducing these inputs to follow an environmentally friendly rice production practice. A study by Jafari, Othman, and Kuhn [36][101] showed that a 10% reduction in agrochemical grants would reduce agrochemical use. However, it dramatically reduces national welfare and decreases food safety. Nevertheless, we can overcome these issues by implementing remote sensing SSWM techniques into precision agriculture (PA).6. Future Direction
Machine learning such as deep learning algorithms should be implemented for extracting higher abstract levels of weeds and their relation to the seasonal changes of the paddy for more accurate weed identification. It is challenging to implement remote sensing techniques into paddy. However, when referring to the previous study, De Castro et al. [37][96] successfully classified Cynodon dactylon (bermudagrass) in a vineyard by integrating OBIA with a decision tree (DT) algorithm. De Castro et al. [38][46] also managed to produce a weed map of Convolvulus arvensis L. (bindweed) in a soybean field. Meanwhile, Huang et al. [39][94] successfully generated a grass and sedge weed map in a paddy field using a deep learning technique. This study has similarities in shape, texture, and pattern that machine learning and deep learning techniques can classify. In addition, the integration of various platforms, such as ground-based and machine vision technologies, should be considered. Besides, various yield-determining factors, such as climatic or agronomic, should be considered during the developmental stages of paddy. By maintaining the vigorous development of paddy, the existence of weeds can be minimized due to the biological mechanisms of the crops, which can be used to suppress the growth response of weeds towards the crops during the competition process.
-
-
-