Mild SARS-CoV-2 infections (n = 22), compared to those that had recovered from other mild respiratory infections (n = 11). Individuals who had experienced mild SARS-CoV-2 infections had elevated levels of C-reactive protein 1–3 months after symptom onset, and changes in phenotype and function of circulating T-cells that were not apparent in individuals 6–9 months post-symptom onset. Markers of monocyte activation, and expression of adherence and chemokine receptors indicative of altered migratory capacity, were also higher at 1–3 months post-infection in individuals who had mild SARS-CoV-2, but these were no longer elevated by 6–9 months post-infection. Perhaps most surprisingly, significantly more T-cells could be activated by polyclonal stimulation in individuals who had recently experienced a mild SARS-CoV-2, infection compared to individuals with other recent respiratory infections. These data are indicative of prolonged immune activation and systemic inflammation that persists for at least three months after mild or asymptomatic SARS-CoV-2 infections.
1. Introduction
Infection with SARS-CoV-2 has unusual effects on circulating immune cells. In general, respiratory infections are associated with rapid and sustained release of neutrophils and monocytes from the bone marrow, with no immediate change in production or function of lymphocytes
[1]. In contrast, SARS-CoV-2 infections are consistently associated with lymphopenia, which is a reliable predictor of mortality
[2]. The loss of T-cells may be due to apoptosis in the secondary lymphoid organs, or possibly inappropriate recruitment to the lungs and other organs
[3][4][3,4]. Severe cases of SARS-CoV-2 infection are also associated with increased granularity and changes in nuclear morphology in neutrophils and monocytes, which are generally due to premature egress from the bone marrow and stunted maturation
[5]. Whether myelopoiesis and egress are affected in mild COVID is not yet known.
Hospitalization with any respiratory infection is associated with long-term health consequences
[6]; however, the consequences of COVID-19 appear to be particularly broad and include “long COVID” (a constellation of symptoms that can include severe fatigue often exacerbated by exercise, pain, and respiratory complications)
[7][8][7,8], and a higher than expected risk of re-hospitalization for a variety of causes
[8][9][10][8,9,10]. Although it has been documented that there are differences in acute immune responses in asymptomatic, mild, moderate, and severe cases of SARS-CoV-2 infection
[11][12][11,12], it is not clear whether there is any risk of long-term immune dysregulation or health consequences in survivors of asymptomatic or mild cases.
2. Demographics and Symptoms of Individuals Who Had SARS-CoV-2 and Other Respiratory Infections
During the early phase of the COVID-19 pandemic (February–June 2020), diagnostic PCR testing in Ontario was generally limited to individuals who were hospitalized, had a confirmed exposure with an infected person, or had travelled to an area with active infections. At the time, public health advice was that people who did not need medical attention should self-isolate at home without being tested. Serologic studies have been used to estimate an infection rate of 0.5–1.5% during the March-June ‘first wave’
[13][20]. Compounding the lack of testing were the high rates of influenza and unusually high rates of respiratory syncytial virus (RSV) infections
[14][21]. Consequently, some people with respiratory infections in this early period were told by a health care professional that they had COVID-19 without a nasopharyngeal swab PCR test, and not all
of our study participants with symptoms of mild respiratory illness had COVID-19 (
Table 1). Participants were classified as having had COVID-19 if they received a positive diagnostic PCR test and/or had anti-SARS-CoV-2 antibodies (
Supplementary Table S1). There were no statistically significant differences in age, sex, BMI, co-morbidities, medications, or duration of symptoms between individuals that had mild COVID-19 (
n = 22) and individuals that had other mild respiratory infections (
n = 11,
Table 1).
Table 1. Participant demographics 1.
| |
Other Respiratory
Infections (Not COVID-19) n = 11 |
COVID-19
Infections
n = 22 |
Indeterminate
n = 5 |
p Value 1 |
| Age (mean ± STDEV) |
55 ± 16 |
55 ± 15 |
57 ± 11 |
0.9249 |
| Sex (% female) |
8 (73%) |
11 (50%) |
3 (60%) |
0.2783 |
| BMI (kg/m2) |
24.0 ± 2.9 |
25.0 ± 3.6 |
24.5 ± 2.3 |
0.4172 |
| Health Conditions (frequency) |
| Asthma |
1 (9%) |
1 (5%) |
1 (20%) |
- |
| COPD (including emphysema and chronic bronchitis) |
1 (9%) |
0 (0%) |
0 (0%) |
- |
| Other lung disease |
0 (0%) |
1 (5%) |
0 (0%) |
- |
| Diabetes |
0 (0%) |
3 (14%) |
0 (0%) |
- |
| Hypertension |
1 (9%) |
1 (5%) |
1 (20%) |
- |
| Heart disease |
0 (0%) |
2 (9%) |
0 (0%) |
- |
| Cancer |
2 (18%) |
2 (9%) |
0 (0%) |
- |
| Autoimmune condition |
1 (9%) |
1 (5%) |
1 (20%) |
- |
| Medications |
| Number of medications (mean ± STDEV) |
1 ± 2 |
2 ± 2 |
1 ± 1 |
0.2049 |
| Symptoms (frequency) |
| Cough |
6 (55%) |
13 (59%) |
2 (40%) |
- |
| Shortness of breath |
4 (36%) |
9 (41%) |
1 (20%) |
- |
| Chest pain |
3 (27%) |
9 (41%) |
2 (40%) |
- |
| Fever |
3 (27%) |
12 (55%) |
1 (20%) |
- |
| Feeling generally unwell |
9 (82%) |
21 (95%) |
2 (40%) |
- |
| Abnormally tired |
7 (64%) |
20 (91%) |
2 (40%) |
- |
| New confusion |
4 (36%) |
1 (5%) |
1 (20%) |
- |
| New generalized muscle aches and pains |
5 (45%) |
16 (73%) |
2 (40%) |
- |
| New joint pain |
3 (27%) |
5 (23%) |
2 (40%) |
- |
| Earache/infection |
0 (0%) |
1 (5%) |
0 (0%) |
- |
| Headache |
6 (55%) |
14 (64%) |
1 (20%) |
- |
| Runny/stuffy nose |
7 (64%) |
7 (32%) |
2 (40%) |
- |
| Sinus pain |
2 (18%) |
4 (18%) |
1 (20%) |
- |
| Sore/scratchy throat |
7 (64%) |
10 (45%) |
2 (40%) |
- |
| Loss of appetite |
4 (36%) |
8 (36%) |
2 (40%) |
- |
| Loss of taste/smell |
2 (18%) |
11 (50%) |
1 (20%) |
- |
| Duration of Symptoms |
|
|
|
|
| No symptoms—1 week |
4 (36%) |
3 (14%) |
1 (20%) |
- |
| 2–4 weeks |
3 (27%) |
11 (50%) |
4 (80%) |
- |
| 4 or more weeks |
4 (36%) |
8 (36%) |
0 |
- |
| Diagnosis |
PCR test for SARS-CoV-2
performed |
0 (0%) |
15 (68%) |
0 (0%) |
- |
| Told by a health care professional that they had SARS-CoV-2/COVID-19 without a PCR test |
1 (8%) |
5 (25%) |
0 (0%) |
- |
1 Statistical comparisons were made between ‘other respiratory infections’ and ‘COVID-19 infections’ groups only, since the ‘indeterminate’ group was not used in subsequent analyses. Student’s unpaired parametric t-test was used to compare age and BMI, which were normally distributed. Sex distribution was measured by Fisher’s exact test to analyze a 2 × 2 contingency table. Differences in the number of medications, which was not normally distributed, was measured using an unpaired non-parametric test not assuming Gaussian distribution.
3. Survivors of Mild SARS-CoV-2 Infections Have Reduced T Cell Responses to SARS-CoV-2 Peptides 6–9 Months Post Symptom Onset
3. Survivors of Mild SARS-CoV-2 Infections Have Reduced T Cell Responses to SARS-CoV-2 Peptides 6–9 Months Post Symptom Onset
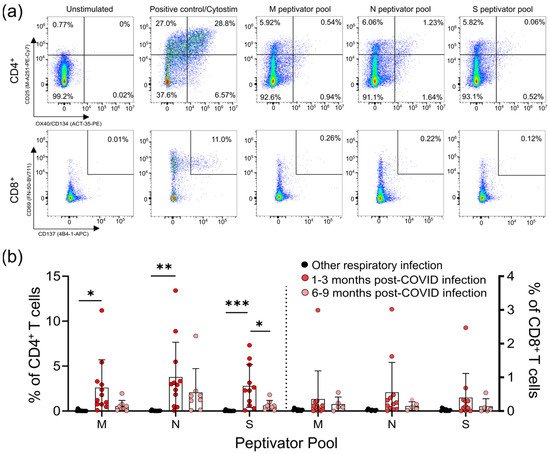
Lymphopenia is commonly reported in severe SARS-CoV-2 infections; however, it is not clear whether mild infections impact T-cell numbers or function. We used a flow cytometric activation-induced marker assay to measure T-cell responses to the SARS-CoV-2 structural membrane protein (M), nucleocapsid protein (N), and immunodominant regions of the spike (S) protein in all participants (
Lymphopenia is commonly reported in severe SARS-CoV-2 infections; however, it is not clear whether mild infections impact T-cell numbers or function. We used a flow cytometric activation-induced marker assay to measure T-cell responses to the SARS-CoV-2 structural membrane protein (M), nucleocapsid protein (N), and immunodominant regions of the spike (S) protein in all participants (Figure 1
a). After 44 h incubation with antigen, this assay identifies antigen-specific CD4+
T-cells by induced co-expression of CD25 and CD134 (OX40), and antigen-specific CD8+
T-cells by co-expression of CD69 and CD137 (4-1BB) (Figure 1
a) [15,16]. We identified five individuals who had mild respiratory symptoms, did not have a positive diagnostic PCR test, and were seronegative for SARS-CoV-2 antibodies, but had detectable levels of SARS-CoV-2 reactive T-cells to some, but not all, of the SARS-CoV-2 M, N, and S peptides (Supplementary Table S1). Consequently, we classified these five individuals as “indeterminate”, and did not include them in subsequent analyses (their demographic data is summarized in Table 1
). T-cell responses to the M, N, and S peptide pools after mild SARS-CoV-2 infection. (
) The number of SARS-CoV-2-specific T-cells is measured as a percent of CD4
T-cells expressing both CD25 and OX40, or CD8
T-cells expressing both CD69 and CD137, after activation with the S, M, or N peptide pools 1–3 months and 6–9 months after infection. The polyclonal activator Cytostim is used as a positive control. (
) All COVID-19 seropositive participants had an increase in CD25
T-cells in response to at least one of the M, N, or S antigens 1–3 months after mild COVID-19 infection, compared to seronegative individuals recovered from other mild respiratory infections. Each participant is indicated by a single data point: other respiratory infection n = 11; 1–3 months post COVID-19 infection n = 11; 6–9 months post COVID-19 infection n = 8. Multiple group comparisons were tested using Welch’s One-Way ANOVA and the Games–Howell post-hoc test; bars represent the mean ± standard deviation. * p < 0.05; ** p < 0.01; *** p < 0.001.
For analysis of the T-cell responses, we split our cohort into those without antibody or T -cell responses to SARS-CoV-2 (other respiratory infection; n = 11), and those with antibody responses to SARS-CoV-2 (COVID-19; n = 22), the majority of whom also had detectable T-cell responses to SARS-CoV-2 M, N, and S antigens (90.9%; n = 20/22) (Figure 1
; Supplementary Figure S1). Of the 22 participants who had COVID-19 infections, 14 provided samples 1–3 months post-symptom onset, and 8 provided samples 6–9 months post-symptom onset. Consistent with other reports of lasting memory T-cell responses to SARS-CoV-2 infection [11], we observed that all COVID-19 participants that provided samples at 1–3 months or 6–9 months post-symptom onset had generated T-cell memory to at least one of the M, N, and S peptides pools (Figure 1
b, Supplementary Table S3).
We saw similar frequencies of CD4+
T-cell responses to all SARS-CoV-2 antigens, and these were highest in COVID-19 patients 1–3 months post symptom onset (means of ~3–4% of CD4+
T-cells), and were significantly higher than in individuals with other respiratory infections (Figure 1
b). Compared to COVID-19 patients 1–3 months post-symptom onset, responses were reduced in COVID-19 patients 6–9 months post-symptom onset, and were not significantly different to those in individuals recovered from other respiratory infections. Similar results were found for CD8+
T-cell responses, being highest in COVID-19 patients 1–3 months post-symptom onset (means of ~0.4–0.5% of CD8+ T-cells), although there were no significant differences between the groups. Together, these data indicate there are long-term differences in T-cell functionality in COVID-19 survivors.
T-cells), although there were no significant differences between the groups. Together, these data indicate there are long-term differences in T-cell functionality in COVID-19 survivors.
4. Survivors of Mild SARS-CoV-2 Infections Have Evidence of Sustained Inflammation 1–3 Months Post Symptom Onset
Prolonged immune activation can occur after recovery from severe infections, and is thought to contribute to malaise and other symptoms in survivors [22]. One of the unusual features of COVID-19 is that a significant number of patients with mild to moderate illness report symptoms weeks to months after infection, despite having cleared the virus [23]. Although the participants generally had symptoms resolve within 1 month post-infection (
4. Survivors of Mild SARS-CoV-2 Infections Have Evidence of Sustained Inflammation 1–3 Months Post Symptom Onset
Prolonged immune activation can occur after recovery from severe infections, and is thought to contribute to malaise and other symptoms in survivors [22]. One of the unusual features of COVID-19 is that a significant number of patients with mild to moderate illness report symptoms weeks to months after infection, despite having cleared the virus [23]. Although the participants in our study generally had symptoms resolve within 1 month post-infection (Table 1
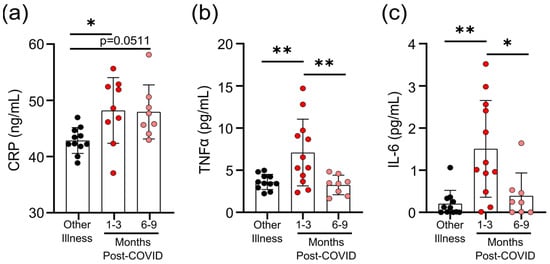
), we have nonetheless found evidence of prolonged inflammation. Seropositive individuals had higher levels of CRP, TNF, and IL-6 in circulation 1–3 months post-symptom onset; but in samples from individuals 6–9 months post-symptom onset, levels were equivalent to those individuals who were seronegative and were recovered from other respiratory infections (Figure 2
a–c). Transient increases in soluble mediators of inflammation occur after mild SARS-CoV-2 infection. (
) CRP levels in serum were higher 1–3 months after mild COVID-19 infection, and there was a trend towards remaining elevated 6–9 months after mild COVID-19 infection, compared to levels observed in seronegative individuals after other respiratory infections. Serum TNF levels (
) were higher 1–3 months after COVID-19 infection, but returned to levels seen in individuals who had other respiratory infections by 6–9 months. Each participant is indicated by a single data point: other respiratory infection n = 11; 1–3 months post-COVID n = 9–12; 6–9 months post-COVID n = 8. Multiple group comparisons were tested using Welch’s One-Way ANOVA and the Games–Howell post-hoc test; bars are presented as mean ± standard deviation. * p < 0.05; ** p < 0.01.
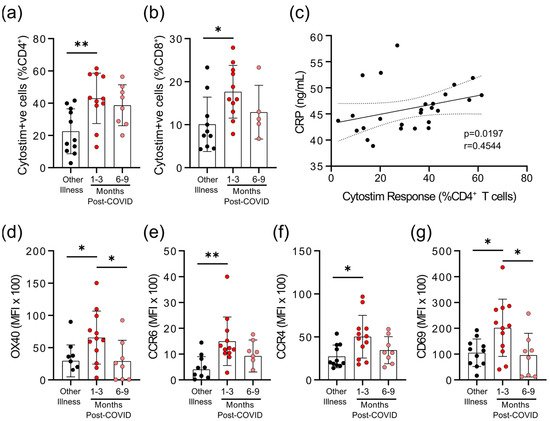
We observed that there were differences in the degree of epitope independent polyclonal activation of T-cells between the COVID-19 and non-COVID-19 groups. When whole blood was stimulated with Cytostim, which acts as a superantigen by crosslinking the T-cell receptor (TCR) (regardless of TCR variable β gene usage) and major histocompatibility complex (MHC), there was a statistically significant difference in the percent of CD25+
OX40+
CD4+
T-cells and CD69+
CD137+
CD8+
T-cells in COVID-19 patients 1–3 months post-symptom onset (Figure 3
a,b). Whether this superantigen-like crosslinking activation contributes to, or is a result of, systemic inflammation is not clear, but CRP levels correlated with the percent of Cytostim-activated CD4+
T-cells (Figure 3
c). CD4+
T-cells in the COVID-19 group also had higher expression levels of the activation markers OX40 and CD69, as well as the chemokine receptors CCR6 and CCR4, than the other respiratory infection group, implying a stronger activation (Figure 3
d; Supplementary Figure S2). Although the levels of OX40 and CD69 were reduced in samples collected 6–9 months post-symptom onset compared to samples collected 1–3 months post-symptom onset, levels of CCR4 and CCR6 remained similar. Collectively, these data imply that there may be subtle changes in inducible T-cell activation in convalescent SARS-CoV-2 patients that do not occur in response to other respiratory infections. Evidence of prolonged T-cell activation after mild SARS-CoV-2 infection. The polyclonal activator Cytostim was used to measure T-cell responses. COVID-19 seropositive individuals had a higher proportion of CD4
) activated T-cells 1 to 3 months after infection, compared to seronegative individuals after other respiratory infections. (
T-cells that responded to polyclonal stimulation correlated with CRP in COVID-19 seropositive individuals. (
) Activation markers OX40, CCR6, CCR4, and CD69 on CD4
T-cells were higher 1–3 months after COVID-19 infection, compared to after other respiratory infections, after Cytostim exposure. Each participant is indicated by a single data point: other respiratory infection n = 7–11; 1–3 months post COVID-19 infection n = 11–12; 6–9 months post COVID-19 infection n = 5–8. Multiple group comparisons in (
g) were tested using Welch’s One-Way ANOVA and the Games–Howell post-hoc test; bars are presented as mean ± standard deviation. Data in C was assessed by Spearman’s rank correlation. * p < 0.05; ** p < 0.01.
) were tested using Welch’s One-Way ANOVA and the Games–Howell post-hoc test; bars are presented as mean ± standard deviation. Data in C was assessed by Spearman’s rank correlation. * p < 0.05; ** p < 0.01.
5. Survivors of Mild SARS-CoV-2 Infections Have Changes in Circulating Immunophenotype 1–3 Months Post-Symptom Onset
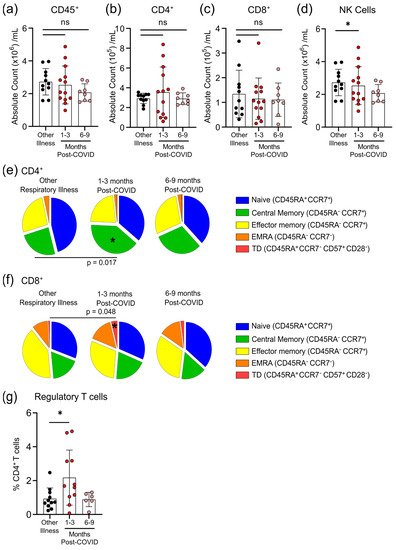
The total numbers of circulating CD45
+ cells, CD4
+ T-cells and CD8
+ T-cells were not different between individuals who had other respiratory infections and those who had COVID-19 at either 1–3 months or 6–9 months post-symptom onset (
Figure 4a–c). Compared to participants who were recovered from other respiratory infections, there was an expansion of regulatory T-cells (T
regs, defined as CD45
+CD3
+CD4
+CD25
+CD127
lowFOXP3
+) and a decrease in natural killer (NK) cells (CD45
+CD56
+/NKp46
+) in COVID-19 patients at 1–3 months post-symptom onset that returned by 6–9 months post-symptom onset to levels observed in individuals with non-COVID-19 respiratory infections (
Figure 4d,g). We also measured the proportions of circulating CD4
+ and CD8
+ T-cells that were naïve cells (CD45RA
+CCR7
+), central memory cells (CD45RA
−CCR7
+), effector memory cells (CD45RA
−CCR7
−), terminally differentiated effector memory cells re-expressing CD45RA (T
EMRA; CD45RA
+CCR7
−), and terminally differentiated cells (CD45RA
+CCR7
−CD57
+CD28
−). Compared to patients with non-COVID-19 respiratory infections, there was an expansion of central memory CD4
+ T-cells and terminally differentiated CD8
+ T-cells in COVID-19 patients at 1–3 months post-symptom onset that returned to levels observed in patients with other respiratory infections by 6–9 months post-symptom onset (
Figure 4e,f). There were no significant differences between participants who had other respiratory infections and those who had COVID-19 for any other measured CD4
+ and CD8
+ T-cell subsets.
Figure 4. Transient changes in circulating lymphocytes occur 1–3 months after COVID-19 infection. Absolute numbers of circulating CD45+ T-cells (a), CD4+ T-cells (b), and CD8+ T-cells (c) were not different after 1–3 months or 6–9 months post-symptom presentation in seropositive individuals recovered from mild COVID-19 infection, compared to seronegative individuals recovered from other respiratory infections; however, NK cell numbers (d) were lower in the 1–3 months post-COVID-19 infection group. At 1–3 months post recovery from COVID-19 there was an increase in CD45RA−CCR7+ central memory CD4+ T-cells (e), and an increase in CD45RA+CCR7−CD57+CD28− terminally differentiated CD8+ T-cells (f), compared to individuals recovered from other respiratory infections, but these differences were not apparent in individuals who had recovered from COVID-19 6–9 months prior. (g) Levels of circulating regulatory T-cells (measured as a % of CD4+ T-cells) were higher in individuals 1–3 months post COVID-19 infection. Each participant is indicated by a single data point: other respiratory infection n = 11; 1–3 months post COVID-19 infection n = 11–13; 6–9 months post COVID-19 infection n = 8. ns—not statistically significant. Multiple group comparisons were tested using Welch’s One-Way ANOVA and the Games–Howell post-hoc test; bars are presented as mean ± standard deviation. * p < 0.05.
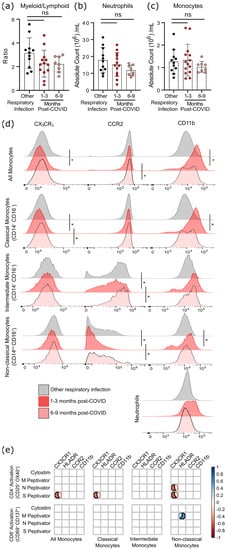
Although six months after SARS-CoV-2 infection there was a statistical trend towards a lower ratio of myeloid to lymphoid cells, this was due to a non-significant decrease in neutrophil numbers rather than changes in the number of monocytes (
Figure 5a–c). However, as circulating monocytes are a sensitive marker of chronic inflammation, we assessed monocyte subsets, as well as their expression of migratory and activation markers (
Figure 5d,
Supplementary Tables S4 and S5). Classical monocytes (CD14
+CD16
−) expressing CCR2 are the first to leave the bone marrow. They have a half-life in the circulation of less than 24 h, since they are either recruited to sites of acute inflammation in response to CCL2/monocyte chemoattractant protein-1 (MCP-1), or differentiate into CX
3CR
1-expressing intermediate (CD14
+CD16
+) monocytes
[15][16][24,25]. Classical monocytes increase in the circulation during acute infection so, as expected, there was no difference in the number of circulating monocytes after COVID-19 infection had resolved (
Figure 5c). At 1–3 months after infection, levels of CCR2 were lower on intermediate and non-classical monocyte populations (
Figure 5d), implying that cells with the highest levels of CCR2 emigrated from the circulation.
Figure 5. Evidence of sustained cellular inflammation after mild SARS-CoV-2 infection. (a) There was a trend towards a decreasing ratio of myeloid to lymphoid cells after SARS-CoV-2 infection, compared to individuals recovered from other infections, which was driven by a decrease in circulating neutrophils (b). Although total monocyte numbers did not change after infection (c), surface expression of the migratory markers CX3CR1 and CCR2 decreased transiently (d). Concurrent increases in surface expression of the migration and activation marker CD11b implies that the monocytes were activated. (e) Correlation analysis (Spearman’s correlation) of SARS-CoV-2 specific CD4+ and CD8+ T-cell responses with measures of monocyte activation and migratory potential. Multiple group comparisons in (a–d) were tested using Welch’s One-Way ANOVA and the Games–Howell post-hoc test; in (a–c) bars are presented as mean ± standard deviation, and each dot indicates a participant. The spread of expression of monocyte surface markers in d was visualized by concatenating uncompensated CD45+CD19−CD3−CD56−CD11b+HLADR+CD14+ events in FlowJo for each infection group prior to overlaying geometric mean fluorescence intensity expression data from all participants onto the same histogram plot. Other respiratory infection (grey) n = 11, 1–3 months after COVID-19 infection (red) n = 14, 6–9 months from COVID-19 infection (pink) n = 8. ns—not statistically significant. Data in (e) were assessed with the rcorr function in the Hmisc package in R, and only statistically significant associations are shown. * p < 0.05.
In general, the chemokine receptor CX
3CR
1 is expressed more highly on intermediate and non-classical (CD14
lowCD16
+) monocytes, and is associated with recruitment to the tissues or vasculature and repair of damage in response to CX
3CL
1/fractalkine
[17][18][26,27]. A transient decrease in CX
3CR
1-expressing classical monocytes was found 1–3 months post COVID-19 infection, which likely indicates that monocytes with the highest levels of CX
3CR
1 (and therefore the most responsive to CX
3CL
1) had emigrated from the circulation. Expression of the integrin CD11b was also transiently increased on monocytes at 1–3 months post-symptom onset, but not neutrophils, providing further evidence of transient but systemic immune activation, and possible changes in the migratory capacity of monocytes after mild SARS-CoV-2 infection.
Changes in monocyte activation markers could be due to the increase in basal inflammation, or could be proportionate to the SARS-CoV-2 specific immune response. We found that decreasing CX3CR1 expression was most strongly associated with the percentage of S-antigen specific CD4+ T-cells (p = 0.0389), and that there was a strong association between M-antigen specific CD8+ T-cells and human leukocyte antigen-DR isotype (HLA-DR) expression on non-classical/patrolling monocytes (p = 0.0198) (Figure 5e). There was no relationship between polyclonal T-cell activation (i.e., Cytostim) and myeloid activation, implying that these changes are not due to the general increase in T-cell activation observed in convalescent patients, but rather SARS-CoV-2 specific responses.