Your browser does not fully support modern features. Please upgrade for a smoother experience.
Please note this is a comparison between Version 1 by Xianbo Jia and Version 2 by Rita Xu.
Grazing-fed cattle are free-ranged on pastures with grass as the main feed, while feedlot-fed cattle are raised in feedlots with grains as their main feed.
- fecal microbioa
- grazing cattle
- Angus beef
1. Introduction
Grazing-fed cattle are free-ranged on pastures with grass as the main feed, while feedlot-fed cattle are raised in feedlots with grains as their main feed. The grass is low in energy but high in fiber, on the contrary, grains are high in energy and easy to digest. Thus, there are significant differences between the two feeding methods in digestibility, growth rate and meat quality. Compared to feedlot-fed beef, grazing-fed beef has lower fatty acid content and higher vitamin content [1]. Because nowadays people are concerned about energy and nutritional balance, consumers are increasingly favoring grazing-fed beef [2]. The proportion of grazing-fed cattle breeding has been gradually increasing as a result of this consumer preference.
Cattle gut microbes interact with their host and participate in the host’s physiological activities such as food digestion, energy metabolism and nutrient absorption, which are closely related to the healthy growth state and methane emissions of the host. Cattle gut microbes are affected by various factors, among which the composition and nutrition of the diet is a key factor in shaping its community structure, abundance and activity. Firmicutes, Bacteroidetes, Proteobacteria, TM7 and Actinobacteria were the main dominant phylum in cattle feces, and their abundance changed significantly with different diets [3]. Firmicutes was the first dominant phylum followed by Bacteroidetes, Proteobacteria, TM7 and Actinobacteria in moderate grain and high grain diets, while Firmicutes was the first dominant phylum followed by TM7, Actinobacteria, Proteobacteria and Bacteroidetes in silage/forage diets [4]. The fecal Firmicute:Bacteroidetes ratio was smaller when beef were fed more than 10% of dietary distiller grain compared with that of a corn diet [5]. There is a tendency to a greater relative abundance of Bacteroidetes but lesser Firmicutes in fecal matter after adding antibiotics or dried yeast to the beef diet [6]. Firmicutes, Bacteroidetes, and Verrucomicrobia were also the dominant phyla in yak, and the Firmicute:Bacteroidetes ratio was significantly decreasing from winter grassland to feedlot feeding [7]. In dairy cattle, diet was the most important parameter to explain fecal microbiota richness, and fecal microbiota of mixed (forage and concentrate) diet was more richness than that of dry forage diet [8].
2. Gene Sequencing Data Summary
The V3–V4 hypervariable regions of 16S rRNA gene were sequenced to fecal microbial communities of 12 Angus cattle. A total of 1,194,599 raw paired-end reads were generated from 12 samples (average: 99,550 ± 26,487, range: 60,156–145,482). And then 1,113,170 effective tages were obtained from 12 samples (average: 92,764 ± 24,560, range: 55,212–134,921) with an average of 411.75 bp per tag after the merging overlapping paired-reads, quality filtering and removing of chimeric sequences. According to the 97% sequence similarity, 775 OTUs were computationally constructed with 687.92 ± 21.48 (range: 659–721) as the mean number of OTUs per sample (Figure 1).
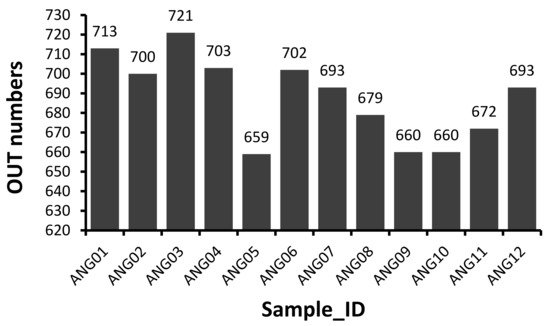
Figure 1. Distribution of 16S OTU number of each sample.
These 775 OTUs were taxonomically assigned to bacterial 12 phyla, 19 classes, 25 orders, 54 families, 141 genera, and 145 species.
3. Analysis of Bacterial Diversity
The alpha diversity (observed species and Shannon diversity index) was calculated to estimate species richness and diversity in the 12 fecal microbiota samples (Figure 2). There was no statistically significant difference between group F and group G (Figure 2A, p = 0.054 of Kruskal-W allis test) in observed species, and a significant difference between group F and group G (Figure 2B, p = 0.025 of Kruskal-W allis test) in Shannon diversity index, which indicated that there was a similar species richness between group F and group G, while a higher species diversity in group F.
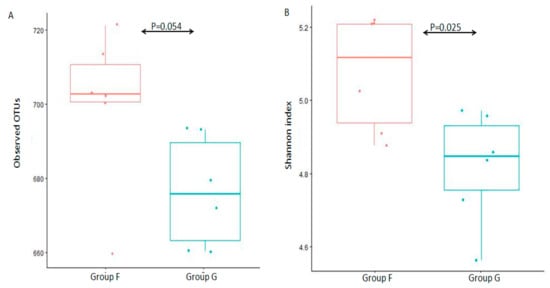
Figure 2. Box-plot representation of alpha diversity. Fecal microbiota were evaluated by the number of observed OTUs (A) and Shannon index (B) between group F and group G.
Principal coordinated analysis (PCoA) based on the binary Jaccard and Bray Curtis methods of beta diversity were further used to analyse compositional differences in fecal microbiota between group F and group G. The animals clustered together according to their particular group, suggesting a compositional shift with respect to community membership and structure between different groups. Both Jaccard and Bray-Curtis distance-based PCoA showed a significant difference between group F and group G (Figure 3, ANOSIM, p < 0.05), which indicated that each group hosts its own distinct bacterial community.
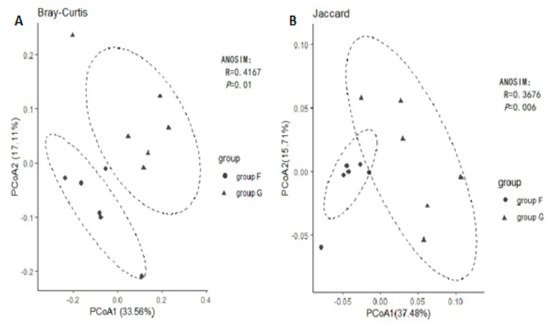
Figure 3.
Principal Coordinates Analysis (PCoA) using Bray-Curtis distance (
A
) and Jaccard distance (
B
).
4. Analysis of Bacterial Taxonomy and Function
The taxonomic annotation at the phylum level showed that the common bacterial phyla of fecal microbiota in beef cattle were Firmicutes (with an average relative abundance of 60.61%), Bacteroidetes (28.32%), Verrucomicrobia (7.96%), Spirochaetes (0.91%), Cyanobacteria (0.84%), Proteobacteria (0.70%), Patescibacteria (0.25%), Tenericutes (0.22%), Actinobacteria (0.11%), and Elusimicrobia (0.04%), respectively (Figure 4A). The relative abundance of Firmicutes, Cyanobacteria and Elusimicrobia was significantly higher (p < 0.05) in group F compared with group G, while Patescibacteria was significantly lower (p < 0.05) in group F. At the genus level, the abundant genus was Ruminococcaceae_UCG-005 (13.30%), Romboutsia (8.82%), Akkermansia (7.96%), Rikenellaceae_RC9_gut_group (7.46%), Prevotellaceae_UCG-003 (4.83%), [Eubacterium]_coprostanoligenes_group (4.82%), Paeniclostridium (4.81%), Ruminococcaceae_UCG-010 (4.63%), Ruminococcaceae_UCG-013 (3.73%) and Bacteroides (3.44%), respectively (Figure 4B). The relative abundance of Romboutsia, Paeniclostridium, [Eubacterium]_coprostanoligenes_group, Ruminococcaceae_UCG-010 and Ruminococcaceae_UCG-013 was significantly higher (p < 0.05) in group F compared with group G.
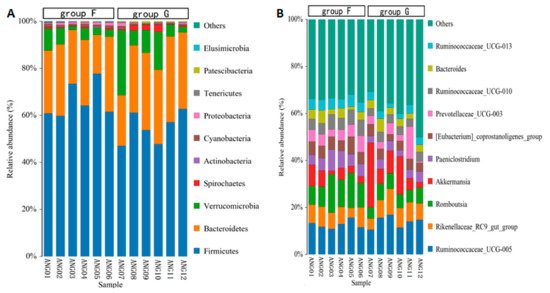
Figure 4.
Relative abundance of fecal microbiota at the phylum level (
A
) and at the genus level (
B
).