Your browser does not fully support modern features. Please upgrade for a smoother experience.
Please note this is a comparison between Version 3 by Amina Yu and Version 2 by Amina Yu.
The raccoon dog (Nyctereutes procyonoides) is a highly invasive species, therefore knowledge regarding the population size, trends and spatial distribution is important for species assessment and for the planning of control measures. And the raccoon dog (Nyctereutes procyonoides) is one of the most frequently killed species on Lithuanian roads.
- Nyctereutes procyonoides
- roadkill-based survey
- hunting bag
- density
- Lithuania
1. Introduction
For effective population management, reliable data on population size and/or density are essential. When such data are not available, trends in the relative abundances, expressed as indices, are very important for evaluating the effectiveness of management efforts. This is equally important for game, small game, large carnivores and invasive mammals. However, there is a cost element to the accuracy of data [1][2], with the costs of higher accuracy sometimes becoming unacceptable. New recently developed methods, such as drone surveys, camera counts and surveys based on DNA analysis, can be somewhat expensive, but equally so too can traditional groundwork by qualified persons [3][4].
Following on from this, the possibility of using hunting bag records as an indicator of the population size of selected species has been discussed for a long time (see [5][6]). This discussion on the suitability of the hunting bag (or hunting statistics) as a proxy for population status is still ongoing [7][8]. The general conclusion regarding the suitability of this method is positive, despite possible sources of bias, such as weather factors [9], habitat conditions [10], length of the hunting season [11], non-random choices made by hunters [8] and non-response of hunters regarding bag data [12]. Despite these factors, the overall consensus is that hunting statistics may be used as a complimentary method to surveys [13].
There are cases when biases within these statistics may be explainable. In Lithuania, the correlation between the raccoon dog (Nyctereutes procyonoides) population numbers and the hunting bag was negative in the period of 1984–1990. The first years of this period were known as the “golden years of the fur market”. Hunters earned good money supplying raccoon dog pelts. There was also additional hunting to supply a considerable black market in furs. The second reason for the increased intensity of hunting of raccoon dogs was the introduction and rapid expansion in the numbers of hunting terriers, these being able to chase raccoon dogs both above and underground very effectively. However, after 1990, at the beginning of country’s independence, the hunting industry declined and switched its focus primarily to ungulates; therefore, the raccoon dog hunting intensity significantly decreased. Later on, the fur market shrunk considerably and the hunting intensity of the species returned to the pre-1984 period (E. Tijušas, unpubl.). Another method to estimate the population numbers or densities of vertebrate species is through the use of roadkill counts as a proxy for these parameters [14][15][16]. It should be borne in mind however that considerable biases may exist in the data due to the varying duration and frequencies of road counts in different studies, some being done daily or weekly, others on a monthly or seasonal basis [17][18][19][20]. The methods of roadkill registration can also skew the quality and reliability of results, this frequently depending on whether data is obtained through rigorous scientific survey and/or police registrations [21][22], or through crowdsourcing or citizen science records [23][24]. Various environmental factors, such as land use, proximity of forest, etc. [22] can also impose bias on the data, as can changes in road management, traffic intensity and measures to reduce animal-vehicle collisions, such as fencing. However, even allowing for all of these possible biases, roadkill analysis is accepted as a valuable method for monitoring wildlife populations [25].
As a highly successful invasive mammal species [26], we focused our study on the raccoon dog. During the second half of the 20th century and the beginning of 21st century, this species spread from west Russia to western Europe, reaching Spain and the Netherlands [27]. However, contrary to that stated by [28], the species is not established in Great Britain (https://www.gbif.org/species/2434552, accessed on 12 September 2021). To date, the raccoon dog has already become established in 27 countries in Europe and is still expanding its range. As a result, it is listed as an EU species of concern [28]. Though formerly managed as a valuable source of pelts, the current goal of management is its eradication, therefore knowledge of trends in the population is required to determine the effectiveness of the eradication program. In Lithuania, despite the need for such information, raccoon dog surveys have not been conducted since 1997, thus there is a lack of information on the population numbers or trends in abundance. Though rarely included in the roadkill database of the Lithuanian Police Traffic Supervision Service, it is the case that raccoon dogs are the most numerous roadkill species as registered by professional biologists in Lithuania [21].
As shown by Saeki and Macdonald [29], raccoon dog roadkills, after adjustment for traffic intensity, may be used as a proxy for population trend. To assess this, we analysed data of raccoon dog numbers according to the earlier surveys, to hunting records in the country (both at the district and hunting area levels) and to roadkills of the species. Using hunting records at the best spatial resolution, we tested whether a correlation existed with the roadkill distribution and, if so, how strong it was. Based on Schwartz et al. [25], we aimed to discover whether the distribution and numbers of raccoon dog roadkills, registered on predefined routes and then overlaid with the hunting statistics, could be used to monitor population numbers and trends.
2. Temporal and Road Type-Based Trends of Raccoon Dog Roadkills
Although highly significant (F5,3229 = 25.0, p < 0.0001), the GLM model explained only 3.6% of the raccoon dog index variance. Individually, all tested factors were significant at p < 0.001, with the strongest influence being study month (F1,3229 = 84.6, eta-squared = 0.026) and the weakest being study year (F1,3229 = 15.2, eta-squared = 0.005) and road type (F1,3229 = 6.4, eta-squared = 0.006).
By year, the highest raccoon dog roadkill indices were recorded in 2012 (0.009 ± 0.003 ind./km/day), significantly exceeding those in 2018 and 2019 (Tukey honestly significant difference (HSD), p < 0.02), and in 2013 (0.011 ± 0.001 ind./km/day), exceeding those in 2015–2020 (HSD, p < 0.01–0.001). Low roadkill indices in 2002–2006 should not be compared with the other years, as both registration methods were not used in these years. Decreased roadkill indices in 2017–2019 (Figure 31) were significantly lower than those in 2008, 2009, 2013 and 2014 (with p < 0.05 or higher). By month, the highest raccoon dog roadkill indices were recorded in August (0.014 ± 0.001 ind./km/day) and September (0.012 ± 0.001 ind./km/day), significantly (p < 0.05–0.001) exceeding those recorded in other months (Figure 31).
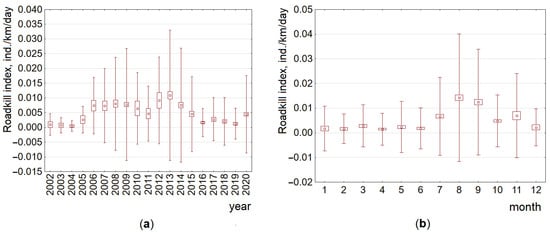
Figure 31. Raccoon dog roadkill trends by year (a) and by month (b) at the country scale, 2002–2020. Data from the Lithuanian Police Traffic Supervision Service in 2002–2020 and the Nature Research Centre in 2007–2020 are pooled and presented as averages, SE (box) and SD (whiskers).
Finally, roadkill indices on the main roads characterised by higher AADT (0.007 ± 0.0004 ind./km/day) exceeded those on the national roads (0.005 ± 0.0004 ind./km/day, Tukey HSD, p < 0.005), but did not exceed those on regional roads (0.008 ± 0.003 ind./km/day).
We also checked whether the yearly sampling effort was correlated with the average raccoon dog roadkill index (Figure S2). While the number of the driven routes was very moderately correlated with the roadkill (r = 0.37), the total length of the route per year and the average length of the route was not correlated (r = 0.10 and r = 0.13 respectively, none of the correlations significant). The raccoon dog roadkill index was moderately correlated with monthly sampling (Figure S3), namely the number of driven routes (r = 0.54) and the total length of the route (r = 0.52), but not significantly (p = 0.07 and p = 0.08, respectively). As a result, we cannot interpret these trends as promoting minimum sampling effort as the intended method.
3. Population Numbers, Hunting Bag and Roadkills of the Raccoon Dog at the Country Scale
At the country scale, the correlation between the population numbers and the hunting bag in the period 1965–1997 was positive (r = 0.88, p < 0.001). For the graphic representation, refer to Figure S1. However, there was a period in which this relationship was the opposite (1984–1990, r = –0.38). If this period is excluded, the dependence of the hunting bag on the population size is linear (r = 0.96, p < 0.001).
The presence of this dissonant period did not allow a true approximation of the population size from the hunting bag data alone, as the proportion of hunted animals may have significantly differed even if the number of hunted animals remained the same (Figure S4). We are not able to state whether the current situation is closer to the 1984–1990 period or to the years either side of this period. Thus, with the hunting bag being close to 2000 individuals, the proportion of the population that were hunted could be 15–20%, but could also be 40%, i.e., differing hunting intensities. The analysis of changes of hunting intensity, however, is beyond of the scope of the current study. Furthermore, no raccoon dog surveys were carried out after 1997.
The roadkill index, averaged for the country scale, was significantly correlated with the hunting bag in 2002–2020 (r = 0.50, p < 0.05), mainly based on the correlation of the roadkill index with the main roads (r = 0.56, p < 0.025). In the period 2007–2020, with increased roadkill count intensity, these correlations were higher (r = 0.54, p < 0.05 and r = 0.62, p < 0.025 respectively). In the years later than 2012, the correlations were similar for the main and national roads (r = 0.70 and r = 0.69, both p < 0.05), while the roadkill and hunting bag correlated (r = 0.64) for the regional roads, but not significantly (Figure 42). At the country scale, roadkill can be used as a basis for the prognosis of the next year hunting bag (Figure S5).
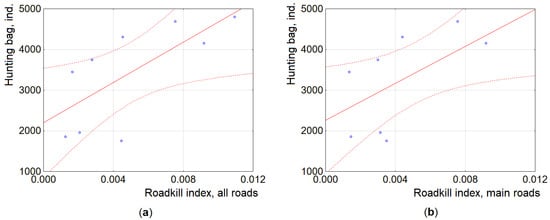
Figure 42. Correlation of roadkill index and raccoon dog hunting bag at the country scale, 2012–2020, presenting averages for all types of roads (a) and main roads (b). Dashed lines show 95% CI.
4. Raccoon Dog Hunting Bag and Roadkills at the Local Scale
At the level of hunting areas, the distribution of the number of hunted raccoon dogs and the densities of hunted animals in 2018–2021 was not even, with the highest numbers in the eastern part of the country (Figure 53). Comparing the numbers of the roadkilled raccoon dogs with the numbers (or densities) of hunted individuals in the hunting areas, no significant correlations were found (Pearson’s r = 0.06–0.10, all NS). Variation of the hunting bag and density of hunted individuals was similarly high in every year of the 2018–2020 period (Figure S6), and no correlations were found (r = −0.01–−0.02).
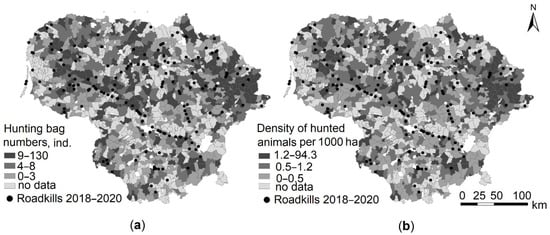
Figure 5.3 Spatial distribution of raccoon dog hunting bag numbers (a) and density of hunted animals (b) compared to roadkills at the local level in 2018–2020. White colour denotes territories of towns and cities, excluded from the hunting areas.
Dynamics of the raccoon dog roadkill index on the A14 main road by year and by month (Figure 64) in general corresponded to that at the country scale (see Figure 31); the highest indices were recorded in 2009 (0.005 ± 0.001 ind./km/day), 2013 (0.006 ± 0.001 ind./km/day) and 2020 (0.003 ± 0.0003 ind./km/day), as well as in August (0.007 ± 0.002 ind./km/day) and September (0.007 ± 0.001 ind./km/day). The unevenness of roadkill distribution was well expressed (Figure S7).
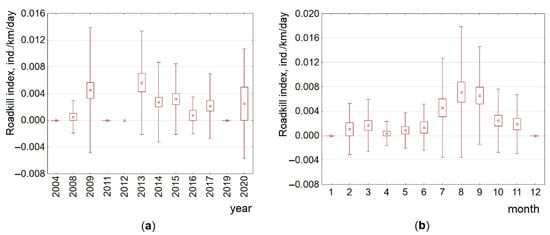
Figure 63. Raccoon dog roadkill trends by year (a) and by month (b) at the local scale on the A14 main road, 2004–2020. Data presented as averages, SE (box) and SD (whiskers).
The proportion of null counts on the A14 main road was not significantly different across years (G = 10.0, NS), despite the totals varying widely at a national level—for example, 25.0, 37.5, 29.3 and 18.4% of countrywide routes recorded roadkilled raccoon dogs in the years 2009, 2013, 2015 and 2017, while no roadkills were registered in 2011, 2012 and 2019 (the latter due to COVID-19 pandemic travel restrictions). At the level of months, raccoon dog roadkills were not registered on the A14 in December and January, while the proportion of roadkilled raccoon dogs differed significantly on this route in the other months (G = 36.80, p < 0.001), with the maximum proportion being in August and September (44.2 and 50.0% respectively), these significantly exceeding February to July (G = 17.49, p < 0.005).
References
- Rabe, M.J.; Rosenstock, S.S.; deVos, J.C., Jr. Review of big-game survey methods used by wildlife agencies of the western United States. Wildl. Soc. Bull. 2002, 30, 46–52.
- Feureisel, J. Economical approach on hunting. In Proceedings of the International Symposium on Hunting Modern Aspects of Sustainable Management of Game Population, Zemun-Belgrade, Serbia, 22–24 June 2012; Faculty of Agriculture: Zemun, Serbia, 2012; pp. 168–175.
- Wang, D.; Shao, Q.; Yue, H. Surveying wild animals from satellites, manned aircraft and unmanned aerial systems (UASs): A review. Remote Sens. 2019, 11, 1308.
- Prosekov, A.; Kuznetsov, A.; Rada, A.; Ivanova, S. Methods for monitoring large terrestrial animals in the wild. Forests 2020, 11, 808.
- Eberhardt, L.L. Appraising variability in population studies. J. Wildl. Manag. 1978, 42, 207.
- Myrberget, S. Hunting statistics as indicators of game population size and composition. Stat. J. U. N. Econ. Comm. Eur. 1988, 5, 289–301.
- Imperio, S.; Ferrante, M.; Grignetti, A.; Santini, G.; Focardi, S. Investigating population dynamics in ungulates: Do hunting statistics make up a good index of population abundance? Wildl. Biol. 2010, 16, 205–214.
- Aubry, P.; Guillemain, M.; Sorrenti, M. Increasing the trust in hunting bag statistics: Why random selection of hunters is so important. Ecol. Indic. 2020, 117, 106522.
- Rödel, H.G.; Dekker, J.J.A. Influence of weather factors on population dynamics of two lagomorph species based on hunting bag records. Eur. J. Wildl. Res. 2012, 58, 923–932.
- Raveling, D.G.; Heitmeyer, M.E. Relationships of population size and recruitment of pintails to habitat conditions and harvest. J. Wildl. Manag. 1989, 53, 108.
- Sunde, P.; Asferg, T. How does harvest size vary with hunting season length? Wildl. Biol. 2014, 20, 176–184.
- Aubry, P.; Guillemain, M. Attenuating the nonresponse bias in hunting bag surveys: The multiphase sampling strategy. PLoS ONE 2019, 14, e0213670.
- Soininen, E.M.; Fuglei, E.; Pedersen, Å.Ø. Complementary use of density estimates and hunting statistics: Different sides of the same story? Eur. J. Wildl. Res. 2016, 62, 151–160.
- Balčiauskas, L. The influence of roadkill on protected species and other wildlife in Lithuania. In Proceedings of the 2011 International Conference on Ecology and Transportation, Seattle, WA, USA, 21–25 August 2011; Wagner, P.J., Nelson, D., Murray, E., Eds.; North Carolina State University, Center for Transportation and the Environment: Raleigh, NC, USA, 2012; pp. 647–655.
- Canal, D.; Camacho, C.; Martín, B.; de Lucas, M.; Ferrer, M. Magnitude, composition and spatiotemporal patterns of vertebrate roadkill at regional scales: A study in southern Spain. Anim. Biodiv. Conserv. 2018, 41, 281–300.
- Tatewaki, T.; Koike, F. Synoptic scale mammal density index map based on roadkill records. Ecol. Indic. 2018, 85, 468–478.
- Rodríguez-Morales, B.; Díaz-Varela, E.R.; Marey-Pérez, M.F. Spatiotemporal analysis of vehicle collisions involving wild boar and roe deer in NW Spain. Accid. Anal. Prev. 2013, 60, 121–133.
- Bil, M.; Kubeček, J.; Sedonik, J.; Andrašik, R. Srazenazver.cz: A system for evidence of animal-vehicle collisions along transportation networks. Biol. Conserv. 2017, 213, 167–174.
- Garriga, N.; Franch, M.; Santos, X.; Montori, A.; Llorente, G.A. Seasonal variation in vertebrate traffic casualties and its implications for mitigation measures. Landsc. Urban Plan. 2017, 157, 36–44.
- Kučas, A.; Balčiauskas, L. Temporal patterns of ungulate-vehicle collisions in Lithuania. J. Environ. Manag. 2020, 273, 111172.
- Balčiauskas, L.; Stratford, J.; Balčiauskienė, L.; Kučas, A. Importance of professional roadkill data in assessing diversity of mammal roadkills. Transp. Res. Part D Transp. Environ. 2020, 87, 102493.
- Pagany, R. Wildlife-vehicle collisions—Influencing factors, data collection and research methods. Biol. Conserv. 2020, 251, 108758.
- Périquet, S.; Roxburgh, L.; le Roux, A.; Collinson, W.J. Testing the value of citizen science for roadkill studies: A case study from South Africa. Front. Ecol. Evol. 2018, 6, 15.
- Valerio, F.; Basile, M.; Balestrieri, R. The identification of wildlife-vehicle collision hotspots: Citizen science reveals spatial and temporal patterns. Ecol. Process. 2021, 10, 1–13.
- Schwartz, A.L.W.; Shilling, F.M.; Perkins, S.E. The value of monitoring wildlife roadkill. Eur. J. Wildl. Res. 2020, 66, 18.
- Kauhala, K.; Kowalczyk, R. Invasion of the raccoon dog Nyctereutes procyonoides in Europe: History of colonization, features behind its success, and threats to native fauna. Curr. Zool. 2011, 57, 584–598.
- CABI. Invasive Species Compendium. Nyctereutes procyonoides (Raccoon Dog). 2021. Available online: https://www.cabi.org/isc/datasheet/72656 (accessed on 12 July 2021).
- Tedeschi, L.; Biancolini, D.; Capinha, C.; Rondinini, C.; Essl, F. Invasive alien mammals of European Union concern. bioRxiv 2021.
- Saeki, M.; Macdonald, D.W. The effects of traffic on the raccoon dog (Nyctereutes procyonoides viverrinus) and other mammals in Japan. Biol. Conserv. 2004, 118, 559–571.
More