Your browser does not fully support modern features. Please upgrade for a smoother experience.
Please note this is a comparison between Version 1 by Mihai Machedon-Pisu and Version 2 by Conner Chen.
Land transport activities play an essential role within our society. At the same time, these activities generate directly huge amounts of pollutants due to vehicle operation, and indirectly, more pollution due to vehicle production and recycling as well as a significant consumption of energetic resources and raw materials. Looking back into the cars history, one can notice how their technological development was correlated with the socio-economic, environmental, and health context, and has paved the way for new policies and strategies for exploiting the available energy sources and materials with respect to the current automotive regulations.
- automotive sector
- energy
- raw materials
- sustainable deployment
- policies
- technological progress
1. Overview of the Technological Progress and Implications on Resources and Policies
The transport activities are mainly modulated by the evolution of technologies and science in the automotive domain. In the case of transport means evolution, such as cars, this is influenced by the technology that implements an essential component: the powertrain (ICEV, HEV, PHEV, FCV, BEV).
As a result of the evolution of technologies, there is a change in the demand for raw materials and energy. The operation efficiency is highlighted by the structural changes of the transport means, which is generally considered under the dome of “powertrain” technologies, with effects on the primary energy source: fossil fuels, electrochemical sources (FCV and BEV), and renewables.
The main performance metrics of vehicles are closely related to the on-board energy storage capacitance, type, and energy efficiency of the vehicle’s energy converter [1][17]. An important parameter is life span, which is below 10 years [2][19] for new vehicles such as EVs. On the other hand, as illustrated in Figure 13, the life span of light and heavy vehicles has increased worldwide to 11–13 years [3][20]. In addition, there is an increase in the weight of the vehicles, and as a consequence, heavy vehicles last 1–2 years more than light vehicles in Europe [4][21]. However, this implies also the use of more materials and energy resources. At the same time, as shown in Figure 4, the number of cars has increased substantially, as well as vehicle mileage [5][6][7][8][9,16,22,23].
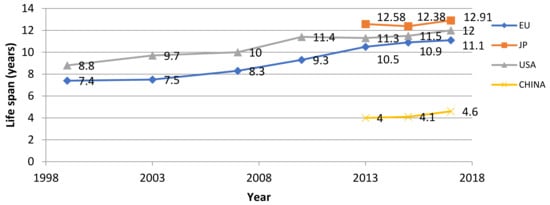
Figure 13.
Trends in the vehicles’ life span in the main world zones.
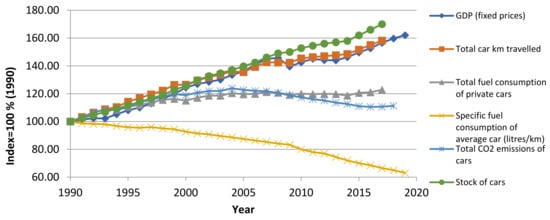
Figure 24.
Various performance metrics for vehicles during 1990–2019 in Europe.
On one hand, as a consequence of better car technologies, pollution due to greenhouse gases (GHG) was tempered, on the other, unfortunately due to such a GDP-driven evolution of vehicle sales, a substantial reduction of the pollution produced by transport systems will not be possible in the long term. Although the energy efficiency of engines and vehicles has in general improved, the power demand of cars in relation to their allowed consumption has also increased significantly, also as a result of legal constraints. This has led to improved comfort offered by vehicles, as well as to better dynamic characteristics. There is a clear improvement in the operation efficiency of vehicles, but pollution mitigation has a limited effect due the increase in the number of vehicles in circulation. Thus, the pollution curve cannot follow this significant positive evolution in energy efficiency.
The growth in GDP is also associated to the substantial increase in population and thus in the demand of energy and resources. Figure 35 illustrates the evolution of fuel resources (supply and demand of oil), as seen in [9][24]. Such an image, such as the one presented in [10][25], includes business-as-usual (BAU) assumptions for the future evolution in the use of oil resources and passenger cars. In addition, as a direct consequence of human activities—for example, the growing number of passenger cars sold per year, as presented in [11][26]—the change in land–ocean temperature is as dramatic as ever, leading to a highly negative environmental impact. Recently, starting from 2015, the Paris Climate Agreement recommended that the world must follow a path consistent with a 2 °C stabilization scenario in order to get a grip on global warming. As presented in [12][27], global emissions would not decline in absolute terms relative to 2015 levels let alone meet this scenario by 2030.
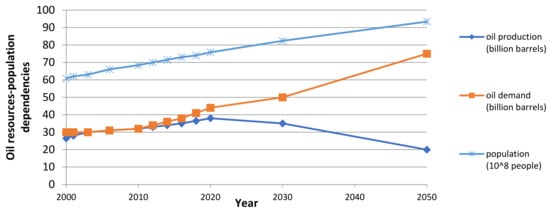
Figure 35.
Evolution of worldwide oil resources depending on world population dynamics: oil demand and production.
The society’s support for such climate goals, such as green energy, is of utter importance, and personal involvement plays an important part, as shown in [13][28]. The new European Union (EU) Green Deal, which aims to make Europe the first climate-neutral continent by 2050, should reveal the importance of taking the necessary actions to protect the soil by using tools such as Biodiversity Strategy and European Climate Law, as stated in [14][29]. Another study on the EU Green Deal [15][30] shows that current policies will achieve only 60% reductions in GHG by 2050 from 1990 levels, which is not sufficient to comply with the Paris Agreement. Therefore, more efforts are necessary in this sense, and so the Green Deal must accelerate the shift toward sustainable transport strategies that could result in quantifiable health benefits.
2. Overview of the European Standards and Implications on Environment and Health
Due to technological reasons (e.g., lack of infrastructure, reduced energy storage, low autonomy) and economic reasons (e.g., high property costs), BEVs, PHEVs, and FCVs have not yet managed to spread sufficiently on the market. The use of resources, which are related to the energy source and raw materials, and the consequences on the environment, are also of utter importance in this sense, especially in terms of human health. Unfortunately, only a small portion of primary energy sources are renewable [12][27].
Some exceptions refer to cases where clean energy is a relevant option, such as Norway and California, wherein societal efforts have been broad and better targeted. One can notice that the welfare of citizens plays a significant role, too. Alongside market considerations, one should also consider the industrial pollution that results from EV’s and FCV’s manufacture and electricity use. Unlike conventional cars that pollute more while being operated than when being produced, EVs pollute significantly also in the industrial stages [16][1].
More than over 200 years of industrialization took a toll on the environment and population’s health, and nowadays, the climate change problem is as stringent as ever. Moreover, air pollution due to industrial activities can cause serious damage to human health and environment [17][31], especially in terms of premature deaths [18][32]. In this regard, various legislative measures in all sectors producing air pollutants, such as GHG, have been proposed by the EU in [19][33]. According to the World Health Organization (WHO) [20][34], in 2016, 90% of the urban population was exposed to Particulate Matter (PM) concentrations that exceeded the maximum allowed values. In this respect, EU has adopted a comprehensive set of directives that follow most of the WHO guidelines for reducing the levels of PM, NOx, O3, SO2, CO, and benzene, among others [19][33]. These pollutants are compared in Figure 46a. According to [19][33], the main activities that cause pollution can be associated with domestic, industrial, electricity generation, and transport sectors, as estimated by the European Commission for Environment. As seen in Figure 46b, one of the main sources that contribute to air pollution is road transport.
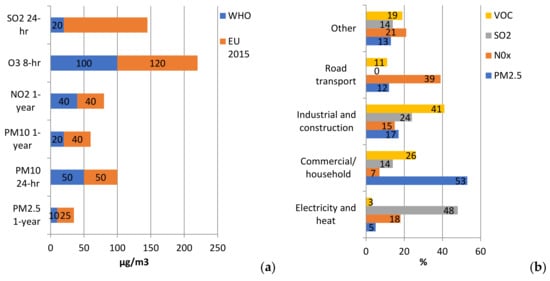
In terms of legislative practices at the European level, one should emphasize the steps undertaken in the direction of the management and the improvement of air quality, according to the EU directives [19][33]. The European emission standards for the automotive sector, such as passenger cars (Category M) and light commercial vehicles (Category N1 class III and N2), were developed circa 1993 and the latest Euro 6 standard targets the year 2021. The allowable limit values (g/km) for vehicles on diesel and gasoline refer to PM, NOx, and CO [21][35]. The reported values for PM2.5, PM10, NOx, CO, SO2, O3, Pb, benzene, and benzo-a-pyrene (BaP) at the European level start from 1999 until 2017, according to [22][36].
It is worthwhile to notice the evolution of stricter emission standards and air quality values at the European level, especially after 2011. Yet, it must be mentioned also that the values based on WHO guidelines have always been stricter, as seen in Figure 57. In fact, the latest European air quality reports show a significant discrepancy between countries that respect the latest European limit values in terms of PM2.5, PM10, and BaP but fail to meet the WHO guidelines. One must think about the recent automotive scandal from 2015 [23][37] and understand the need for imposing stricter limits on the air pollution resulted from transport activities, as depicted in Table 1.

Figure 57.
Evolution of Euro automotive regulations.
Table 1.
NOx limit and measurement values (g/km) for two Volkswagen car models.
| Model | United States | Euro 5–6 | |||
|---|---|---|---|---|---|
| Limit | West Virginia University Measurement | Limit Euro 5 | Limit Euro 6 | Measurement 2011 | |
| Jetta | 0.043 | 0.61–1.5 | 0.18 | 0.08 | 0.62 ± 0.19 |
| Passat | 0.043 | 0.34–0.67 | - | - | 0.62 ± 0.19 |
According to [22][36], it is also possible to illustrate the evolution of premature deaths attributable to PM2.5, NO2, and O3 within EU27/28 between 2011 and 2016 for a population varying from 502,960,000 to 510,180,000 inhabitants. In terms of the population’s health, this can be seen as a stagnation, which can be attributed to the lack of stricter limits implemented at the European level after 2011. There are only minor improvements: 14.2% for PM2.5, 10.5% for NO2, and 14.6% for O3, when comparing the values reported for 2016 to the values for the 2011–2015 period. As an important remark, considering only the pollution associated with the car’s operation as the sole or most relevant metric when opting for ‘cleaner’ electric vehicles can be very misleading. Similar statements were advertised by car manufacturers regarding diesel ICEVs, and the consequences in the past are known [23][37]. Other aspects such as human toxicity and other potentials [24][38] are just as important, as soil and water pollution also play an important role in defining both environmental and health risks, besides the more visible air pollution aspects.