With the growing concern about the spread of new respiratory infectious diseases, several studies involving the application of technology in the prevention of these diseases have been carried out. Among these studies, it is worth highlighting the importance of those focused on the primary forms of prevention, such as social distancing, mask usage, quarantine, among others. This importance arises because, from the emergence of a new disease to the production of immunizers, preventive actions must be taken to reduce contamination and fatalities rates.
- healthcare
- infectious disease
- information technology
- literature review
- transmission prevention
1. Introduction
From the emergence of new infectious diseases, new research studies are also being carried out in order to contribute to their treatment motivated not only because of health crisis, but also social and economic impacts. However, until new medications or vaccines are produced, preventive measures are recommended by health organizations in order to reduce transmission among the population, such as social distancing, mask usage, isolation and quarantine [8,9,10][1][2][3].
Being a topic of considerable importance, especially due to the social, health and economic impacts to society, studies focused on the application of technology in the primary forms of prevention of new infectious diseases have attracted much attention and concern from institutions and researchers.
The scope of this SLR was to identify relevant studies that adopt information technology solutions in the primary ways of preventing respiratory infectious diseases transmission/spread.
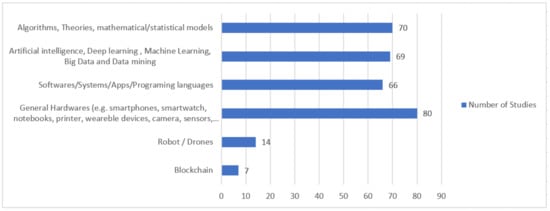
From the findings, it was possible to identify six application domain categories in which there was a greater trend in studies related to pandemic planning and, among the support mechanisms adopted, data and mathematical application-related solutions received greater attention.
2. Results and Discussions
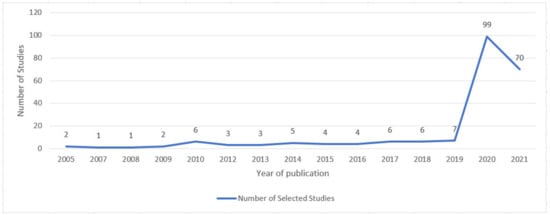
2.1. Demographic Data
Publication Venues and Citation Count
2.2. Study Quality Assessment
-
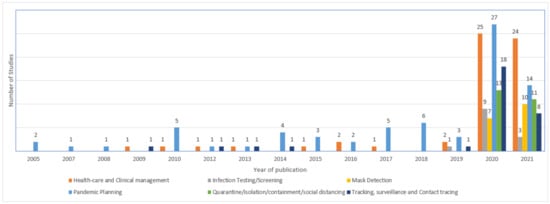
Healthcare and clinical management (CD1): Category that covers approaches that seek to adopt technological solutions focusing on healthcare, case investigation, medical supplies, among others like the ones that seek to diagnose infected individuals, monitor clinical status, predict clinical outcomes, and provide capacity for telemedicine services, virtual care, and hygiene surveillance.
-
Infection testing/screening (CD2): A category that covers approaches focusing on screening/testing individuals for diseases, either assessing for signs of disease in an apparently asymptomatic population, for example, or adopting technology with medical procedures to confirm the diagnosis in individuals.
-
Mask detection (CD3): Covers approaches that adopt information technology solutions aiming to detect people who are (or are not) using the protective mask.
-
Pandemic Planning (CD4): Covers approaches that aim at the identification/obtainment of new information that can be used or contribute to the prevention and/or control of transmission of infectious diseases, including anticipation of behaviors, transmissions, new outbreaks of epidemics, among others.
-
Quarantine/isolation/containment/social distancing (CD5): Category of approaches involving the application of technology in order to restrict the spread of infection through the contribution to social distancing, containment or isolation of indeciduous; for example, monitoring quarantine patients, restricting social contact using global positioning systems or mobile phone applications, among others.
| ID | Quality Assessment Question | Yes | Partially | No | |
|---|---|---|---|---|---|
| Category | Studies | ||||
| Q1 | Are the study objectives and goals clearly specified? | 218 (99.5%) |
1 (0.5%) |
0 | |
| CD1: Healthcare and Clinical management (59) | (0.0%) | ||||
| S4, S11, S14, S21, S24, S25, S27, S31, S37, S38, S39, S40, S56, S57, S58, S59, S60, S61, S64, S70, S77, S80, S88, S89, S92, S93, S95, S103, S104, S112, S123, S126, S127, S133, S137, S139, S140, S141, S150, S151, S157, S158, S160, S168, S171, S181, S182, S183, S187, S191, S192, S197, S202, S203, S205, S206, S207, S218, S219 | Q2 | Is the study context clearly defined? | 113 (51.6%) |
89 | |
| CD2: Infection Testing/Screening (14) | (40.6%) | 17 (7.8%) |
|||
| S26, S35, S65, S82, S118, S122, S128, S148, S159, S163, S177, S185, S193, S198 | Q3 | Does the research design support the objectives/goals of the study? | 135 (61.6%) |
71 (32.4%) |
13 (5.9%) |
| CD3: Mask Detection (16) | S6, S8, S47, S63, S74, S75, S76, S106, S107, S108, S121, S142, S143, S144, S152, S178 | Q4 | Does the study have an adequate description of the analysis of the data? |
| Level | Classification | Description | ||||
|---|---|---|---|---|---|---|
| 96 | ||||||
| (43.8%) | 67 | (30.6%) |
56 (25.6%) |
|||
| CD4: Pandemic Planning (75) |
S1, S2, S3, S5, S7, S15, S17, S23, S28, S29, S32, S36, S41, S43, S44, S45, S46, S48, S51, S53, S54, S55, S62, S66, S68, S71, S78, S81, S83, S85, S91, S96, S97, S98, S99, S100, S101, S102, S105, S111, S113, S116, S117, S120, S124, S125, S129, S130, S132, S138, S145, S146, S147, S153, S155, S156, S161, S164, S165, S169, S170, S173, S180, S186, S188, S189, S190, S199, S200, S201, S204, S209, S211, S215, S216 | Q5 | Does the study present a clear statement of the findings and provide enough data to support them? | 79 (36.1%) |
81 (37.0%) |
59 (26.9%) |
| CD5: Quarantine/isolation/containment/social distancing (24) | S10, S16, S19, S22, S30, S50, S52, S69, S79, S84, S90, S109, S110, S119, S131, S135, S167, S172, S174, S179, S184, S194, S195, S213 | Q6 | Do researchers critically examine potential bias and/or influence in the study? | |||
| CD6: Tracking, surveillance, and Contact tracing (31) | S9, S12, S13, S18, S20, S33, S34, S42, S49, S67, S72, S73, S86, S87, S94, S114, S115, S134, S136, S149, S154, S162, S166, S175, S176, S196, S208, S210, S212, S214, S217 | 3 |
- Tracking, surveillance, and Contact tracing (CD6): Include approaches that aim at the identification, tracking or tracing of individuals who might have come into contact with an infected person in order to tracks viral spread; for example, monitors the spread of infection across locations, or to prevent onward transmission by alerting those who came in contact with the positive case.
| 0 | No evidence | No evidence was presented regarding evaluation or validation | ||
| (1.4%) | ||||
| 33 | (15.1%) | 183 (83.6%) |
||
| Q7 | Study limitations are discussed explicitly? | 51 (23.3%) |
66 (30.1%) |
102 (46.6%) |
2.3. Question Analysis
2.3.1. Available Approaches (RQ1) and Application Domains (RQ2)
2.3.2. Adopted Support Mechanisms (RQ3)
| Category | Sub-Category | Support Mechanism | Studies |
|---|---|---|---|
| 1 | |||
| AnyLogic, Django Framework (1) | |||
| S2 | |||
| ArcGIS (3) | |||
| S28, S62, S208 | |||
| Autodesk Revit/Meshmixer, Rhino3D, AutoCAD, Grasshopper (4) | |||
| S83, S110, S188, S199 | |||
| AWS—Amazon Web | |||
| S25, S31, S39, S47, S74, S86, S109, S114, S121, S123, S134, S136, S137, S139, S185, S191, S192, S197, S198, S207, S219 | |||
| Printer and scan devices (3) | |||
| S110, S174, S218 | |||
| Spray/Dispenser devices (6) | |||
| S11, S82, S168, S191, S205, S219 | |||
| UV technology (e.g., UVC, UV Chip, UV Led, UV Light, UV ray) (7) | |||
| S11, S24, S38, S95, S127, S133, S148 | |||
| Example or demonstration | |||
| Robot/Drones | |||
| Robot/Drones/Unmanned Aerial Vehicles (UAV) (14) | |||
| S18, S22, S43, S80, S90, S127, S140, S167, S173, S183, S187, S198, S205, S218 | |||
| CS4: Blockchain | |||
| * | |||
| 1 | |||
| Blockchain (7) | |||
| S43, S67, S71, S117, S162, S173, S186 | |||
2.3.3. Available Evidence (RQ4) and Context Application (RQ5)
| Objective | Item | Objective | Item |
|---|
| Evidence Level | Context | |||||||
|---|---|---|---|---|---|---|---|---|
| Academic (121) | Industrial (98) | |||||||
| CS1: Data and Mathematical Application Related Solutions | Algorithms, Theories, Mathematical/Statistical Models | Bootstrap Method (1) | S170 | |||||
| General Data | Title | RQ5 | Context | |||||
| Q2 | ||||||||
| 0: No evidence (13) |
S3, S11, S20, S25, S53, S56, S70, S124, S126, S141, S150, S177, S181, | *1 | Dijkstra Algorithm (1) | S16 | ||||
| Author(s) | Q1 | Discrete Fourier Transform (DFT) model (1) | S65 | |||||
| Description of the Context | ||||||||
| Objective of the Study | ||||||||
| Services (e.g., software, and load Balancer, elastic container, lambda, Greengrass, others) (3) | ||||||||
| S12, S62, S137 | ||||||||
| 1: Example or demonstration (36) |
S1, S5, S9, S12, S26, S30, S31, S33, S36, S50, S67, S69, S79, S81, S82, S84, S87, S101, S107, S127, S133, S134, S140, S146, S163, S165, S166, S175, S179, S185, S191, S193, S197, S208, S213, S214, | *1 | Application description is provided with an example to aid its description | Publication Year | General Algorithms, mathematical models/equations (12) | |||
| 2 | Specialists Notes | Qualitative or textual assessments are provided. Example: advantages and disadvantages contrasts/comparation | S9, S34, S49, S52, S69, S94, S102, S130, S156, S162, S210, S214 | |||||
| Venue | ||||||||
| Bootstrap, Adobe Photoshop (1) | ||||||||
| 2: Specialists Notes (7) | S14, S47, S71, S72, S86, S174, S194,Q3 | |||||||
| S204 | ||||||||
| Description of the Research Project | ||||||||
| 3 | Experiment in laboratory | |||||||
| Business Model Canvas (BMC), Service Blueprint (1) | ||||||||
| * | 1 | |||||||
| 3: Experiment in laboratory (117) |
S2, S7, S8, S10, S13, S16, S18, S34, S40, S43, S44, S49, S51, S52, S54, S59, S62, S64, S66, S75, S80, S89, S90, S91, S94, S96, S98, S99, S100, S102, S103, S104, S105, S109, S112, S115, S119, S121, S122, S129, S132, S142, S145, S151, S153, S156, S158, S159, S161, S162, S164, S171, S172, S173, S180, S182, S186, S190, S200, S206, S209, S210, S211, S215, S219 | S4, S6, S17, S23, S37, S38, S39, S41, S60, S61, S65, S68, S74, S76, S77, S92, S95, S106, S108, S110, S111, S113, S116, S117, S118, S120, S123, S125, S128, S136, S138, S143, S147, S148, S152, S155, S160, S167, S170, S183, S184, S187, S188, S189, S195, S196, S198, S199, S202, S204, S216, S218 | Results are reached from simulations with artificial data in real experiments. Evidence collection is performed formally or informally. | K-nearest Neighbor Algorithm, Nearest-neighbour distance (2) | Paper Summary | Q4 | Analysis of the Data | S124 |
| 4: Empirical Investigation S13, S167 | ||||||||
(24) |
*1 | |||||||
| 4 | Empirical Investigation | Markov Model, Spatial Temporal Method, Graph Theory, NHPP, Monte Carlo (19) | S17, S18, S23, S34, S36, S44, S51, S53, S62, S85, S99, S101, S111, S116, S129, S149, S154, S215, S216 | |||||
| RQ1 | Approach | Multi-agent (Model/simulation), Equation-based model (13) | S2, S3, S4, S5, S7, S91, S96, S99, S100, S125, S132, S160, S211 | |||||
| Multiple Signal Classification (MUSIC) Algorithm (1) | S128 | |||||||
| Ethereum (1) | S67 | |||||||
| Q5 | Google Cloud Platform (2) | S62, S68 | ||||||
| Hadoop (1) | S42 | |||||||
| Hyperledger Fabric (1) | S117 | |||||||
| Conclusions Presentation | IOTA Tangle Platform (1) | S71 | ||||||
| S19, S22, S27, S28, S29, S32, S46, S55, S73, S83, S85, S88, S93, S130, S131, S135, S139, S154, S169, S176, S203, S205, S207, S212, | Optimal Control Theory (1)Kibana (Elasticsearch) (1) | S62 | ||||||
| Real context investigation of the behavior of the proposed approach | MATLAB (1) | |||||||
| 5: Strict analysis (22) | S113 | |||||||
| Microsoft Azure Cloud (2) | S70, S78 | |||||||
| NetLogo (1) | S4 | |||||||
| 5* | S161 | |||||||
| Regression models, Short-term Prediction, RMSE, MAE (5) | S15, S68, S128, S147, S169 | |||||||
| SEIR model, Grey Prediction Model, DSGE Algorithm, SLIR, SIS, SIR (24) | NLTK—Natural Language Toolkit (1) | S158 | ||||||
| Node.js (2) | S62, S137 | |||||||
| Node-RED and Grafana (1) | S136 | |||||||
| 1 | Strict analysis | Evaluation/validation of the study is performed using a formal methodology. Example: questions and variables definition for analysis after the application of the approach | OpenCV (2) | S109, S151 | ||||
| Ultimaker Cura (1) | S110 | |||||||
| Unity Platform (e.g., WebGL, 3D) (3) | S83, S131, S179 | |||||||
| RQ2 | Application Domain | Q6 | Critical Analysis Description | |||||
| RQ3 | Adopted Support Mechanisms | Q7 | Description of Limitations and Bias | |||||
| RQ4 | Level of Evidence | S21, S32, S55, S66, S91, S96, S97, S98, S116, S117, S129, S130, S145, S146, S153, S155, S161, S189, S190, S199, S200, S201, S209, S215 | ||||||
| Self-Propelled Entity Dynamics (SPED) model, LDS—Low Discrepancy Sequence (1) | S164 | |||||||
| Artificial intelligence, Deep learning, Machine Learning, Big Data and Data mining | Big Data (5) | S1, S42, S81, S123, S147 | ||||||
| Decision Tree, Regression Tree, CART (5) | S40, S41, S46, S123, S180 | |||||||
| DBSCAN—Density-Based Spatial Clustering of Applications with Noise (1) | S172 | |||||||
| Fuzzy Logic (3) | S125, S171, S192 | |||||||
| Heterogeneous Diffusion Network (1) | S154 | |||||||
| K-means (5) | S33, S44, S180, S214, S217 | |||||||
| LLA—Lexical Link Analysis (1) | S138 | |||||||
| Logistic Regression (10) | S27, S45, S46, S55, S104, S149, S154, S169, S170, S177 | |||||||
| Maximum Entropy Model (1) | S105 | |||||||
| Naive Bayes (2) | S27, S41 | |||||||
| NLP—Natural Language Processing (3) | S103, S137, S158 | |||||||
| Neural network (CNN, MTCNN, MobileNet, others), Feature Enhancement Module (FEM), Spatial Separable Convolution, SSD (41) | S6, S8, S10, S20, S40, S41, S45, S47, S48, S55, S57, S58, S59, S60, S61, S63, S64, S65, S70, S74, S75, S76, S88, S90, S106, S107, S108, S109, S112, S120, S121, S142, S143, S144, S152, S178, S182, S184, S185, S201, S206 | |||||||
| Random Forest, iForest (5) | S27, S33, S40, S41, S46 | |||||||
| Support Vector Machine (8) | S3, S27, S40, S41, S45, S46, S61, S104 | |||||||
| Vector Space Model (2) | S123, S141 | |||||||
| CS2: Software/Systems/Apps/Programing languages | Market Software/Platform (Proprietary or Free/Open Source) | Android Studio (1) | S71, S135WeChat, WhatsApp, WhatsApp Bot (4) | S93, S109, S111, S117 | ||||
| Wireshark Dumpcap (1) | S195 | |||||||
| Zoom Platform (1) | S207 | |||||||
| Mobile, Desktop, WEB or Cloud Application/Framework proposed as study contributions | Cloud Application (3) | S12, S31, S35 | ||||||
| Desktop Application (4) | S51, S83, S96, S113 | |||||||
| Mobile Application (24) | S12, S20, S33, S63, S70, S72, S73, S84, S92, S111, S115, S119, S123, S135, S150, S151, S165, S166, S175, S192, S194, S203, S204, S214 | |||||||
| Web Application/Framework (21) | S2, S14, S28, S29, S37, S41, S42, S62, S67, S68, S78, S82, S93, S123, S131, S158, S165, S166, S176, S204, S214 | |||||||
| Programming Languages | C#, C++ (2) | S83, S96 | ||||||
| Java (J2EE, J2ME, JNI, Hibernate) (5) | S14, S28, S37, S73, S92 | |||||||
| JavaScript Libraries/ API (e.g., jQuery, ReactJS, AJAX, Google Web Toolkits, Google Maps) (9) | S2, S67, S28, S29, S72, S151, S166, S196, S204 | |||||||
| PHP (2) | S166, S204 | |||||||
| Python (6) | S2, S83, S96, S158, S199, S216 | |||||||
| Visual Basic (1) | S51 | |||||||
| Diseases | Studies | |
|---|---|---|
| Infectious diseases in general (using or not some disease as examples) (62) |
S1, S3, S4, S5, S13, S21, S23, S28, S29, S36, S37, S42, S49, S53, S76, S85, S96, S101, S103, S105, S111, S113, S117, S118, S122, S123, S124, S126, S128, S129, S130, S132, S133, S146, S147, S149, S150, S151, S154, S156, S159, S160, S161, S162, S164, S165, S168, S172, S173, S177, S181, S182, S186, S187, S196, S197, S204, S208, S211, S213, S215, S219 | |
| COVID-19 (139) |
S6, S8, S9, S10, S11, S12, S14, S15, S16, S18, S19, S20, S22, S24, S25, S26, S27, S30, S31, S32, S33, S34, S35, S38, S39, S40, S41, S43, S44, S45, S46, S47, S50, S52, S54, S55, S56, S57, S58, S59, S60, S61, S62, S63, S64, S65, S66, S67, S68, S69, S70, S71, S72, S73, S74, S75, S77, S78, S79, S80, S81, S82, S83, S84, S86, 87, S88, S89, S90, S92, S93, S94, S97, S98, S104, S106, S107, S108, S109, S110, S112, S119, S120, S121, S127, S131, S134, S135, S136, S137, S138, S139, S140, S141, S142, S143, S144, S145, S148, S152, S153, S157, S158, S163, S166, S167, S169, S170, S171, S174, S175, S176, S178, S179, S180, S183, S184, S185, S188, S189, S191, S192, S193, S194, S195, S198, S199, S200, S202, S203, S205, S206, S207, S209, S210, S214, 216, S217, S218 | |
| Influenza (H1N1, H5N1, and others) (17) | ||
| Data Base Management System | ||
| Firebase (4) | ||
| S71, S73, S92, S194 | ||
| Influx DB (1) | ||
| S136 | ||
| MongoDB (2) | ||
| S2, S42 | ||
| MYSQL (3) | ||
| S78, S123, S204 | ||
| MS Access (1) | ||
| S51 | ||
| Oracle (1) | ||
| S29 | ||
| PostgreSQL (2) | ||
| S37, S208 | ||
| S2, S7, S17, S48, S51, S91, S99, S100, S102, S114, S115, S116, S125, S155, S190, S201, S212 | ||
| Neo4j (1) | ||
| S12 | ||
| SQLite (1) | ||
| S83 | ||
| CS3: Internet of Things and Hardware | ||
| * | ||
| 1 | ||
| Wearable devices (e.g.,smartwatches, smartphones, smartbelt, and others) (17) | ||
| S19, S27, S40, S54, S56, S69, S70, S79, S111, S115, S139, S157, S163, S175, S181, S195, S213 | ||
| Sensors (mobile or fixed), Cameras, RFID (Radio Frequency Identification) |
Cameras—photo and video (Fixed and mobile) (11) |
S30, S74, S82, S106, S109, S118, S121, S122, S128, S193, S194 |
| Environment Sensors (e.g., Passive Infrared (PIR) Sensor, and others) (26) | S11, S16, S21, S30, S38, S47, S50, S54, S74, S77, S82, S89, S109, S114, S121, S122, S126, S127, S135, S136, S172, S177, S185, S191, S192, S193 | |
| Klebsiella pneumoniae (1) | RFID (Radio Frequency Identification) devices (9) | S13, S27, S30, S35, S50, S182, S185, S192, S196 |
| Wearable and/or mobile body sensors (e.g., temperature, cough, oxygen, pressure, heart rate measurement) (14) | S21, S25, S26, S27, S31, S35, S44, S69, S86, S87, S118, S157, S159, S181 | |
| Others (e.g., Printers, Spray, Chips, GPS/GSM/Bluetooth devices, WIFI routers, UV tech, WBAN, and others) | Bluetooth/WIFI/GPS/Wireless devices (e.g., module, routers, access point, receivers, SMS gateways, GPS chips, and others) (21) | S9, S18, S26, S31, S44, S50, S84, S86, S123, S124, S134, S136, S142, S148, S172, S175, S194, S196, S207, S212, S219 |
| Desktops, Laptops, and computer accessories (e.g., memory cards, processors, and other boards) (21) |
| S195 |
| S15, S21, S24, S35, S42, S45, S48, S57, S58, S63, S78, S97, S114, S137, S144, S149, S157, S168, S178, S192, S201, S217 |
3. Conclusions
References
- University of Puget Sound. Preventing the Spread of Infectious Diseases. Available online: https://www.pugetsound.edu/student-life/counseling-health-and-wellness/health-topics/preventing-the-spread-of-infec (accessed on 14 April 2021).
- World Health Organization (WHO). Considerations for Quarantine of Individuals in the Context of Containment for Coronavirus Disease (COVID-19) Interim Guidance. 19 March 2020. Available online: https://apps.who.int/iris/bitstream/handle/10665/331497/WHO-2019-nCoV-IHR_Quarantine-2020.2-eng.pdf (accessed on 14 April 2021).
- Harvard Health Publishing. Preventing the Spread of the Coronavirus: Physical Distancing, Masks, and Other Preventive Measures. Harvard Medical School. 9 April 2021. Available online: https://www.health.harvard.edu/diseases-and-conditions/preventing-the-spread-of-the-coronavirus (accessed on 14 April 2021).
- Chen, L.; Babar, M.A.; Cawley, C. A Status Report on the Evaluation of Variability Management Approaches. In Proceedings of the 13th International Conference on Evaluation and Assessment in Software Engineering, EASE’09, Swindon, UK, 20–21 April 2009; pp. 118–127.
- Dyba, T.; Dingsoyr, T. Empirical Studies of Agile Software Development: A Systematic Review. Inf. Softw. Technol. 2008, 50, 833–859.
- Kitchenham, B.A.; Charters, S. Guidelines for Performing Systematic Literature Reviews in Software Engineering; EBSE Technical Report Version 2.3, EBSE-2017-01; Software Engineering Group, Keele University: Keele, UK; University of Durham: Durham, UK, 2007.