Your browser does not fully support modern features. Please upgrade for a smoother experience.
Please note this is a comparison between Version 1 by Ki Hyun Kim and Version 2 by Vivi Li.
Phaseolus multiflorus var. albus (Leguminosae), commonly known as “white kidney bean”, is a twining perennial vine whose fruit has been used as a popular food worldwide owing to its high nutritional content, in terms of proteins, carbohydrates, fats, and vitamins.
- Phaseolus multiflorus var. albus
- Leguminosae
- white kidney bean
- denatonium
- osteogenesis
1. Introduction
Phaseolus multiflorus var. albus, also known as white kidney bean, is a twining perennial vine belonging to the family Leguminosae. It has been cultivated for many purposes worldwide, especially in China [1]. Historically, leguminous plants have been popular worldwide because they are abundant in proteins (16–33%), minerals, carbohydrates, fats, vitamins, and phytoestrogens [1][2][1,2]. Pharmacological studies of plants belonging to the genus Phaseolus have reported that its extracts exhibit various therapeutic properties, including antidiabetic [1][2][1,2], antiobesogenic [3], antiproliferative [4], antioxidant, and gastroprotective activities [5]. In addition, previous studies on plants belonging to the genus Phaseolus have shown that their nutritional contents possess insecticidal, immunomodulatory, antitumor, and antifungal activities [4][5][4,5]. Previous biological studies on P. multiflorus var. albus reported that white kidney bean (P. multiflorus var. albus) treatments induced glucose reduction and weight loss in a diabetes-induced mouse model compared to the control group [6]. In this context, many clinical trials on the antiobesity effect of P. multiflorus var. albus have revealed that the ingestion of white kidney beans induces weight loss and waist circumference reduction [7]. In a recent study, P. multiflorus var. albus extract showed dose-dependent inhibitory activity against α-amylase [8]. Despite the health benefits of P. multiflorus var. albus extract, few studies have been carried out on its chemical constituents. Only a few previous phytochemical investigations of P. multiflorus have shown the presence of gibberellins A1, A5, A6, A8, and phaseic acid as plant hormones with growth-promoting activity [9][10][11][12][9,10,11,12].
Therefore, as part of our ongoing study to investigate novel bioactive components from various natural resources [13][14][15][16][17][18][19][13,14,15,16,17,18,19], we investigated the potential bioactive components from the extract of P. multiflorus var. albus fruits. In the current study, the phytochemical constituents of the ethanolic extract of P. multiflorus var. albus fruits were isolated, resulting in the isolation of three phenolic compounds (1–3) and one dipeptide (4). The chemical structures of compounds (1–4) were clearly elucidated through 1D and 2D nuclear magnetic resonance (NMR) spectroscopic data and high-resolution electrospray ionization (HR-ESI) liquid chromatography–mass spectrometry (LC/MS) analyses. In addition, the isolated compounds, 1–4, were tested for their regulatory effects on the differentiation between osteogenesis and adipogenesis of mesenchymal stem cells (MSCs). Herein, we report the isolation and structural determination of the isolated compounds 1–4 as well as their regulatory effects on the differentiation of MSCs.
2. Isolation of Compounds
The fruits of P. multiflorus var. albus were extracted with 30% ethanol/H2O. The resultant extract was suspended for solvent partitioning in water and then fractionated with four solvents, which afforded hexane-soluble (31.4 mg), dichloromethane-soluble (195.7 mg), ethyl acetate-soluble (49.3 mg), and n-butanol-soluble (2.4 g) fractions. The LC/MS-based analysis combined with our in-house built UV library and thin-layer chromatography (TLC) analysis of the solvent-partitioned fractions suggested that the BuOH-soluble fraction contained the majority of the organic acid derivatives. A phytochemical investigation of the solvent-partitioned fractions was conducted under monitoring by TLC and LC/MS-based analysis using repeated column chromatography with silica gel 60, RP-C18 silica gel, and Sephadex LH-20, and high-performance liquid chromatography (HPLC) (Figure 1). The final semi-preparative HPLC separation afforded a phenolic compound (1) from the EA-soluble fraction, two phenolic compounds (2 and 3) from the hexane-soluble fraction, and one dipeptide (4) from the n-butanol-soluble fraction (Figure 2).
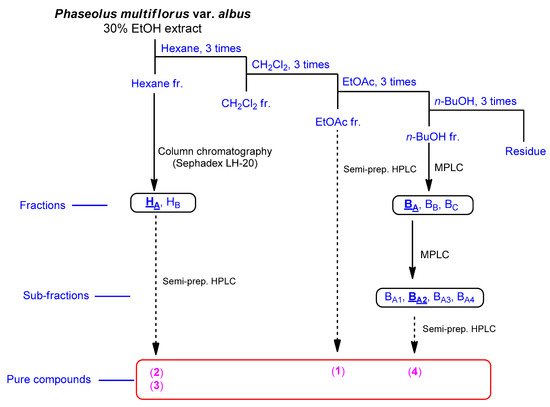
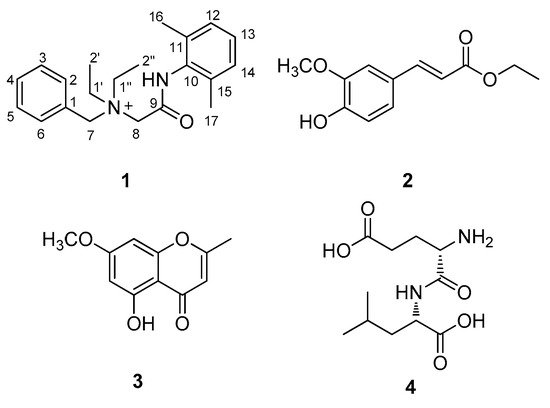
Figure 1. Separation scheme of compounds 1–4.
Figure 2. Chemical structures of compounds 1–4.
3. Elucidation of Compound Structures
Compound 1 was isolated as a white amorphous powder. The molecular formula was deduced to be C21H29N2O+ from the molecular ion peak [M]+ at m/z 325.2282 (calculated for C21H29N2O+, 325.2274) in the positive-ion mode of HRESIMS (Figure S1). The 1H NMR spectrum of 1 (Table 1, Figure S2) displayed the presence of the characteristic signals of two aromatic proton sets of a monosubstituted aromatic ring at δH 7.64 (2H, t, J = 7.5 Hz), δH 7.62 (1H, t, J = 7.5 Hz), and δH 7.58 (2H, t, J = 7.5 Hz); 1,2,6-trisubstituted aromatic ring at δH 7.18 (1H, t, J = 7.0 Hz) and δH 7.17 (2H, d, J = 7.0 Hz); two pairs of relatively deshielded methylene groups at δH 4.94 (2H, s) and δH 4.16 (2H, s); two symmetric methyl groups at δH 2.30 (6H, s); and another two pairs of ethyl groups at δH 3.67 (4H, m) and δH 1.56 (6H, t, J = 7.5 Hz). The 13C NMR data of 1 (Table 1, Figure S3), assigned with the aid of the HSQC (Figure S5) and HMBC experiments (Figure S6)confirmed 21 carbon signals composed of four methyl groups at δC 8.4 (2 × C) and δC 18.7 (2 × C); four methylene carbons at δC 54.9 (2 × C), δC 55.7, and δC 63.4; 12 aromatic carbons (δC 128.7, 129.1, 129.5 (2 × C), 130.7 (2 × C), 132.3, 134.1 (2 × C), 134.2, 136.7 (2 × C)); and a carbonyl carbon at δC 164.1. The partial structures of 1 were determined by 2D NMR experiments (1H-1H COSY and HMBC). The gross structure of 1 was finally elucidated by the characteristic NMR signals, and its molecular formula (C21H29N2O+) was confirmed by HRESIMS. The 1H-1H COSY correlations (Figure S4) between H-2/H-3/H-4/H-5/H-6 as well as the HMBC correlations of H-2(H-6)/C-7 (δC 63.4) and H2-7/C-1, C-2, and C-3 verified the presence of benzyl functionality (Figure 3). Furthermore, the methylene of H2-7 showed HMBC correlations with three other carbons: C-8 (δC 55.7), C-1′ (δC 54.9), and C-1″ (δC 54.9) (Figure 3), providing evidence that a quaternary atom linking C-7, C-8, C-1′, and C-1″ is present. Based on the 1H-1H COSY spectrum of H2-1′/H2-2′ and H2-1″/H2-2″ and the HMBC correlations of H2-1′/H2-1″ with C-2′/C-2″, along with their symmetric NMR signals, the two ethyl units were assigned and confirmed to be attached to the quaternary atom by the HMBC correlations of H2-1′/H2-1″ with C-7 and C-8. The relatively deshielded methylene carbon NMR signals of C-7, C-8, C-1′, and C-1″ and the markedly diminished intensity of the carbon NMR signals observed for C-1′, and C-1″ at δC 54.9 confirmed that the quaternary atom linking them could be a quaternary ammonium cation, which finally led to the partial structure of A (Figure 3). Another spin system was observed as a cross-peak between H-12/H-13/H-14 in the 1H-1H COSY spectrum, representing the 1,2,6-trisubstituted aromatic ring, which was assigned to the 2,6-dimethylated benzene as the partial structure of B by the HMBC correlations of H-12(H-14)/C-10, H-13/C-11(C-15), C-16(C-17)/C-10, C-11, and C-12 (Figure 3). Finally, the connectivity through the amide bond between the two partial structures of A and B was suggested by the C=O and NH moieties remaining from the molecular formula (C21H29N2O+) of 1, the detected HMBC correlation of H2-8/C-9 (δC 164.1), and the characteristic 13C chemical shifts of C-8 (δC 55.7) and C-10 (δC 134.2), although the key HMBC correlation between C-9 and C-10 was missing in 1 due to the absence of protons. Accordingly, the complete structure of 1 was established, as shown in Figure 1, and it was identified to be denatonium.
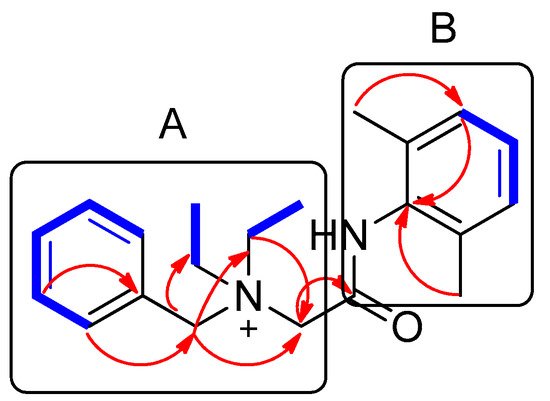
Figure 3. Key 1H-1H COSY (  ) and HMBC (
  ) correlations of compound 1. A and B represent two partial structures.
) and HMBC ( ) correlations of compound 1. A and B represent two partial structures.Table 1. 1H and 13C NMR data of compound 1 in CD3OD (δ in ppm, 850 MHz and 212.5 MHz for 1H and 13C, respectively) a.
| Position | Denatonium (1) | |
|---|---|---|
| δH (J in Hz) | δC | |
| 1 | 128.7 C | |
| 2 | 7.64, d (7.5) | 134.1 CH |
| 3 | 7.58, t (7.5) | 130.7 CH |
| 4 | 7.62, t (7.5) | 132.3 CH |
| 5 | 7.58, t (7.5) | 130.7 CH |
| 6 | 7.64, d (7.5) | 134.1 CH |
| 7 | 4.94, s | 63.4 CH2 |
| 8 | 4.16, s | 55.7 CH2 |
| 9 | 164.1 C | |
| 10 | 134.2 C | |
| 11 | 136.7 C | |
| 12 | 7.17, d (7.0) | 129.5 CH |
| 13 | 7.18, t (7.0) | 129.1 CH |
| 14 | 7.17, d (7.0) | 129.5 CH |
| 15 | 136.7 C | |
| 16 | 2.30, s | 18.7 CH3 |
| 17 | 2.30, s | 18.7 CH3 |
| 1′ | 3.67, m | 54.9 CH2 |
| 2′ | 1.56, t (7.5) | 8.4 CH3 |
| 1″ | 3.67, m | 54.9 CH2 |
| 2″ | 1.56, t (7.5) | 8.4 CH3 |
a Coupling constants (Hz) are given in parentheses. 13C NMR assignments were based on HSQC, 1H-1H COSY, and HMBC experiments.
The structures of the known compounds (Figure 1) were determined to be trans-ferulic acid ethyl ester (2) [20], eugenin (3) [21], and α-L-glutamyl-L-Leucine (4) [22] by comparing their NMR spectroscopic data with those previously reported in the literature and MS data obtained from the LC/MS analysis. To the best of our knowledge, denatonium (1) was identified from a natural source for the first time, and compounds 2–4 were reported for the first time from P. multiflorus var. albus in this study. In natural product chemistry, it is important to take the necessary precautions during the isolation work in order to minimize the possibility of unexpected artifact isolation [23]. To verify whether compounds 1–4 were genuine natural compounds or artifacts, P. multiflorus var. albus was extracted with 80% methanol (v/v) for 10 h, and the resultant methanolic extract was subjected to LC/MS analysis. As a result, there was no peak with a molecular ion corresponding to compound 2 in the methanolic extract, whereas compounds 1, 3, and 4 were detected, suggesting that compound 2 was an artifact produced by the extraction with ethanol. In addition, to confirm that the isolated denatonium (1) is a natural compound, the methanol used for extraction was analyzed using ultra-performance liquid chromatography (UPLC) quadrupole time-of-flight (Q-TOF) high-resolution (HR)-MS because methanol can possess denatonium as a component. As a result, there was no detected peak for denatonium in the methanol solvent that we used for extraction (Figure S7), suggesting that the methanol used does not contain denatonium and the isolated denatonium can be a genuine natural compound.
Intriguingly, denatonium (benzyl-[2-(2,6-dimethylanilino)-2-oxoethyl]-diethylazanium), which is odorless and chemically stable, was found during research on local anesthetics in 1958 [24]. Since then, it has been widely used in various industries, such as cosmetics, pharmaceuticals, and material industries [25]. Interestingly, its bitterness and aversive taste have served to prevent young children from swallowing small household items, including toys and game packs, which has allowed denatonium to be widely employed in many household items. Denatonium is known to be one of the most bitter chemical compounds; thus, it was nominated in the Guinness Book of World Records as one of the most bitter compounds that people can use [26].
4. Evaluation of the Biological Activities of Compounds 1–4
MSCs are pluripotent cells in bone marrow that are known to differentiate into osteocytes and adipocytes. As microenvironmental changes cause alterations in the regulation of gene expression in MSC differentiation, the alterations of related gene expression might disturb the balance between adipocyte progenitor and osteoprogenitor cells in patients with osteoporosis [27][28][29][27,28,29]. Thus, a therapy that can regulate gene expression in MSCs would be promising for the management of postmenopausal osteoporosis. To determine the regulatory effects of compounds 1–4 on MSC differentiation between adipogenesis and osteogenesis, all the compounds were examined for their effects on the differentiation of murine MSCs into adipocytes or osteoblasts. The murine MSC line C3H10T1/2 was treated with 20 µM of the compounds during adipogenesis, and the differentiated cells were stained with Oil Red O (ORO). Compound 4 slightly reduced the formation of lipid droplets, resulting in fewer ORO-stained cells, compared to the normally differentiated adipocytes (Figure 4A,B). In addition, C3H10T1/2 cells were cultured in osteogenesis-inducing media in the presence of compounds 1–4. The cells were then stained for alkaline phosphatase (ALP), which is considered a distinctive marker of osteoblast differentiation [30]. Cells treated with compounds 1 and 4 showed slightly higher staining intensity and ALP enzyme activity than the negative control group (Figure 4C,D).
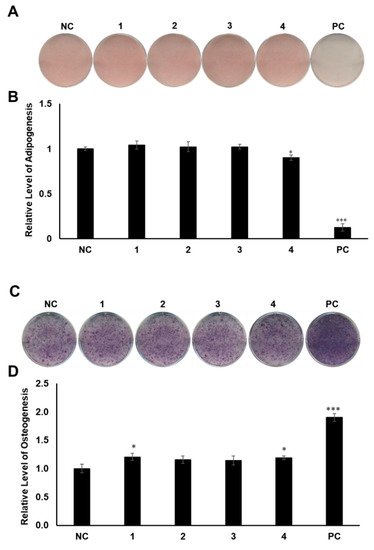
Figure 4. The effects of compounds 1–4 on the differentiation of mesenchymal stem cells (MSCs) toward adipocytes and osteoblasts. (A) Suppressive effects of compounds 1–4 on the adipogenic differentiation of MSCs. C3H10T1/2 cells were treated with 20 μM of compounds 1–4. After adipogenic differentiation, the cells were stained with Oil Red O (ORO). (B) The intensity of stained lipid droplets was quantitatively examined. (C) Stimulatory effects of compounds 1–4 on osteogenic differentiation of MSCs. Fully differentiated C3H10T1/2 cells were stained with alkaline phosphatase (ALP) on day 9 post osteogenic differentiation with 20 µM compounds 1–4. (D) ALP enzyme activity was determined in osteogenically differentiated C3H10T1/2 cells treated with compounds 1–4. The values were calculated relatively by setting the untreated negative control (NC) to 1. Resveratrol (20 μM) and oryzativol A (5 μM) were added to the experimental set for adipogenesis and osteogenesis, respectively, as a positive control (PC). * denotes p < 0.05 and *** denotes p < 0.001.
Compounds 1 and 4 showed the regulatory effects on the differentiation between osteogenesis and adipogenesis of MSCs (Figure 4). Among the active compounds, compound 4 was not sufficient for further experiments to examine its effects. To test the effects of compound 1 on osteogenic differentiation, C3H10T1/2 cells were stained with ALP (Figure 5A), and ALP enzyme activity was measured (Figure 5B). Our results indicated that increased concentrations of compound 1 led to the formation of darker-colored cells (Figure 5A), which indicated that the treated cells exhibited greater promotion of bone differentiation than the control group (Figure 5B). Moreover, compound 1 slightly enhanced the gene expression of ALP (Figure 5C) and osteopontin (OPN) (Figure 5D), which are osteogenesis-related factors, during osteogenic differentiation in a dose-dependent manner.
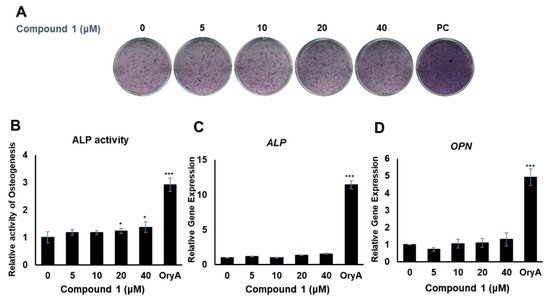
Figure 5. The effects of compound 1 on osteogenic differentiation. C3H10T1/2 cells were treated with sequential concentrations (5, 10, 20, and 40 μM) of compound 1 during osteogenic differentiation. The effects of compound 1 were evaluated through ALP staining (A). The cells were evaluated by measuring the ALP activity (B). The mRNA expression of ALP (C) and OPN (D) was measured by real-time PCR. Oryzativol A (OryA) at a concentration of 5 μM was used as a positive control (PC). * denotes 0.01 < p < 0.05 and *** denotes p < 0.001.