Wind Turbine Blade Failures: Comparison
Please note this is a comparison between Version 2 by Conner Chen and Version 1 by Dimitris Katsaprakakis.

The wind turbine is a complex structure. Although there is no single approach and there is variability in the commercial designs, a typical WTB is a thin-walled multi-cellular hollow airfoil shaped cross-section. For its manufacture, a number of materials and material systems are used for structural purposes (fibre composites and sandwich composite systems) as well as aesthetic purposes (primers, UV gel coats, paint, etc).

The potential causes of wind turbine blade failures can be classified into the following four categories:

1. damage from lightning;

2. failures due to fatigue;

3. leading edge erosion;

4. damage from icing.

The types of damage caused to wind turbine blades—originating from the above four different sources—along with their significance to the turbine’s performance and secure operation, are detailed in the following sub-sections.

  • wind turbine blade damage
  • lightning
  • leading edge erosion
  • icing effect
  • de-icing
  • anti-icing methods
  • fatigue loads

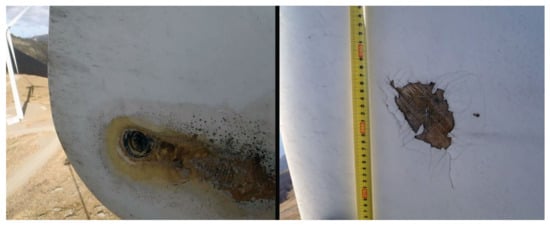
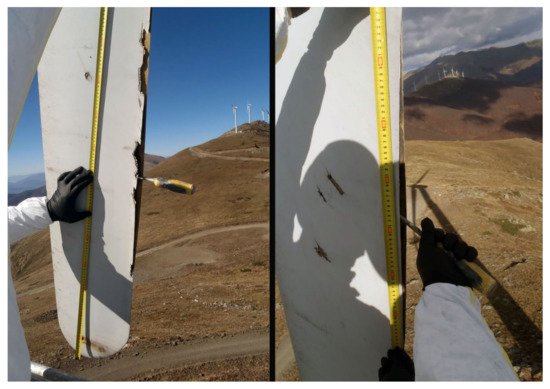
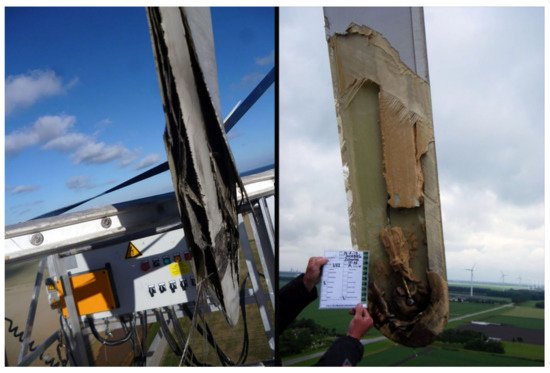
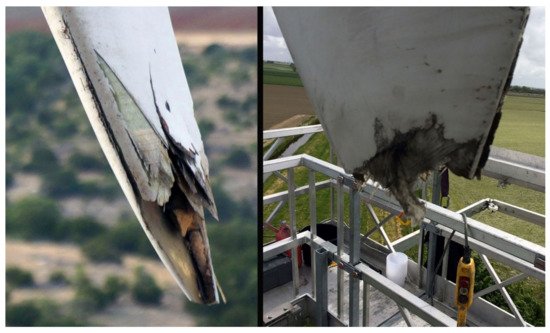
1. Damage from Lightning

The annual average frequency of lightning outages in Europe was between 3.9% and 8.0% from 1991 to 1998 [9][1]. In Japan, this figure was around 10–20% from 2002 to 2006 [20][2]. The recorded frequency of lightning outages implies a considerable probability of lightning strikes in wind turbines. According to [21][3], approximately 6% of wind turbines in Denmark and Germany could expect to be damaged annually by lightning strikes from 1992 to 1997. In a region in south central Texas in U.S.A., with an approximate frequency of 5–6 lightning strikes per km2 per year over a 3-year period, about 5% of the wind turbines with 1.5 MW rated power at a specific wind park experienced lightning damage to their blades [22][4]. Conclusively, according to field observations, wind turbines experience a significant number of lightning strikes during their lifetime [23,24][5][6].
The most frequent damage from lightning occurs on the WTBs [25,26,27,28,29,30][7][8][9][10][11][12]. More than 88% of lightning attachments occur within the outermost 1 m of the blade tip, where the thickness of the surface skin is around 2–10 mm. Yet, increasing risk of inboard puncture is also noted [31][13] with regard to the rest of the blade. Experimental results have shown that WTB rotation enhances the triggering of lightning [32][14].
Current lightning air-termination systems for rotor blades are designed to withstand about 98% of lightning strikes. Consequently, there is still a risk of local damage, particularly at the attachment point [33,34,35,36][15][16][17][18]. Such occurrences are caused in cases where the lightning conductor does not conduct as designed, causing lightning to create a shock wave in the blade’s inner space, due to air or internally concentrated moisture expansion, or both. The imposed over-pressures can stress the blade to subsequent failure [22][4].
Damage from lightning to wind turbine blades strongly depends on the structural materials. According to relevant experiments, polyvinyl chloride (PVC) and polyethylene terephthalate (PET) suffered pyrolysis and cracks inside when tested under severe temperature and increasing pressure strikes, while in cases of balsa wood blades, fibre breakage and large areas of delamination between the wooden material and the resin layer have been observed [37][19].
The most common types of damage in wind turbine blades caused by lightning strikes are as follows [38,39][20][21]:
Delamination: Delamination is normally caused by the localised build-up of pressure and abrupt expansion of the lightning arc column, combined with the structural degradation of the resin (due to incineration or overheating) between the laminate plies due to the temperature of the lightning channel. This causes the plies of the laminate to detach from each other (Figure 4). Usually, lightning-induced delamination is accompanied by punctures and burns on the laminate near the point of impact. Although delamination mainly occurs close to the blade tip, it can be found at any position between the blade tip and the hub.
Figure 4. Delamination and burn at the conductor’s edge point on the wind turbine’s blade. Typical wear due to lightning strike.
The main problem with delamination is that it creates favourable conditions for the onset and development of cracks. This is especially troublesome in wind turbine blades, because of the fatigue loading that the structure is subjected to.
Debonding: Debonding consists of a localized separation of the upper and lower shells of the blade. It is usually present at the tip or at the trailing edge in the outer few meters of the blade (Figure 5). Usually debonding is caused because the heat generated from the lightning expands the air inside the blade, thus creating internal pressure. The vaporisation of condensed moisture trapped inside the blade can intensify this phenomenon. Debonding is mainly located very close to the tip of the blade, in distances lower than 1 m. However, there can be cases of shell debonding traced in distances up to 6 m from the tip. This is attributed to the fact that the blade is more robust near the hub, and therefore the expansion of air is not usually sufficient to cause the separation of the shells. Additionally, the blade tips are more likely to attract lightning.
Figure 5. Shell debonding of around 1 m length, starting at 40 cm from the blade’s tip (left photo) and extending 60 cm in length (right photo).
It is noteworthy, that the concept of debonding usually refers to large scales (blade shells) compared to delamination (plies), while in materials science the reverse is true. In materials science, debonding usually refers to the events of failure of physical, chemical or mechanical forces that hold the interface between the fibre and the matrix together. Thus, in that context it refers to an interface between components of a ply (laminate). The delamination refers to the next level of the structure, which is the breakage of the interface between the laminates.
Shell detachment: The shell detachment consists of several meters of one or both shells completely detached from the load carrying structure (Figure 6). Usually, shell detachment starts with shell debonding. The mechanical forces generated by blades’ rotation, alongside any flutter induced by the flow characteristics (which change due to the geometry change) and the strong wind gusts during adverse weather conditions, eventually lead to shell detachment. Shell detachment is a rather rare damage caused by lightning strikes on wind turbine blades. In cases of shell detachment, the lightning strike point is usually located within the last 3 m of the blade tip, even if the damage affects several meters of the shell.
Figure 6. Images of wind turbine blade shell detachment.
Tip detachment: Tip detachment refers to the complete detachment of several meters of the tip from the rest of the blade (Figure 7). It occurs when the lightning strike severely damages the structural laminate, such that the laminate cannot support the mechanical load and breaks. Consequently, tip detachment can be considered as the most critical case of WTB damage caused by lightning strikes. Tip detachment occurs rarely, most commonly in blades with a carbon fibre structure. For a 20 m blade length, tip detachment is located between 2 m and 7 m from the blade tip (namely, between 10% to 35% of the total blade’s length), where a direct lightning strike can be critical for the integrity of the relatively thin laminate of the load carrying structure [38][20]. This type of damage occurs when the lightning current severely damages the structural laminate, to the extent that the laminate cannot support the mechanical load and breaks [39][21].
Figure 7. Typical images of wind turbine blade tip detachment, caused by lightning strikes.
An integrated and comprehensive analysis of WTB damage caused by lightning is presented in [38][20]. The analysis is based on 304 lightning incidents during a period of 5 years, occurring in the states of Texas, Kansas and Illinois, where the lightning flash density is within 2 and 8 flashes/km2 per year. The number of the involved wind turbines was 508, with a total rated power of 997 MW. The wind turbine blades were constructed of either fiberglass only (64.8% of the blades), or mixed fiberglass and carbon fibre (35.2% of the blades). All of the investigated wind turbine blades were designed and manufactured prior to the publication of IEC 61400-24 [40][22].
Given the total number of involved wind turbines and recorded lightning incidents, it is estimated that, on average, each wind turbine experienced blade damage due to lightning every 8.4 years [39][21]. In other words, it is estimated that during a period of 20 years, a wind turbine should expect on average 2–3 lightning strikes capable of inflicting damage.
The basic conclusions of this study can be summarized as follows:
  • More than 60% of the total damage occurred within the last meter of the blade, and 90% of all damage was located within the last 4 m. The remaining 10% of damage was found mainly from 5 m to 10 m from the blade tip. There were only three lightning incidents further inboard, at 15 m, 20 m and 22 m from the tip.
  • The most common type of lightning damage was delamination (72.4% of total blade damage), followed by debonding of the shells (24.7%). Shell and tip detachment each occurred in 1.4% of the investigated cases.
  • Wind turbines suffering damage to more than one blade are uncommon (2.7% in two blades and 0.7% in three blades). A single lightning stroke sweeping from one blade to another due to the blade rotation, different branches of a single lightning strike attaching to the blades, or different lightning events during a thunderstorm can be the potential causes of damage observed in more than one blade of the same wind turbine [39][21]. In any case, it is shown that damage to more than one blades of a single wind turbine is a rare event.
Lightning damage to wind turbine blades can impose serious costs, which are associated not only with the repair itself, but with the income lost due to the inevitable interruption of the turbine’s operation. The repair process for minor lightning damage, such as delamination, can take as little as 2–3 h, while more severe damage, such as detachment, may require a period of 3–5 days [39][21]. The cost of repairing blade damage caused by lightning can be as high as USD 30,000 [41][23].

2. Fatigue Damage on Wind Turbine Blades

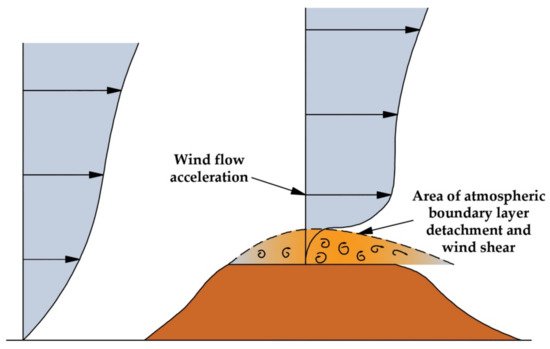
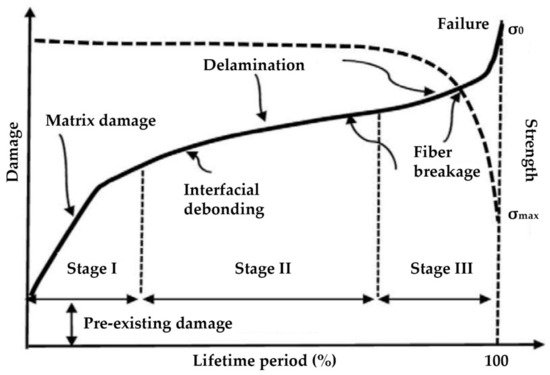
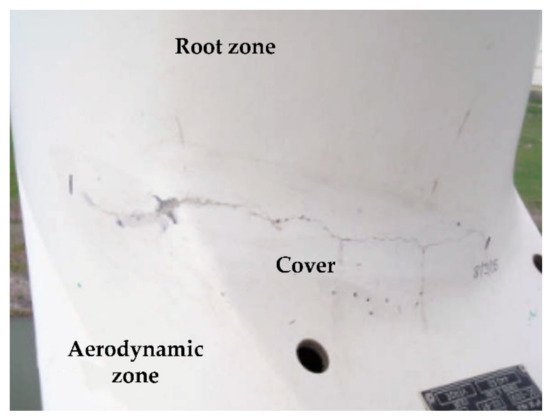
The term “fatigue” is used to describe the inability of a material to persistently withstand cyclic applied loads, which are fully tolerable when applied only once or for a few repetitions. During its operational lifetime, a wind turbine faces repetitious loads that contribute to the fatigue of the overall structure. Wind is the main source of these loads, which can be steady loads, transient loads from events such as gusts, periodic loads from wind shear and stochastic loads from turbulence. Additional loads can be developed by the turbine’s cyclic starts and stops, yaw error, yaw motion, resonance-induced loads from vibration of the structure and loads from gravity as well. The main parameters affecting the potential occurrence and magnitude of fatigue loads and the resulting fatigue-induced damage in wind turbines are the surrounding environment and the land morphology of the installation area—more specifically, how the flow characteristics are affected by the land morphology and other obstructions. Regarding the surrounding environment of a wind park, surface wear can be caused on the blades’ outer coating by corrosive pits from sand or rain impingement or even seawater, in the case of offshore or near-shore wind park installations. These initially small wear points would act as stress concentrators during cyclic loading, causing the initiation of localized cracking. Moisture also can constitute another critical environmental parameter of fatigue damage caused mainly to the wind turbine blades. Despite the fact that glass fibre reinforced polyester (GFRP) blades are adequately water insulated, moisture can still penetrate into the blades’ inner material. Obviously the most fatigue-critical part of a wind turbine’s blade is the blade’s connection to the hub, because it has to bear all of the blade’s mechanical loads transferred and gathered at this particular point. For the connection of the blade with the turbine’s hub, a bolted joint is commonly used. The major effects of absorbed moisture on the laminates are as follows [42][24]:
  • Reduction of the glass transition temperature of the matrix resin
  • Damage to the interface between the fibres and the resin
  • Reduction of the cure-induced residual stresses through swelling, which may retard failure
  • Particularly in wind park installations in locations with subzero temperatures, the presence of moisture turning to ice. Ice formation can act as a wedge between the plies and leads to delamination propagation.
A composite material subjected to water and fatigue loads will exhibit increasing matrix cracking that, in turn, will accelerate water penetration. The effects of moisture absorption on the mechanical properties of GFRP blades are not accurately known [43][25]. The effects of moisture on the mechanical properties of fibre-reinforced plastics (FRP) are summarized in Table 1 [43][25].
Table 1. Indication of the moisture effect on the mechanical properties of FRP.
Material Maximum Moisture Absorption (%) Stiffness Change (%) Fatigue Strength

Reduction (Cycles)
Glass polyester 4 −10 −35 × 103–−10 × 107
Glass epoxy 2 −10 −20 × 103–−5 × 10⁷
Carbon polyester 1.5 1 ±0
Carbon epoxy 1.5 1
Glass—carbon epoxy <2 ±0
However, the most important cause of fatigue damage is the load development from intensively fluctuating forces. Wind constitutes the main source of such forces, especially in cases of wind park installations in intensively turbulent wind conditions [44][26]. The land morphology of the installation area of a wind turbine may lead to the appearance of extensive wind turbulence conditions and the phenomenon of wind shear (Figure 8).
Figure 8. The shear effect.
This intensively varying wind environment constitutes the fundamental source of iteratively fluctuating wind loads on the turbine’s structure, exposing it to operation under adverse fatigue conditions. Such unfavourable land morphologies can be abrupt changes of a mountain’s slope, steep cliffs downwards or upwards to the wind flow direction and, in general, any land geometries that result in separation of the atmospheric boundary layer. Apart from the available land morphology, the wind flow on a wind turbine can be significantly affected by any physical or technical obstructions, such as, most commonly, the other wind turbines in the same wind park. Behind the wind turbine’s rotor, the wind flow exhibits roughly 40% reduced kinetic energy and increasing turbulence relative to the initial, unaffected flow. This area is the wind turbine’s wake. The term “aerodynamic shading” refers to the unpleasant situation of one wind turbine being inside the wake of another. This can occur in the case of short distances between the wind turbines and, of course, depending on the wind flow direction and the wind turbines’ relevant positions. The aerodynamic shading also constitutes another source of fatigue due to unsteady mechanical loads imposed by turbulent wind flow and shear effect. To avoid this probability, wind turbines should be sited properly, with adequate distances between them, accounting also for the prevailing wind direction, so as to ensure maximum efficiency and minimum impact on the normal atmospheric boundary layer. Wind turbine blades, subject to repeated bending, are the most vulnerable components of the overall structure with regard to fatigue damage due to fluctuating forces. The fatigue damage initially appears as tiny cracks, usually located in the joining zone of the blade with the hub. It is then concluded that the blade joints with the turbine’s hub constitute the most likely places for the appearance of fatigue damage, regardless of the source of the fatigue conditions. All of the factors with an unfavourable influence on a material’s fatigue strength are present in this area: stress concentration, bolt holes, built-in stresses, offsets, changes of section and application of different materials. Fatigue damage in the joining zone of the blade with the root appears initially as tiny cracks, which tend to become more severe over time. The response of composite materials to fluctuating loads has been studied and defined for some specific material combinations, such as carbon fibres in an epoxy matrix for aerospace applications. According to [45][27], in anisotropic materials, fatigue damage accumulates in three stages versus time. During the initial load period (stage 1), a small drop in the material’s stiffness manifests, associated with the formation of minor damage. This first stage is followed by a much longer time period (stage 2), during which the damage seems to increase linearly with time and the stiffness falls gradually. If the stress is sufficiently high, a third stage (3) is observed, characterized by further and more severe damage, which ultimately lead to failure. This process is depicted in Figure 9 [46][28].
Figure 9. Fatigue evolution process over time in anisotropic materials [46][28].
An image of typical fatigue damage in stage 1, in the form of cracks on the external surface, located in the transition zone between the root of the blade and the zone of airfoil profile, is presented in Figure 10 [45][27].
Figure 10. Cracks in the hub joint area of a wind turbine blade due to fatigue [45][27].
The shear effect also can be critical for the trailing edge adhesive joint, because it is more susceptible to damage due to the complex geometry, manufacturing technique and operating conditions [47][29].

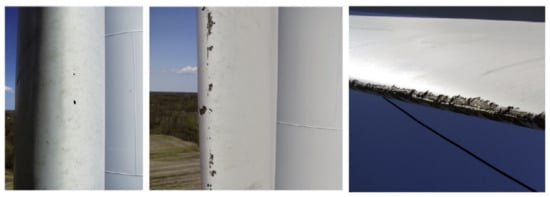
3. Leading Edge Erosion

In general, leading edge erosion of a wind turbine’s blade is the result of its exposure to:
  • airborne particulates, mainly in the form of rain, hailstone, sea-spray, dust and sand
  • UV light and humidity/moisture.
The first impact of this exposure is a gradual increase in the blade’s surface roughness, which negatively affects the blade’s aerodynamic performance by increasing its friction drag [49][30], and aerodynamic loss on the scale of 0.45–0.50% [50][31]. Depending on the level of leading edge erosion, drag can increase from 6 to 500% [51[32][33],52], leading in turn to an approx. 5% reduction in annual electricity production. The reduced lift and increased drag become more intensive with higher levels of erosion [53][34]. In extreme cases of leading edge erosion, the structural integrity of the blade can be affected (Figure 11).
Figure 11. Examples of leading edge erosion [54][35].
Leading edge erosion can become an issue after only 2 years of turbine operation [50][31], much sooner than expected, with the tip being most susceptible to wear, but with erosion also exhibited on the more inboard portions of the blade [55][36]. As with all forms of environmental exposure, leading edge erosion is heavily site-dependent. In warm and arid climates, sand and dust may be a common type of airborne particulate and therefore may pose leading edge erosion problems, whereas in wetter, greener habitats, the problem may be non-existent. Likewise, at near-shore locations, the issue of sand erosion may be a considerable threat [56,57,58,59][37][38][39][40]. Leading edge erosion can be a result of rain, with the raindrops’ kinetic energy, diameter, temperature and sea salt content being critical parameters [56][37]. It has been also observed that careful handling of the blade during manufacturing, transport and installation is essential to avoid small tears or scratches that may act as initiation sites for further wear and erosion [60][41]. In order to present an estimation of the forces acting on a blade’s coating from airborne particles, let us assume a raindrop travelling with the wind. In general, the diameter of raindrops depends on the climatic conditions under which they are formed and the conditions of their transportation in the air. Typical raindrop diameters are commonly cited from 0.5 mm to 5 mm [50[31][42],61], while for mild to moderate rain rates, raindrop diameters range from 0.5 mm to 3 mm. Assuming water density at approximately 1000 kg/m3, the mass of a raindrop of spherical shape with a diameter of 3 mm is calculated at m = 0.014 gr. The terminal velocity of a falling raindrop is also heavily dependent on the climatic conditions. The maximum free falling terminal velocity levels out at around 9 m/s for diameters in excess of about 3.5 mm [50,61][31][42]. Assuming a rain droplet with a terminal velocity of 8 m/s, fully entrained in a horizontal 20 m/s wind (i.e., assuming that the droplet is also travelling at this speed horizontally), strikes a rotating blade with a 90 m/s tangential tip speed, it is calculated that the impact velocity between the rain and blade does not drop below 80 m/s [45][27]. It is possible to calculate the force (average and peak) of impact using the following calculation. Assume the x-axis is the horizontal axis (along the wind), the y-axis is the vertical and z is perpendicular to the x-y plane. In that frame of reference, the velocity of a raindrop the moment before impacting the blade is vx = 20 m/s, vy = 8 m/s. Additionally, the wind turbine blade is rotating with a tip velocity of 90 m/s, which is parallel to the z-axis when the blade tip passes through the top and bottom of the rotation. The force on each axis is calculated with the change of momentum at each axis. The duration of the impact is proportional to the speed in that axis (note that on the x and y axes, the assumption is that the water drop stops moving, while on the z-axis it initially has zero velocity which after the impact is common to the blade tip). The resulting forces (Fx, Fy, Fz) for each axis are added as vectors (Euclidean norm) and the resulting average force is calculated. Additionally, a triangular temporal distribution is assumed, which means that the peak impact force is twice the average force. Given the assumptions of raindrop mass of m = 0.014 gr, diameter of d = 3 mm, wind speed 20 m/s, terminal velocity of 8 m/s and blade tip 90 m/s, the impact force F between the raindrop and the blade is calculated by using the Equation (1): which means that every travelling droplet hitting the tip of the blade exerts on the blade’s coating approximately a force equivalent to the weight of a 7.6 kg mass. The force exerted will obviously vary as the wind blade rotates. Nevertheless, the above estimation serves as a good tool to estimate the magnitude of impact forces on WTBs. In the case of hailstones, the effects on a blade’s coating can be even worse, mainly due to the expected larger diameters. The average size of hailstones is dependent on site location [62][43]. Measurements on-site are considered the only certain method to obtain secure estimations regarding the likely average size of hail at a specific location. In northern Greece, for example, more than 85% of the hailstones recorded between 1984 and 1993 had sizes larger than 11 mm [63][44], while in the United Kingdom hailstone sizes in the range of 60 mm–90 mm have been recorded [64][45], although these are considered freak events. As the diameter of hailstones increases, their mass mh and kinetic energy Ekin also increase (see Equation (2)). Additionally, with increasing diameter and mass, the terminal velocity of a hailstone Vh also increases according to Equation (3), where g is the gravitational acceleration, CD is the drag coefficient (0.5 for a sphere), ρair is the air density, Ah is the cross-sectional area of the hailstone in the direction of travel and rh is the hailstone radius [65][46].
Using Equation (3), assuming a density of 900 kg/m3 for the hailstone (this value varies widely) and of 1225 kg/m3 for the air, and a perfectly spherical hailstone shape and thus a drag coefficient of 0.5, the theoretical velocity for a range of hailstone diameters from 5 mm to 90 mm is calculated to be between 10 m/s and 40 m/s, respectively. Given the above hailstone velocities, it is conclusively proved that the maximum calculated impact velocity of a 15 mm and 30 mm diameter hailstone, impacting a blade tip with a tip speed of 90 m/s, in a 20 m/s wind field varies from 70 m/s to 120 m/s [50,61][31][42]. Given the above assumptions for the hailstones, the exerted forces can be calculated using the methodology for Equation (1). For hailstones of 15 mm and 30 mm diameter, the exerted forces at the tip of the blade are calculated to be from 1.7 kNt to 6.9 kNt, respectively.
Surface erosion of a wind turbine’s blade is not the only possible wear from hailstones. Hailstone impact can result in stress propagation throughout the blade coating [66][47], which, in turn, can result in delamination between plies, in the case of simultaneous blade bending due to shear forces. The constituents of the composite material may also fail, resulting in cracking through the matrix material or crushing of the reinforcing fibre. Both can have a significant effect on static and fatigue properties of the blade.
Seawater spray constitutes a special case of airborne particles, in the case of offshore or near- shore wind turbines, regarding the erosion of the blades’ leading edge. Apart from the fact that the seawater spray may affect the blades’ coating in the same way as raindrops with respect to the forces and pressures exerted, an additional impact comes from the transportation of sea salt crystals in the sea spray. The accumulation of sea salt crystals on the blade leading edge may lead to degradation of the blades’ aerodynamic performance and, possibly, to corrosive damage as well [67,68][48][49].
Leading edge erosion is directly related to income loss, due to degradation of the blades’ aerodynamic performance. As the damage concerns only a blade’s outer coating, the repair cost is not significant, on the condition, of course, that the damage is detected early and the required repair process is executed in time.

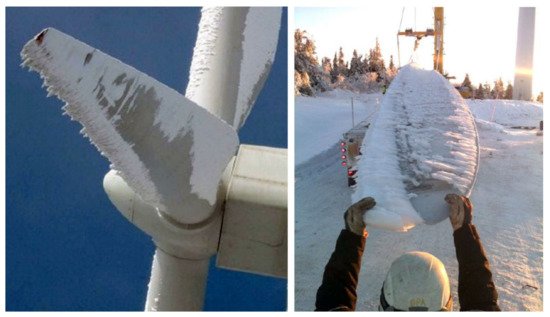
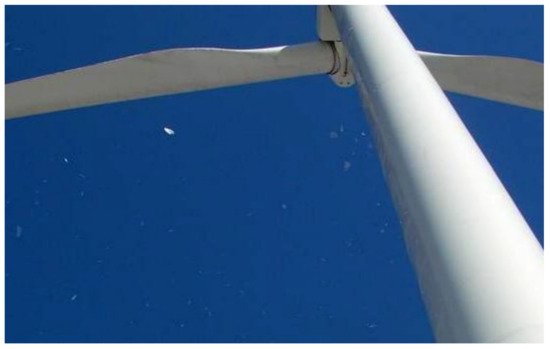
4. Damages from Icing

Atmospheric icing is defined as the accretion of ice or snow on structures exposed to the atmosphere. Two different types of atmospheric icing can be distinguished: in-cloud icing (rime ice or glaze) and precipitation icing (freezing rain or drizzle, wet snow). These are described as follows [69][50]:

4.1. Rime Ice

Rime ice is formed when the wind transfers supercooled liquid water droplets from clouds or fog. These droplets might freeze instantaneously as they hit a surface. In the case of small droplets, soft rime is formed, while hard rime is formed by large droplets.
Soft rime is a fragile, snow-like formation. Mainly, it consists of thin ice needles or flakes of ice. Soft rime starts forming in a very localised manner and grows triangularly into the windward direction. Soft rime usually ranges in density from 200 kg/m3 to 600 kg/m3 [70][51] and is easily removable. On the other hand, hard rime is an opaque and usually white ice formation. It adheres firmly onto surfaces and is very difficult to remove. Hard rime ice density ranges typically between 600 kg/m3 and 900 kg/m3 (ISO 12494) [70][51].
The formation of rime ice is asymmetrical, usually taking the shape of needles following the windward side of a structure. Rime ice is typically formed at temperatures from −20 °C to 0 °C. The most severe rime icing occurs at exposed ridges where moist air is lifted and wind speed increases.

4.2. Glaze

Glaze is the result of freezing rain or wet in-cloud icing. A smooth, transparent and homogenous ice layer is formed and strongly adheres on surfaces. Glaze is usually formed at temperatures from 0 °C to −6 °C with a density of around 900 kg/m3 [70][51].
Freezing rain occurs when the air aloft does not let water at temperatures below freezing to form ice crystals. As soon as freezing rain contacts a surface or the ground, it freezes. Conditions that favour freezing rain may be encountered in warm fronts or in valleys, where cold air may be trapped below warmer air aloft.
Wet in-cloud icing occurs when the surface temperature is close to 0 °C. The water droplets that hit a surface do not freeze completely. This results in the formation of a layer of liquid water which, due to wind and gravity, may flow around the surface and freeze also on its leeward side.

4.3. Wet Snow

Wet snow is formed by partially melted snow crystals with high liquid water content. The liquid content of the crystals increases the cohesive forces of this formation. Thus, it is able to adhere on an object’s surface. Wet snow accretion occurs when the air temperature is between 0 °C and +3 °C, with typical density from 300 kg/m3 to 600 kg/m3 [70][51]. If there is a temperature decrease after the wet snow accretion, then there can be ice formation.
Apart from the aforementioned categorisation, the icing conditions at a site are further described by the following additional parameters:
  • icing rate: ice accumulation per time (kg/h)
  • maximum ice load: maximum ice mass accreted at a structure (kg/m).
An icing event develops following the stages presented below [71][52], applicable to all structures exposed to atmospheric icing:

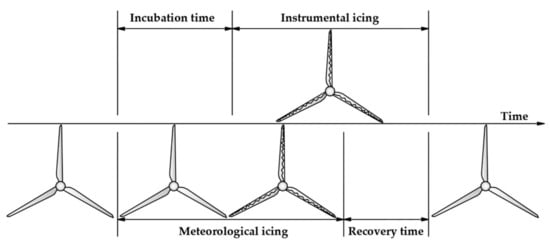
4.4. Meteorological Icing

Period during which the meteorological conditions (i.e., temperature, humidity, wind speed, etc.) favour ice formation (active ice formation).

4.5. Instrumental Icing

Period during which the ice remains at a structure. During that time the operation of the wind turbines is affected and their performance degrades.

4.6. Incubation Time

Delay period between the start of meteorological and start of instrumental icing (dependent on the surface and the temperature of the structure).
Figure 12 illustrates how the operation of a wind turbine is affected by icing according to the definitions described above [71][52]. When climate conditions for ice accretion are favourable (which signals the start of the meteorological icing period), then there is a certain delay period—the incubation time. The incubation time is the time required for the ice accretion to start on the wind turbine blades. The incubation time can be prolonged in an ideal case until the end of the meteorological icing, by using anti-icing measures, such as anti-icing coatings, heated surfaces, etc. As soon as ice has accumulated on the blade surfaces, which marks the start of instrumental icing, the wind turbine’s efficiency is affected. Ice accretion continues on the blade surfaces until the climate conditions for icing are not favourable anymore. However, ice will still remain on the blade surfaces for the recovery time, until it melts or falls off, with the end of the instrumental icing. The recovery time for the wind turbine blades can be significantly longer than the period of meteorological icing. By using de-icing measures, the recovery time can be shortened.
Figure 12. Definition of meteorological icing and instrumental icing [71][52].
During the process of ice accumulation, the wind turbine is subjected to the above icing phases. Some of these phases (meteorological and maybe a part of instrumental icing) allow the turbine to remain operational. However, if the turbine’s limit for load bearing capacity is reached, or if there is a significant threat of ice-throw or the structural health of the turbine is endangered, then the turbine has reached its operational limit and must be stopped. The operational limit of the turbine will vary in each situation and is determined by the turbine design limits in response to environmental conditions and the surrounding safety limitations.
Ice accretion on the wind turbine blades produces significant change in the geometry of each blade’s surface, affecting its aerodynamic efficiency. As a result, the blade lift reduces while the drag increases, resulting in reduced power production and, eventually, in the turbine’s shutdown. Reduced power production occurs with an increasing number of lower than expected power stops, stops due to high vibration amplitude and stops due to faulty wind measurements.
Apart from the reduction in produced electricity, increasing vibrations and aerodynamic noise, imbalances in the blades, leading to increased wear in structural components such as connectors, couplers and gearbox, errors in nacelle wind speed measurements, as well as the risk of ice throw resulting in safety hazards should be expected as direct effects of icing [72,73,74,75][53][54][55][56]. Symmetrical icing of the blades reduces loads acting on the turbine components, whereas asymmetrical icing of the blades induces loads and vibrations in the tower, hub and nacelle assembly at a frequency synchronous to rotational speed of the turbine [74][55], imposing considerable fatigue loads. The aerodynamic changes in the iced blade can cause violent vibrations within the wind velocity operating range of the turbine [75][56]. Indirect consequences from the above effects might include reduced technical life, bodily injuries and material damage caused by falling ice.
An example of ice accretion on a turbine blade is presented in Figure 13 [69][50].
Figure 13. Ice on wind turbine blades [69,76][50][57].
Iced up wind turbines blades and towers can pose a safety risk for wind parks visitors and staff, as large pieces of ice may be thrown from turbine blades during operation. Figure 14 is provided as an example of falling ice fragments [68][49].
Figure 14. Ice falling or being thrown off a wind turbine poses a safety risk to turbine maintenance staff and, depending on turbine siting, the general public [69][50].
Iced up wind turbine blades and towers can pose a safety risk for wind park visitors and staff, as large pieces of ice may be thrown from the turbine blades during operation. Figure 14 is provided as an example of falling ice fragments [69][50].
The cost related to icing mainly refers to the income loss imposed due to lower aerodynamic performance or even the interruption of the wind turbine’s operation, in the case of extreme accumulations of ice on the blades’ surface. The reduction in annual electricity production can exceed 10% due to icing or, in extreme cases with total shutdown of the turbine for a period of 2 months, it can be higher than 20% [77][58], leading to corresponding income loss.

References

  1. Caithness Wind Farm Information Forum. Summary of Wind Turbine Accident Data to 31 March 2021. Available online: http://www.caithnesswindfarms.co.uk/AccidentStatistics.htm (accessed on 17 June 2021).
  2. Ideno, M.; Seki, K. Study on Improvement of Performance of wind power generation system and lightning damage. In Proceedings of the 28th International Conference on Lightning Protection, Kanazawa, Japan, 18–22 September 2006; pp. 1585–1589.
  3. Lightning Protection of Wind Turbines. Contract JOR3-CT95-0052. Publishable Final Report. Research Funded in Part by the European Commission in the Framework of the Non Nuclear Energy Programme JOULE III. Available online: https://cordis.europa.eu/docs/projects/files/JOR/JOR3950052/47698081-6_en.pdf (accessed on 27 July 2021).
  4. Kithi, R. Case Study of Lightning Damage to Wind Turbine Blade. 2008. Available online: http://www.lightningsafety.com/nlsi_lhm/wind_blade_damage.pdf (accessed on 27 July 2021).
  5. Wilson, N.; Myers, J.; Cummins, K.L.; Hutchinson, M.; Nag, A. Lightning attachment to wind turbines in Central Kansas: Video observations, correlation with the NLDN and in-situ peak current measurements. In Proceedings of the EWEA Annual Event, Vienna, Austria, 4–7 February 2013.
  6. Cummins, K.L.; Zhang, D.; Quick, M.G.; Garolera, A.C.; Myers, J. Overview of the Kansas Windfarm 2013 Field Program. In Proceedings of the International Lightning Detection Conference, Tucson, AZ, USA, 12–15 March 2014.
  7. Wang, D.; Takagi, N.; Watanabe, T.; Sakurano, H.; Hashimoto, M. Observed characteristics of upward leaders that are initiated from a windmill and its lighting protection tower. Geophys. Res. Lett. 2008, 35, L02803.
  8. Ishii, M.; Saito, M.; Natsuno, D.; Sugita, A. Lighting current observed at wind turbines at winter in Japan. In Proceedings of the International Conference on Lightning and Static Electricity, Seattle, WA, USA, 18–20 September 2013.
  9. Kusiak, A.; Li, W. The prediction and diagnosis of wind turbine faults. Renew. Energy 2011, 36, 16–23.
  10. Kong, C.; Bang, J.; Sugiyama, Y. Structural investigation of composite wind turbine blade considering various load cases and fatigue life. Energy 2005, 30, 2101–2114.
  11. Amirat, Y.; Benbouzid, M.E.H.; Al-Ahmar, E.; Bensaker, B.; Turri, S. A brief status on condition monitoring and fault diagnosis in wind energy conversion systems. Renew. Sustain. Energy Rev. 2009, 13, 2629–2636.
  12. Rodrigues, R.B.; Mendes, V.M.F.; Catalão, J.P.S. Protection of wind energy systems against the indirect effects of lightning. Renew. Energy 2011, 36, 2888–2896.
  13. Madsen, S.F.; Holboll, J.; Henriksen, M.; Bertelsen, K.; Erichsen, H.V. New test method for evaluating the lightning protection system on wind turbine blades. In Proceedings of the 28th International Conference on Lightning Protection, Kanazawa, Japan, 18–22 September 2006.
  14. Wen, X.; Qu, L.; Wang, Y.; Chen, X.; Lan, L.; Si, T.; Xu, J. Effect of Wind Turbine Blade Rotation on Triggering Lightning: An Experimental Study. Energies 2016, 9, 1029.
  15. Cotton, I.; Jenkins, N.; Pandiaraj, K. Lightning protection for wind turbine blades and bearings. Wind Energy 2001, 4, 23–37.
  16. Peesapati, V.; Cotton, I. Lightning protection of wind turbines—A comparison of real lightning strike data and finite element lightning attachment analysis. In Proceedings of the 1st International Conference of Sustainable Power Generation Supply (Supergen), Nanjing, China, 6–7 April 2009.
  17. Madsen, S.F.; Erichsen, H.V. Numerical model to determine lightning attachment point distributions on wind turbines according to the revised IEC 61400-24. In Proceedings of the International Conference on Lightning and Static Electricity (ICOLSE), Pittsfield, MA, USA, 15–17 September 2009.
  18. Naka, T.; Vasa, N.J.; Yokoyama, S.; Wada, A.; Asakawa, A.; Honda, H. Study on lightning protection methods for wind turbine blades. IEEJ Trans. Power Energy 2005, 125, 993–999.
  19. Yan, J.; Wang, G.; Li, Q.; Zhang, L.; Yan, J.D.; Chen, C.; Fang, Z. A Comparative Study on Damage Mechanism of Sandwich Structures with Different Core Materials under Lightning Strikes. Energies 2017, 10, 1594.
  20. Garolera, A.C. Lightning Protection of Flap System for Wind Turbine Blades. Ph.D. Thesis, Technical University of Denmark, Lyngby, Denmark, September 2014. Available online: http://orbit.dtu.dk/files/118015819/PhD_Thesis_Anna_Candela_Garolera.pdf (accessed on 27 July 2021).
  21. Garolera, A.C.; Madsen, S.F.; Nissim, M.; Myers, J.D.; Holboell, J. Lightning damage to wind turbine blades from wind farms. IEEE Trans. Power Deliv. 2016, 31, 1043–1049.
  22. Wind Turbines—Part 24: Lightning Protection, 1st ed.; IEC 61400-24; IEC: London, UK, 2010.
  23. Shohag, M.A.S.; Hammel, E.C.; Olawale, D.O.; Okoli, O.I. Damage mitigation techniques in wind turbine blades: A review. Wind Eng. 2017, 41, 185–210.
  24. Bulder, B.H.; Bach, P.W. A Literature Survey on the Effects of Moisture on the Mechanical Properties of Glass and Carbon Fibre Reinforced Laminates; ECN-C-91-033; U.S. Department of Energy: Washington, DC, USA, 1991.
  25. Reifsnider, K.F. Fatigue of Composite Materials; Elsevier: Amsterdam, The Netherlands, 1991.
  26. Bergeles, G. Wind Converters; Simeon Editions: Athens, Greek, 2005.
  27. Marín, J.C.; Barroso, A.; París, F.; Cañas, J. Study of fatigue damage in wind turbine blades. Eng. Fail. Anal. 2009, 16, 656–668.
  28. D’Amore, A.; Grassia, L. Principal Features of Fatigue and Residual Strength of Composite Materials Subjected to Constant Amplitude (CA) Loading. Materials 2019, 12, 2586.
  29. Chen, C.; Li, H.; Wang, T.; Wang, L. Influence of Structural Configurations on the Shear Fatigue Damage of the Blade Trailing-Edge Adhesive Joint. Appl. Sci. 2020, 10, 2715.
  30. Schramm, M.; Rahimi, H.; Stoevesandt, B.; Tangager, K. The Influence of Eroded Blades on Wind Turbine Performance Using Numerical Simulations. Energies 2017, 10, 1420.
  31. Hasager, C.B.; Vejen, F.; Skrzypiński, W.R.; Tilg, A.M. Rain Erosion Load and Its Effect on Leading-Edge Lifetime and Potential of Erosion-Safe Mode at Wind Turbines in the North Sea and Baltic Sea. Energies 2021, 14, 1959.
  32. Elert, G.; Volynets, I. Diameter of A Raindrop. 2001. Available online: http://hypertextbook.com/facts/2001/IgorVolynets.shtml (accessed on 8 March 2021).
  33. Villermaux, E.; Bossa, B. Single-drop fragmentation determines size of distribution of raindrops. Nat. Phys. 2009, 5, 697–702.
  34. Imeson, A.C.; Vis, R.; de Water, E. The measurement of water-drop impact forces with a piezo-electric transducer. CATENA 1981, 8, 83–96.
  35. Gaudern, N. A practical study of the aerodynamic impact of wind turbine blade leading edge erosion. J. Phys. Conf. Ser. 2014, 524, 012031.
  36. Slot, H.M.; Gelinck, E.R.M.; Rentrop, C.; Van Der Heide, E. Leading edge erosion of coated wind turbine blades: Review of coating life models. Renew. Energy 2015, 80, 837–848.
  37. Nash, J.W.K.; Zekos, I.; Stack, M.M. Mapping of Meteorological Observations over the Island of Ireland to Enhance the Understanding and Prediction of Rain Erosion in Wind Turbine Blades. Energies 2021, 14, 4555.
  38. Phan, P.T.S.; Huang, S.C. Analysis of material loss from brittle erosion. J. Eng. Technol. Educ. 2008, 5, 141–155.
  39. Balu, P.; Kong, F.; Hamid, S.; Kovacevic, R. Finite element modeling of solid particle erosion in AISI 4140 steel and nickel-tungsten carbide composite material produced by the laser-based powder deposition process. Tribol. Int. 2013, 62, 18–28.
  40. Aquaro, D. Erosion rate of stainless steel due to the impact of solid particles. In Proceedings of the 5th International Conference on Tribology, Parma, Italy, 20–22 September 2006.
  41. El Togby, M.S.; Elle, N.; Elbestawi, M.A. Finite element modelling of erosive wear International. J. Mach. Tools Manuf. 2005, 45, 1337–1346.
  42. Rempel, L. Rotor Blade Leading Edge Erosion—Real Life Experiences. 2012. Available online: https://www.windsystemsmag.com/wp-content/uploads/pdfs/Articles/2012_October/1012_BladeFeature.pdf (accessed on 8 April 2021).
  43. Nearing, M.A.; Bradford, J.M.; Holtz, R.D. Measurement of Force vs. Time Relations for Waterdrop Impact Soil. Sci. Soc. Am. J. 1986, 50, 1532–1536.
  44. Sioutas, M.; Meaden, G.T.; Webb, J.D.C. Hail frequency and intensity in northern Greece. In Proceeding of the 4th European Conference on Severe Storms, Trieste, Italy, 10–14 September 2007; Available online: http://indico.ictp.it/event/a06216/session/11/contribution/5/material/0/6.pdf (accessed on 8 April 2021).
  45. The Tornado and Storm Research Organisation (TORRO). Available online: https://www.torro.org.uk/research/hail (accessed on 8 April 2021).
  46. Georgia State University. Terminal Velocity. Available online: http://hyperphysics.phy-astr.gsu.edu/hbase/airfri2.html (accessed on 8 April 2021).
  47. Keegan, M.H.; Nash, D.; Stack, M. Numerical modelling of hailstone impact on the leading edge of a wind turbine blade. In Proceedings of the EWEA Annual Event, Vienna, Austria, 4–7 February 2013.
  48. Kumar, V.S.; Vasa, N.J.; Sarathi, R. Detecting salt deposition on a wind turbine blade using laser induced breakdown spectroscopy technique. Appl. Phys. A 2013, 112, 149–153.
  49. Cortés, E.; Sánchez, F.; O’Carroll, A.; Madramany, B.; Hardiman, M.; Young, T.M. On the Material Characterisation of Wind Turbine Blade Coatings: The Effect of Interphase Coating–Laminate Adhesion on Rain Erosion Performance. Materials 2017, 10, 1146.
  50. Baring-Gould, I.; Cattin, R.; Durstewitz, M.; Hulkkonen, M.; Krenn, A.; Laakso, T.; Lacroix, A.; Peltola, E.; Ronsten, G.; Tallhaug, L.; et al. Expert Group Study on Recommended Practices 13: Wind Energy Projects in Cold Climates. Available online: https://nachhaltigwirtschaften.at/resources/iea_pdf/reports/iea_windenergy_projects_in_cold_climates_2011.pdf (accessed on 10 September 2021).
  51. ISO 12494: 2001 Atmospheric Icing on Structures, 1st ed.; 2001-08-15. TC/SC: ISO/TC 98/SC 3. ICS: 91.080.01; ISO: Geneva, Switzerland, 2001.
  52. Heimo, A.; Cattin, R.; Calpini, B. Recommendations for Meteorological Measurements under Icing Conditions. In Proceedings of the 13th International Workshop on Atmospheric Icing of Structures (IWAIS), Andermatt, Switzerland, 8–11 September 2009.
  53. Homola, M.C.; Virk, M.S.; Nicklasson, P.J.; Sundsbø, P.A. Performance losses due to ice accretion for a 5MW wind turbine. Wind Energy 2012, 15, 379–389.
  54. Barber, S.; Wang, Y.; Chokani, N.; Abhari, R.S. The Effect of Ice Shapes on Wind Turbine Performance. In Proceedings of the 13th International Workshop on Atmospheric Icing of Structures (IWAIS), Andermatt, Switzerland, 8–11 September 2009.
  55. Gantasala, S.; Tabatabaei, N.; Cervantes, M.; Aidanpää, J.O. Numerical Investigation of the Aeroelastic Behavior of a Wind Turbine with Iced Blades. Energies 2019, 12, 2422.
  56. Gantasala, S.; Luneno, J.C.; Aidanpää, J.O. Influence of Icing on the Modal Behavior of Wind Turbine Blades. Energies 2016, 9, 862.
  57. Tesauro, A.; Pavese, C.; Branner, K. Rotor Blade Online Monitoring and Fault Diagnosis Technology Research; Technical Report No. 0042; Department of Wind Energy, Denmark Technical University: Lyngby, Denmark, 2014.
  58. Davis, N. Icing Impacts on Wind Energy Production. 2014. Available online: https://backend.orbit.dtu.dk/ws/portalfiles/portal/104279722/Icing_Impacts_on_Wind_Energy_Production_final.pdf (accessed on 11 September 2021).
More