Acoustic emission (AE) spectroscopy has become the method of choice in many fieldsbecause it is highly sensitive. For example, the AE system constructed by the Vallen company, Germany, has a sampling rate that can reach up to 10 MHz, an arrival time resolution of 100 ns, and an energy resolution of 1.8 × 10⁻¹⁸V2s (i.e., in the attojoule regime, aJ) referred to sensor signal at 34 dB preamplifier gain. A previous study showed simultaneous measurements of the avalanche of stress and AE during mechanically induced twin boundary motion in a shape memory alloy.
- acoustic emission
- geoscience
- fracture
- avalanches
- crackling noise
1. Introduction
Geotectonic processes are often perceived as slow, encapsulated in the colloquial expression of ‘long geological time scales’. With improved experimental facilities to identify the details of geological time dependences, we now understand that they occur on many different time scales. Even those which evolve over thousands of years, such as some metamorphic processes, proceed by short-time atomistic changes which simply add up to the observed long-term evolution. Long-term time evolution is often constituted by a long sequence of short singular events and research has partly shifted from the continuous description of geological processes to the analysis of these singular events from spontaneous changes in chemical composition, atomic ordering, phase transitions, and crack propagation to earthquakes, the collapse of structures in the mining industry and so forth. The investigation of singular ‘rare events’ has entered geological and mineralogical research after it already became a key research field in metallurgy [1][2][1,2], material sciences [3][4][5][3,4,5] and solid-state physics [6][7][8][6,7,8]. In addition, many short events are commonly observed in biogenic materials and in food processing. The observation of the collapse of these materials under stress leads to novel analytical tools to register the collapse mechanisms via the formation of avalanches and allow an assessment of their mechanical stability. The purpose of this paper is to highlight some recent experimental developments for the investigation of commonly used geomaterials and some analogs using acoustic emission spectroscopy, and to connect their analysis with current theoretical models.
2. Avalanches and Acoustic Emission Spectroscopy
When physical systems produce discontinuous burst responses under external fields, the bursts often follow the predictions of avalanche physics and ‘crackling noise’ emitters [6][9][10][6,9,10]. Typical examples include natural avalanche disasters, such as earthquakes [11][12][11,12]. The avalanche behavior does not depend on the size of the earthquake with pico-scale earthquakes and global earthquakes following very similar patterns. Avalanche dynamics also describe the fluctuations of stock markets, which have small fluctuations and stock disasters caused by financial crisis [6], the temporary evolution of neuron connectors during ‘thinking’ processes [13][14][15][13,14,15], and the medical deterioration of brain structures [16][17][16,17]. Other examples are the Barkhausen ‘noise’ of pinned domain walls during magnetization processes [18][19][20][21][18,19,20,21], martensitic transformations [22][23][22,23], plastic deformation in solids [24], materials failure [25], ferroelectric and ferroelastic domain movements [3][26][27][28][29][3,26,27,28,29] etc. Avalanche events are monitored by different monitoring methods, such as force drop measurement [30], optical observation [28], thermal radiation observation [23], etc.
Acoustic emission (AE) spectroscopy has become the method of choice in many fields [5][31][32][33][5,31,32,33] because it is highly sensitive. For example, the AE system constructed by the Vallen company, Germany, has a sampling rate that can reach up to 10 MHz, an arrival time resolution of 100 ns, and an energy resolution of 1.8 × 10 −18 V 2s (i.e., in the attojoule regime, aJ) referred to sensor signal at 34 dB preamplifier gain. A previous study showed simultaneous measurements of the avalanche of stress and AE during mechanically induced twin boundary motion in a shape memory alloy. It showed that the probability of finding an AE event during a stress drop is ~100 times higher than between stress drops. Additionally, the relations between mechanical energy drops and the lower bound of the acoustic emitted energy is approximately proportional [34]. The common drawback of AE is that the local signal is first locally transferred into an acoustic signal inside the sample which then propagates as an acoustic wavelet to the noise detector. The wave profile of AE is hence determined only indirectly by the initial signal and great care has to be taken not to confuse the measured signal with that of the initial atomic event. This problem has been analyzed in great detail [35], the analytical techniques highlight the strong similarity with the deconvolution procedure to analyze propagating waves in the context of geophysical seismology. The current statistical analysis of AE signals, especially its energy probability distribution function (PDF) and the interevent times, are not much affected by wave profiles and there is a large amount of literature which elucidates some of the intricacies of AE spectroscopy [35][36][37][38][35,36,37,38]. The AE signal is in the form of a wave in Figure 1 , and the important parameters of AE waves are their amplitude, duration, rise time, absolute energy, and waiting time.
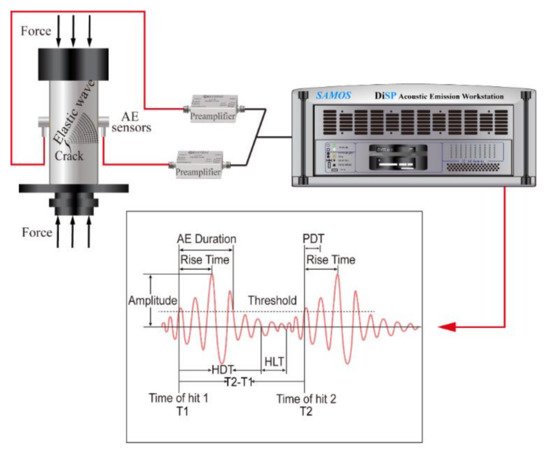
The amplitude A(t) is a function of time t and captures the evolution of the conjugate parameter to the external force. The time evolution of the amplitude is typically initiated by an incubation period where A(t) increases exponentially leading to the maximum amplitude, called A max . The duration is the time period over which an avalanche survives. Experimental time scales typically extend from a few microseconds to many milliseconds. Absolute energies are obtained by numerical integration of the square voltage of signals E = 1/R ∫ ti tj U 2t dt , where t i and t j are starting and ending times of the signal and R = 10 kΩ is a reference resistance. The rise time is the time difference between starting time of a wavelet and time of the wave peak. The waiting times are the times between consecutive events, also called ‘interevent times’.
3. Avalanche Mixing
A crucial outcome of previous research is that failure does generally not follow a single mechanism. This surprising result can be exemplified by the observation of a collapse processes in metals [2] where local porous collapse and the movement of dislocations combine to achieve the final, global collapse. In other cases, the porous collapse entails the avalanche movements of twin boundaries [39][58], or a phase transition triggers catastrophic changes of microstructures related to structural transformations [40][65]. During avalanche evolution we find that often one instability triggers another instability. This means that several avalanche mechanisms interact and mix dynamically [41][66]. In this situation, probability densities are no longer simple power laws but show the typical up-wards curvature of mixed power laws [42][67]. Salje et al. [42][67] extended the analysis of mixing to the use of the ‘maximum likelihood estimation method’, ML [43][44][45][68,69,70]. They derived the characteristic ML profiles for single, underdamped avalanches (a plateau), a damped avalanche (a monotonically increasing profile), and mixed avalanches (a peak before a plateau). The upwards bent probability density distribution translates into a steep increase in the ML estimates for small avalanche energies which peaks at a maximum value, which is bounded by the energy exponent of the avalanche with the higher exponent. It then decays towards the exponent of the second avalanche. This rather complex ML profile was identified in several experimental investigations, which shows that avalanche mixing is indeed a much more common phenomenon than previously assumed [6].
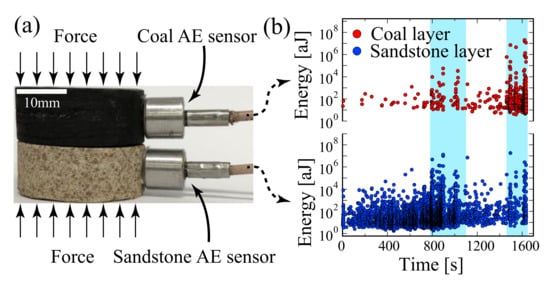
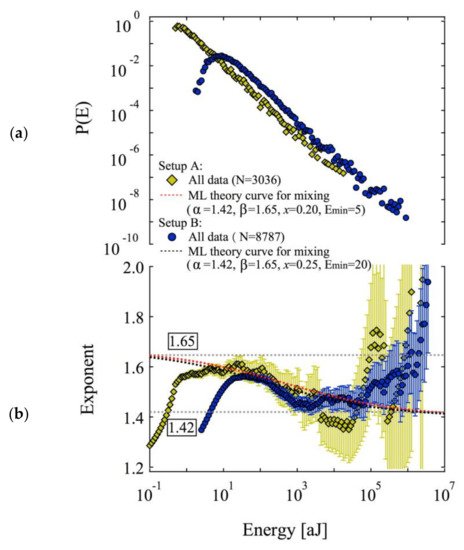
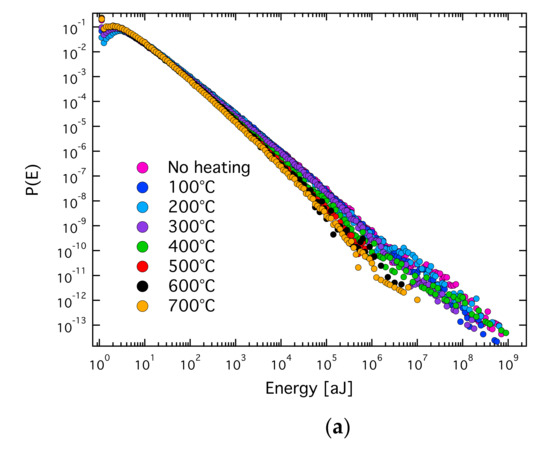
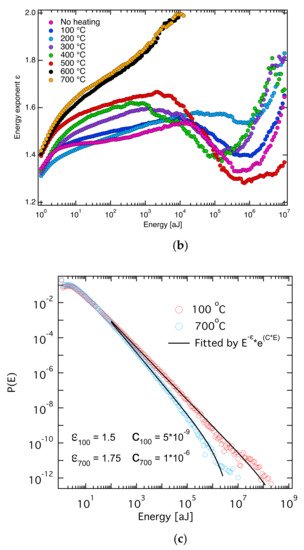
In order to confirm the mixing mechanism for different avalanches during a collapse process, Salje and his coauthors designed a simple and instructive experimental arrangement. They used two materials with different strengths and superimposed them in the same stress device ( Figure 26 ) [46][71]. The stress was identical for both materials, but the avalanche dynamics were different. This experiment combined one porous material at the early stage of uncorrelated, random damage mode while the second material was more highly damaged within the correlated failure state. The common stress created two avalanche processes simultaneously and ensured mixing between them. In the compression experiment, they used coal and sandstone as test materials. As predicted by theory, the probability distribution of the AE energy of the composite rock was a nonpower law with an upwards bent of the probability distribution function (PDF) in double logarithmic display. The maximum likelihood estimation curve showed the predicted increase, peak and decrease towards the lower exponent ( Figure 37 ). Several other compression experiments show that the mixing effect of different avalanche mechanisms is a common phenomenon. For example, compression experiments on granite show that the crumbling and fracture mechanism of granite mineral particles can form a state of avalanche mixing [47][72]. High temperature annealing (near the α-β phase transition temperature of quartz) reduces the internal constraints of granite and weakens the effect of fracture, so that the mixing between crumbles and fracture is observed ( Figure 48 ). The AE crack analysis helps to evaluate whether there is prior damage in granite, which plays an important role in the safety assessment of granite caves for nuclear waste deposition.
For uniaxial compression under stress control, the sample compression stops after the first cracks occur. If the stress is further increased, it constitutes a confining effect and additional friction occurs. This effect was exemplified for sandstone where confined compression tests always show avalanche mixing, in contrast with the uniaxial compression test without confinement [48][73].
In addition to geological materials, the mixing of different avalanche mechanisms has also been studied in several materials. For example, in a porous Mg-Ho alloy, the interaction between dislocation and fracture leads to the mixing of avalanche mechanism during compression and tension [2]. The critical exponents of the two mechanisms are consistent with the mean field theory and the force integrated mean field theory, respectively. Furthermore, the two avalanche mechanisms can be separated by synchronous waveform analysis. Chen and her collaborators have demonstrated how to separate dislocation moves and entanglements in 316 L stainless steel. They showed that the main difference between the two mechanisms is the average duration for each type of avalanche [49][74].
4. Applications
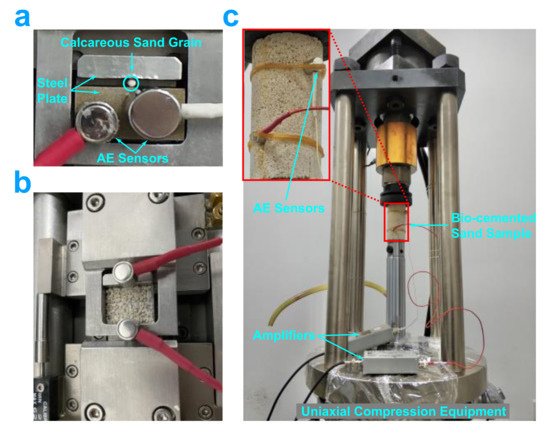
The energy consumption to produce cement for building work is particularly high. The cement industry creates significant environmental pollution, so that the development of new environmentally friendly cementitious materials has become a research hotspot in many countries. Some micro-organisms produce calcium carbonate in the process of metabolism, which induce calcium carbonate deposition during cementation [50][51][75,76]. One of the important applications is in the construction of calcareous sand islands and reefs. Calcareous sand exists widely throughout the Earth’s tropical zones. The main construction requirement is that calcareous sand needs to be reinforced for foundation construction. Wang et.al. carried out compression failure experiments on single calcareous sand grain, unconsolidated sands and biocemented sand block [52][77] (see Figure 59 ). All three materials show avalanches under compression. Through the analysis of the avalanche characteristics of the three samples, it was found that the destruction mechanism of the biocemented calcareous sand is the failure of the bonding between sand particles via the biogenic calcium carbonate. Under stress the biocemented calcareous sand blocks degenerate rapidly back into sands without cementation and some carbonate clusters. In this case, the observation of crackling noise provides an excellent indicator for the stability of biocemented structures.
Teeth are the strongest part of the human body. They not only have the function of chewing, but also play an important role in pronunciation and facial appearances. They also contain microcracks which are not routinely found by optical and CT examination in dental clinics. This leads to wrong diagnosis of crack formation before the cracks become large enough to be observed optically. Moreover, tooth cracks do not self-repair, they can induce periodontitis and, ultimately, the loss of the tooth. The cracks do not induce pain at the initial stage, making it difficult for patients to detect tooth damage. When pain occurs, the best opportunity for treatment has already been missed. Wang et al. used healthy human molars to carry out damage examinations and found that the process of tooth cracking displays obvious avalanche characteristics [53][78]. Human teeth are composed of hydroxyapatite from a nanometer to a micrometer scale and are typically brittle. Cracks progresses through the tooth dentin pores, and exhibit abundant microstructures such as crack bridging, crack deflection and crack bifurcation. This complex crack evolution leads to avalanche dynamics. The stress–strain curve is a typically serrated with clustering of the acoustic emission signal. The absolute energy of AE meets the power-law distribution over nearly seven energy decades with a power-law exponent ε = 1.4, Figure 510 . The statistical distributions of signal amplitudes, durations, correlations between energies and amplitudes, and the relationship between amplitude and duration all meet the prediction of mean field theory very well. These avalanche signals do not appear when the tooth is undamaged so that the acoustic emission method is a warning of developing microcracks in teeth.
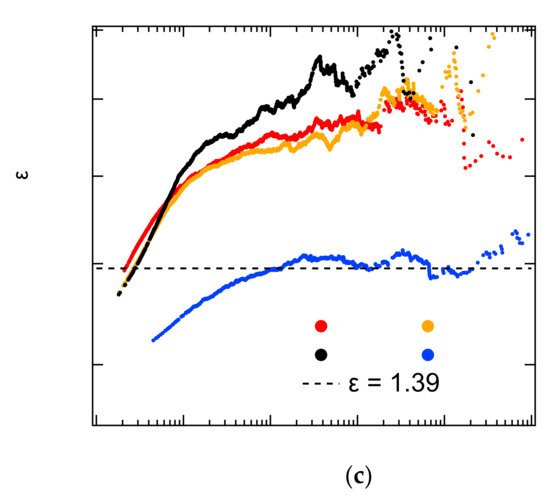
When a constant force is applied to a material it still transforms via creep. Even if the applied force is lower than the ultimate strength of the material, the material will still fail after long-term damage accumulation. Creep is predominant in geotechnical and geological engineering, so it is necessary to monitor creep and predict disaster accumulation over time. According to the creep failure experiment of sandstone [54][79], it is found that the acoustic emission signal is weaker in the stable creep stage than under constant strain rates. When the failure is approaching collapse, the AE signal of creep shows a series of activity periods ( Figure 611 ), which is different from the AE signal of increasing uniaxial compression. The probability density distribution of AE in the first few cycles has a high critical exponent value of ε = 1.6–1.7, while the final failure shows a fracture exponent of ε = 1.4. This creep results are consistent with fiber bundle simulations [55][56][80,81].
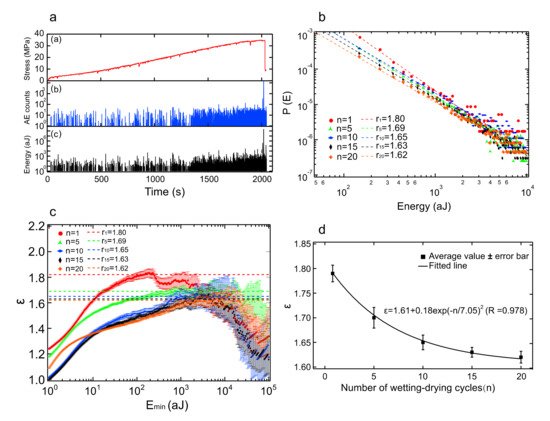
Periodic changes of water levels in reservoirs causes wet cycle damage of reservoir rocks. The Three Gorges Reservoir was formed by the construction of China’s Three Gorges Dam, the world’s largest water conservancy project, which contains changes of water levels by nearly 30 m. Xie et al. used the typical sandstone in the Three Gorges Reservoir Area to measure acoustic emission and nuclear magnetic resonance images to study the dry–wet cycle damage [57][82]. The internal damage of sandstone caused by dry–wet cycles is best seen by nuclear magnetic imaging. The detailed relation between the AE energy distribution exponent and the number of wetting–drying cycles is shown in Figure 712 , and the exponent values decreased in an exponential fashion towards the mean field value of 1.6.