Camellia genus (Theaceae) is comprised of world famous ornamental flowering plants. C. japonica L. and C. sasanqua Thunb are the most cultivated species due to their good adaptation. The commercial interest in this plant linked to its seed oil increased in the last few years due to its health attributes, which significantly depend on different aspects such as species and environmental conditions. Therefore, it is essential to develop fast and reliable methods to distinguish between different varieties and ensure the quality of Camellia seed oils. The present work explores the study of Camellia seed oils by species and location. Two standardized gas chromatography methods were applied and compared with that of data obtained from proton nuclear magnetic resonance spectroscopy (1H-NMR) for fatty acids profiling. The principal component analysis indicated that the proposed 1H-NMR methodology can be quickly and reliably applied to separate specific Camellia species, which could be extended to other species in future works.
- Camellia oil
- authentication
- quality
- chromatographic techniques
- nuclear magnetic resonance
- chemometrics
1. Introduction
2. Results and Discussion
2.1. Oil Content
| Sample | Species | Origin-Code | Harvest | Extraction Yield | Acid Value | Iodine Value |
|---|---|---|---|---|---|---|
| MUFA | PUFA | ∑UFA | (w/w, %) | (mg KOH/g Oil) | (g I2/100 g Oil) | |
| 1 | C. japonica | Cuntis | Sep. |
| Peak | δ (ppm) | Multiplicity | Functional Group | Compound | ||||
|---|---|---|---|---|---|---|---|---|
| 1 | 6.69 ± 0.00 c | 1.66 ± 0.02 ef | 26.0 | 5.61 ± 0.02 jk | 79.1 ± 0.5 de | |||
| 87.1 ± 0.1 gh | 0.72 ± 0.03 d–f | 3.59 ± 0.02 d | 0.25 ± 0.01 ab | 8.35 | 88.07 | 3.59 | 91.65 | |
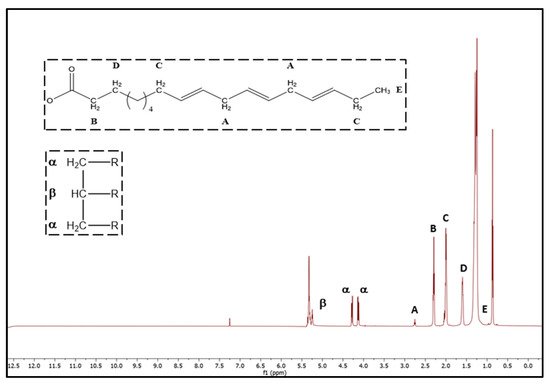
| 1 | 5.32 | m | –CH=CH– | acyl group | -- | |||
| 2 | C. japonica | EFA-826 | Sep. | 31.9 | ||||
| 2 | 7.44 ± 0.07 fg | 0.39 ± 0.00 b | 82.2 ± 0.0 g | |||||
| 1.94 ± 0.04 ij | 86.5 ± 0.1 fg | 0.76 ± 0.04 d–g | 3.08 ± 0.03 bc | 0.24 ± 0.02 bc | 9.38 | 87.53 | 3.08 | 90.62 |
| Linoleic | A | 2.74 ppm | 33.3 | 2 × linoleic | –CH2 | |||
| Oleic | C | 2.01 ppm | –O–COR | 16.7glyceryl group | ||||
| linolenic and linoleic | 4 | 2.74 | t | =CH– | ||||
| Saturated | B | CH | 2 | 2.29 ppm–CH= | 33.3acyl group (linoleic and linolenic group) | |||
| linolenic + linoleic + oleic | 5 | 2.29 | dt | –OCO–2)n– | acyl group | |||
| 9 | 0.98 | |||||||
| ND | ||||||||
| 14.58 | ||||||||
| 7.89 | ||||||||
| 98.96 | ||||||||
| 20 * | C. japonica | 80.7 | 6.65 |
| Fatty Acid | Label | 1H NMR Signal | Reference Area (Signal) | Subtration | |||||||||||
|---|---|---|---|---|---|---|---|---|---|---|---|---|---|---|---|
| 0.29 | |||||||||||||||
| Linolenic | E | ||||||||||||||
| 12.4 | |||||||||||||||
| 0.98 ppm | 2 | 5.25 | m | –CH–O–COR | 3 | C. japonica | EFA-942 | Sep. | 21.6 | ||||||
| 3 | 6.84 ± 0.03 cd | 1.81 ± 0.02 e | 82.2 ± 0.2 g | ||||||||||||
| 1.64 ± 0.02 d–f | 87.7 ± 0.1 hi | 0.66 ± 0.03 c–e | 3.12 ± 0.05 bc | ND | 8.48 | 88.43 | 3.12 | 91.52 | 4 | C. japonica | Quiñones de León/O Castro-876 | Aug. | 24.0 | ||
| 4 | 7.80 ± 0.06 hi | 5.55 ± 0.04 j | 83.2 ± 0.1 gh | ||||||||||||
| 1.68 ± 0.01 e–g | 85.3 ± 0.2 c–e | 0.92 ± 0.06 h | 4.06 ± 0.09 ef | 0.22 ± 0.00 a | 9.48 | 86.43 | 4.06 | 90.52 | 5 | C. japonica | Quiñones de León/O Castro-877 | Aug. | 24.0 | 5.66 ± 0.00 k | 85.6 ± 0.0 i |
| 6 | C. japonica | Pazo de Lourizán | Sep. | 28.4 | 5.60 ± 0.01 jk | 78.7 ± 0.4 cd | |||||||||
| 7 | C. japonica | Pazo de Gandarón | Aug. | 23.2 | 4.52 ± 0.04 i | 76.5 ± 0.1 b | |||||||||
| 8 | C. japonica | Castelo de Soutomaior | Sep. | 19.7 | 5.61 ± 0.00 jk | 80.9 ± 0.2 f | |||||||||
| 9 | C. japonica | Pazo de Rubianes–Hob Hope | Nov. | 16.1 | 5.62 ± 0.00 jk | 79.4 ± 0.1 de | |||||||||
| 10 | C. japonica | Pazo de Rubianes–Augusto Leal | Nov. | 17.5 | 5.63 ± 0.00 jk | 78.8 ± 0.5 cd | |||||||||
| 11 | C. japonica | Pazo de Rubianes–Momoiro–Bokuhan | Nov. | 27.3 | 5.62 ± 0.00 jk | 80.1 ± 0.2 ef | |||||||||
| 12 | C. japonica | Pazo de Rubianes–Bento de Amorim | Nov. | 16.1 | 5.62 ± 0.02 jk | 70.3 ± 0.4 a | |||||||||
| 13 | C. japonica | Pazo de Rubianes–Royal Velvet | Nov. | 24.1 | 5.61 ± 0.00 jk | 83.1 ± 0.3 gh | |||||||||
| 14 | C. sasanqua | EFA-826 | Sep. | 30.1 | 0.52 ± 0.00 c | 89.8 ± 0.1 j | |||||||||
| 15 | C. sasanqua | EFA-942 | Sep. | 25.0 | 1.07 ± 0.00 d | 82.3 ± 0.0 g | |||||||||
| 16 | C. sasanqua | Pazo de A Saleta | Oct. | 22.1 | 2.17 ± 0.01 f | 92.0 ± 0.5 k | |||||||||
| 17 | C. sasanqua | Pazo de Rubianes | Nov. | 26.1 | 3.41 ± 0.06 g | 83.9 ± 0.4 h | |||||||||
| 18 | C. reticulata | San Vicente do Mar | Oct. | 16.6 | 3.68 ± 0.01 h | 77.2 ± 0.3 b | |||||||||
| 19 | C. hiemalis | Pazo de Rubianes | Nov. | 22.6 | 5.64 ± 0.00 jk | 83.0 ± 0.4 gh |
2.2. Quality Index Parameters
2.3. GC-FID Analysis
| Sample | C14:0 | C16:0 | C16:1 | C18:0 | C18:1 | C18:2 | C18:3 | C20:0 | C20:1 | ∑SFA | MUFA | PUFA | ∑UFA | ||||||
|---|---|---|---|---|---|---|---|---|---|---|---|---|---|---|---|---|---|---|---|
| 1 | 0.06 ± 0.01 bc | 8.24 ± 0.26 a | 0.10 ± 0.02 a–c | 2.05 ± 0.05 b–d | 82.20 ± 0.66 f–h | 5.56 ± 0.12 c–e | 0.29 ± 0.02 a–c | 0.05 ± 0.01 ab | 0.29 ± 0.02 ab | 10.40 | 82.59 | 5.85 | 88.45 | ||||||
| 2 | 0.06 ± 0.01 bc | 9.17 ± 0.05 d–f | 0.10 ± 0.01 a–c | 2.43 ± 0.09 g–i | 81.59 ± 0.48 e–h | glyceryl group5.12 ± 0.09 b–d | 0.23 ± 0.02 a | 0.05 ± 0.01 ab | 0.57 ± 0.07 f | 11.70 | 82.26 | 5.35 | 87.61 | ||||||
| 3 | 0.04 ± 0.01 a | 9.46 ± 0.23 e–g | 0.12 ± 0.01 a–c | 2.36 ± 0.08 f–h | 80.96 ± 0.47 c–g | 5.65 ± 0.06 e | 0.31 ± 0.03 a–d | 0.04 ± 0.01 a | 0.36 ± 0.03 b–d | 11.90 | 81.44 | 5.96 | 87.40 | ||||||
| 3 | 4.27 | 4 | 0.07 ± 0.01 c | 9.80 ± 0.11 gh | 0.09 ± 0.01 ab | 2.14 ± 0.09 c–f | 81.07 ± 0.56 d–g | 6.41 ± 0.07 f | 0.30 ± 0.04 a–d | 0.08 ± 0.01 bc | 0.37 ± 0.03 b–d | 12.09 | 81.53 | 6.71 | 88.24 | ||||
| 5 | |||||||||||||||||||
| 5 | 0.07 ± 0.01 c | 9.53 ± 0.08 fg | 0.12 ± 0.01 a–c | 2.11 ± 0.06 c–e | 7.51 ± 0.03 gh81.12 ± 0.47 d–g | 1.58 ± 0.01 de | 86.1 ± 0.1 ef | CH0.90 ± 0.07 gh | 3.75 ± 0.04 de6.37 ± 0.07 f | 0.25 ± 0.03 ab | 0.07 ± 0.01 a–c | 0.24 ± 0.03 a | 0.20 ± 0.01 a11.78 | 9.09 | 87.17 | 23.75 | –90.9181.48 | 6.62 | 88.10 |
| acyl group | 6 | 0.06 ± 0.01 bc | 9.26 ± 0.05 d–f | 0.13 ± 0.01 bc | 2.29 ± 0.07 e–g | 81.06 ± 0.56 d–g | |||||||||||||
| 6 | 8.04 ± 0.17 i | 1.49 ± 0.02 cd | 85.5 ± 0.3 de | 5.61 ± 0.05 de | 0.32 ± 0.02 a–d | 0.07 ± 0.01 a–c | 0.74 ± 0.01 d–f | 4.27 ± 0.09 f–h | 0.33 ± 0.02 a–c | 11.67 | 81.51 | 5.93 | ND87.44 | ||||||
| 9.53 | 86.20 | 4.27 | 90.47 | ||||||||||||||||
| 6 | 2.01 | m | –CH2–CH=CH– | acyl group | 7 | 0.05 ± 0.01 ab | 10.41 ± 0.22 ij | 0.18 ± 0.02 d | |||||||||||
| 7 | 8.46 ± 0.01 j | 0.89 ± 0.02 a | 84.6 ± 0.1 c | 2.28 ± 0.07 defg | 78.88 ± 0.33 b–d | 7.12 ± 0.09 gh | 0.26 ± 0.04 abc | 0.89 ± 0.02 gh0.05 ± 0.01 ab | 4.35 ± 0.06 f–h | ND | 9.35 | 85.530.28 ± 0.02 ab | 12.78 | 79.33 | 7.38 | 86.72 | |||
| 4.35 | 89.86 | 8 | 0.05 ± 0.01 ab | 9.05 ± 0.05 c–e | 0.10 ± 0.01 a–c | 2.46 ± 0.05 g–i | |||||||||||||
| 8 | 79.18 ± 0.59 b–d | 6.92 ± 0.19 c–e | 1.86 ± 0.03 g–i | 87.6 ± 0.4 hi | 0.66 ± 0.03 c–e | 7.43 ± 0.06 h | 0.32 ± 0.03 a–d | 0.09 ± 0.01 c | 0.53 ± 0.03 ef | 3.01 ± 0.14 b11.64 | 79.81 | 7.75 | 87.56 | ||||||
| ND | 8.78 | 88.23 | 3.01 | 91.22 | 9 | 0.05 ± 0.01 ab | 8.21 ± 0.11 a | 0.12 ± 0.01 a–c | 1.85 ± 0.05 ab | 83.04 ± 0.54 gh | 5.08 ± 0.08 bc | 0.35 ± 0.03 b–e | 0.05 ± 0.01 ab | 0.44 ± 0.03 c–e | 10.15 | 83.59 | 5.43 | 89.02 | |
| 10 | 0.05 ± 0.01 ab | 9.43 ± 0.11 e–g | 0.12 ± 0.01 a–c | 2.61 ± 0.04 ij | 81.65 ± 0.64 e–h | 5.83 ± 0.08 e | 0.33 ± 0.02 a–d | 0.06 ± 0.01 a–c | |||||||||||
| 14 | 7.11 ± 0.10 de | 1.78 ± 0.03 f–h | 85.6 ± 0.2 de | 0.53 ± 0.01 a–c | 4.54 ± 0.05 gh | 0.41 ± 0.00 d | 8.89 | 86.57 | 4.54 | 91.11 | |||||||||
| 15 | 7.17 ± 0.03 e | 1.97 ± 0.01 j | 85.2 ± 0.1 cd | 0.57 ± 0.00 b–d | 4.70 ± 0.03 h | 0.38 ± 0.00 d | 9.14 | 86.13 | 4.70 | 90.86 | |||||||||
| 16 | 7.50 ± 0.11 gh | 1.84 ± 0.04 g–i | 83.4 ± 0.3 b | 0.42 ± 0.04 a | 6.53 ± 0.15 i | 0.33 ± 0.01 c | 9.34 | 84.13 | 6.53 | 90.66 | |||||||||
| 17 | 8.39 ± 0.06 j | 1.46 ± 0.05 bc | 85.2 ± 0.3 cd | 0.75 ± 0.05 d–h | 4.21 ± 0.20 fg | ND | 9.85 | 85.93 | 4.21 | 90.15 | |||||||||
| 18 | 9.32 ± 0.07 k | 2.64 ± 0.02 kl | 83.3 ± 0.2 b | 0.46 ± 0.02 ab | 4.03 ± 0.15 ef | 0.21 ± 0.01 a | 11.96 | 84.00 | 4.03 | 88.04 | |||||||||
| 19 | 7.84 ± 0.07 i | 1.28 ± 0.03 b | 86.0 ± 0.1 ef | 0.65 ± 0.04 c–f | 4.23 ± 0.03 fg | ND | 9.12 | 86.67 | 4.23 | 90.88 |
2.5. H-NMR Analysis
| Sample | Species | C18:1 (MUFA) | C18:2 | C18:3 | ∑SFA | PUFA | ∑UFA | |||||||||||||||||
|---|---|---|---|---|---|---|---|---|---|---|---|---|---|---|---|---|---|---|---|---|---|---|---|---|
| 1 | C. japonica | 89.9 ± 0.4 f | 5.78 ± 0.19 b–e | ND | 12.36 | 5.78 | 95.63 | |||||||||||||||||
| 2 | C. japonica | 86.3 ± 0.4 e | 4.33 ± 0.00 a | ND | 12.92 | 4.33 | 90.63 | |||||||||||||||||
| 3 | C. japonica | 86.0 ± 0.2 de | 5.33 ± 0.00 bc | ND | 12.64 | 5.33 | 91.35 | |||||||||||||||||
| 4 | C. japonica | 94.3 ± 0.3 g | 7.33 ± 0.00 hi | ND | 15.25 | 7.33 | 101.63 | |||||||||||||||||
| 5 | C. japonica | 96.4 ± 0.6 hi | 7.33 ± 0.00 hi | ND | 14.75 | 7.33 | 103.69 | |||||||||||||||||
| 6 | C. japonica | 86.4 ± 0.2 e | 7.11 ± 0.19 g–i | ND | 13.75 | 7.11 | 93.46 | |||||||||||||||||
| 7 | C. japonica | 85.6 ± 0.9 de | 6.67 ± 0.33 e–h | ND | 14.25 | 6.67 | ||||||||||||||||||
| 7 | 1.61 | m | –OCO–CH2–CH | 92.30 | ||||||||||||||||||||
| 2 | – | acyl group | 8 | C. japonica | 89.6 ± 0.3 f | 5.33 ± 0.00 bc | ND | 13.36 | 5.33 | 94.96 | ||||||||||||||
| 8 | 1.29 | m | 9 | 6.07 ± 0.02 a | 1.27 ± 0.01 b | 89.2 ± 0.1 j | ||||||||||||||||||
| 9 | C. japonica | 90.4 ± 0.7 f | 5.22 ± 0.19 b | 0.62 ± 0.04 c–e | 2.79 ± 0.06 b | ND | ND | 11.647.34 | 89.87 | 2.79 | 92.66 | |||||||||||||
| 5.22 | t | –CH=CH–CH | 2 | 95.58 | –CH3 | linoleic acyl group | ||||||||||||||||||
| 22.2 | dd | –( | CH | 10 | 7.45 ± 0.11 fg | 2.05 ± 0.08 j | 85.5 ± 0.6 de | 0.44 ± 0.04 c–e | 1.18 ± 0.06 i | 3.49 ± 0.39 cd | 0.29 ± 0.01 c | 9.5012.14 | 82.20 | 6.16 | 87.03 | 3.4988.36 | ||||||||
| 90.50 | ||||||||||||||||||||||||
| 11 | ||||||||||||||||||||||||
| 10 | C. japonica | 98.1 ± 0.8 i | 6.33 ± 0.33 d–g | ND | 14.69 | 6.33 | 9104.41 | 0.88 | 11 | 0.07 ± 0.01 c | 9.13 ± 0.07 def | 0.14 ± 0.01 cd | 1.72 ± 0.06 a | 82.58 ± 0.80 f–h | 5.05 ± 0.14 b | 0.25 ± 0.04 ab | 0.06 ± 0.01 a–c | 0.53 ± 0.03 ef | 7.17 ± 0.08 ef10.98 | 83.25 | 5.30 | 88.55 | ||
| 1.39 ± 0.05 bc | 87.4 ± 0.3 hi | 0.80 ± 0.06 f–h | ||||||||||||||||||||||
| t | –CH | 2 | –CH2–CH2–CH3 | saturated oleic except linoleic acyl group | 112.92 ± 0.11 b | C. japonica | 97.8 ± 0.3 i | 5.11 ± 0.19 ab | ND0.34 ± 0.01 c | 8.56 | 13.63 | 5.11 | 102.9188.50 | 2.92 | 91.44 | 12 | 0.06 ± 0.01 bc | 8.67 ± 0.08 bc | 0.10 ± 0.01 a–c | 3.88 ± 0.09 m | 83.62 ± 1.26 h | 3.91 ± 0.06 a | 0.32 ± 0.03 a–d | 12.69 |
| 12 | 6.38 ± 0.05 b | 0.08 ± 0.01 c | 0.44 ± 0.04 c–e | 84.16 | 2.76 ± 0.05 l | 87.9 ± 0.2 i | ||||||||||||||||||
| 12 | C. japonica | 94.5 ± 1.0 gh | 5.11 ± 0.19 ab | 0.92 ± 0.01 gh | 2.08 ± 0.09 a | ND | 9.14 | 88.77 | 2.08 | 90.86 | 4.23 | 88.39 | ||||||||||||
| ND | 16.02 | 5.11 | 99.63 | 13 | 0.06 ± 0.01 bc | 8.99 ± 0.10 b–d | 0.12 ± 0.01 a–c | |||||||||||||||||
| 13 | 7.06 ± 0.11 de | 2.73 ± 0.03 j | 82.86 ± 1.16 gh | 5.06 ± 0.07 bc | 0.28 ± 0.06 a–c | 0.06 ± 0.01 a–c | 0.44 ± 0.04 c–e | 11.83 | 2.02 ± 0.03 j | 87.1 ± 0.3 g–i | 0.77 ± 0.02 e–h83.41 | 3.02 ± 0.14 b | ND | 9.08 | 87.905.34 | 88.76 | ||||||||
| 3.02 | ||||||||||||||||||||||||
| 13 | C. japonica | 93.3 ± 0.4 g | 90.92 | 5.56 ± 0.19 b–d | ND | 13.91 | 5.56 | 98.85 | 14 | 0.05 ± 0.01 abc | 8.59 ± 0.16 ab | 0.07 ± 0.01 a | 2.12 ± 0.07 c–e | 80.54 ± 0.46 c–f | 6.82 ± 0.12 fg | 0.30 ± 0.01 a–d | 0.06 ± 0.01 a–c | 0.57 ± 0.05 f | 10.82 | 81.18 | 7.12 | 88.30 | ||
| 14 | C. sasanqua | 84.7 ± 0.1 c–e | 6.67 ± 0.00 f–h | ND | 12.25 | 6.67 | 91.41 | 15 | 0.05 ± 0.01 abc | 8.86 ± 0.10 b–d | 0.10 ± 0.01 a–c | 2.57 ± 0.05 h–j | 79.00 ± 0.48 b–d | 7.44 ± 0.09 h | 0.45 ± 0.04 ef | 0.05 ± 0.01 ab | 0.82 ± 0.05 g | 11.53 | 79.93 | 7.89 | 87.81 | |||
| 15 | C. sasanqua | 83.6 ± 0.1 c | 7.67 ± 0.00 i | ND | 12.86 | 7.67 | 91.24 | 16 | 0.06 ± 0.01 bc | 9.05 ± 0.08 c–e | 0.13 ± 0.02 bc | 2.48 ± 0.07 g–i | 78.68 ± 0.53 bc | 8.00 ± 0.09 i | 0.31 ± 0.03 a–d | 0.08 ± 0.01 bc | 0.52 ± 0.03 ef | 11.66 | 79.33 | 8.31 | ||||
| 16 | 87.64 | |||||||||||||||||||||||
| C. sasanqua | 85.7 ± 0.2 de | 10.33 ± 0.00 j | ND | 13.80 | 10.3 | 96.08 | 17 | 0.07 ± 0.01 c | 10.77 ± 0.09 j | 0.11 ± 0.02 a–c | 1.95 ± 0.12 bc | 79.36 ± 1.20 b–e | 6.95 ± 0.13 gh | 0.36 ± 0.05 c–e | 0.06 ± 0.01 abc | 0.43 ± 0.03 c–e | 12.84 | 79.90 | 7.31 | 87.22 | ||||
| 17 | C. sasanqua | 84.1 ± 0.3 cd | 7.33 ± 0.00 hi | ND | 14.36 | 7.33 | 91.41 | 18 | 0.05 ± 0.01 ab | 10.32 ± 0.11 i | 0.11 ± 0.01 a–c | 3.17 ± 0.07 k | 77.97 ± 0.76 b | 7.18 ± 0.07 gh | 0.41 ± 0.04 d–f | 0.04 ± 0.01 a | 0.35 ± 0.04 a–c | 13.58 | 78.43 | 7.59 | 86.01 | |||
| 19 | 0.06 ± 0.01 bc | 10.20 ± 0.11 hi | 0.13 ± 0.01 bc | 1.85 ± 0.06 ab | 79.23 ± 0.51 b–d | 7.12 ± 0.10 gh | 0.36 ± 0.01 c–e | 0.07 ± 0.01 abc | 0.44 ± 0.04 c–e | 12.17 | 79.79 | 7.49 | 87.28 |
2.4. GC-MS Analysis
| Scheme 16. | C16:0 | C18:0 | C18:1 ω-9 cis | C18:1 ω-9 trans | C18:2 ω-6,-9 | C20:1 ω-9 | ∑SFA |
|---|---|---|---|---|---|---|---|
| 18 | |||||||
| C. reticulata | |||||||
| 81.0 ± 0.5 b | |||||||
| 7.11 ± 0.19 g–i | |||||||
| ND | |||||||
| 17.25 | |||||||
| 7.11 | |||||||
| 88.07 | |||||||
| 19 | C. hiemalis | 91.1 ± 1.7 f | 7.89 ± 0.77 i | ||||
| 6.94 | 87.64 | ||||||
| 21 ** | C. sasanqua | 82.3 | 6.20 | 0.30 | 11.2 | 6.50 | 88.80 |
| 22 ** | C. reticulata | 84.5 | 5.69 | 0.26 | 9.58 | 5.95 | 90.42 |
| 23 ** | C. oleifera | 83.8 | 7.78 | 0.41 | 8.04 | 8.19 | 91.96 |
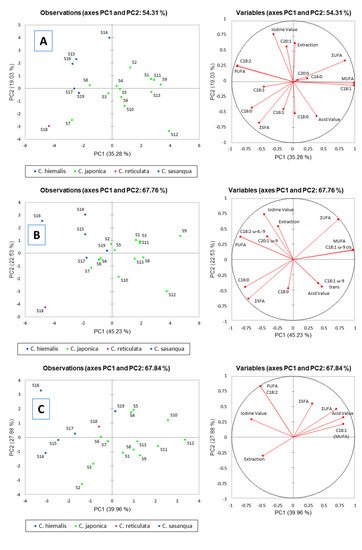
2.6. Principal Component Analysis (PCA)
References
- Cothran, J.R. Treasured Ornamentals of Southern Gardens—Michaux’s Lasting Legacy. Castanea 2004, 69, 149–157.
- Vela, P.; Salinero, C.; Sainz, M.J. Phenological growth stages of Camellia japonica. Ann. Appl. Biol. 2013, 162, 182–190.
- Salinero, C.; Feás, X.; Mansilla, J.P.; Seijas, J.A.; Vázquez-Tato, M.P.; Vela, P.; Sainz, M.J. 1H-nuclear magnetic resonance analysis of the triacylglyceride composition of cold-pressed oil from Camellia japonica. Molecules 2012, 17, 6716–6727.
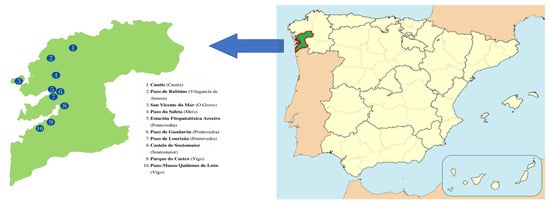
- Salinero, C.; Vela, P.; Castiñeiras, J.R.; Sainz, M.J. Development of a touristic route of winter gardens in Galicia (NW Spain) based on the Camellias: The Camellia Route. Int. Camellia J. 2014, 46, 38–39.
- Sahari, M.A.; Ataii, D.; Hamedi, M. Characteristics of tea seed oil in comparison with sunflower and olive oils and its effect as a natural antioxidant. J. Am. Oil Chem. Soc. 2004, 81, 4.
- Wang, L.; Lee, F.S.C.; Wang, X.; He, Y. Feasibility study of quantifying and discriminating soybean oil adulteration in Camellia oils by attenuated total reflectance MIR and fiber optic diffuse reflectance NIR. Food Chem. 2006, 95, 529–536.
- Zhu, X.Y.; Lin, H.M.; Chen, X.; Xie, J.; Wang, P. Mechanochemical-Assisted Extraction and Antioxidant Activities of Kaempferol Glycosides from Camellia oleifera Abel. Meal. J. Agric. Food Chem. 2011, 59, 3986–3993.
- Yu, Y.; Ren, S.; Tan, K. Study on climatic regionalization and layer and belt distribution of oiltea Camellia quality in China. J. Nat. Resour. 1999, 14, 123–127.
- Cheng, Y.T.; Wu, S.L.; Ho, C.Y.; Huang, S.M.; Cheng, C.L.; Yen, G.C. Beneficial Effects of Camellia Oil (Camellia oleifera Abel.) on Ketoprofen-Induced Gastrointestinal Mucosal Damage through Upregulation of HO-1 and VEGF. J. Agric. Food Chem. 2014, 62, 642–650.
- Ruter, J.M. Nursery production of tea oil Camellia under different light levels. In Trends New Crop New Uses; Janick, J., Whipkey, A., Eds.; ASHS Press: Alexandria, VA, USA, 2002; pp. 222–224.
- Jung, E.; Lee, J.J.; Baek, J.; Jung, K.; Lee, J.J.; Huh, S.; Kim, S.; Koh, J.; Park, D. Effect of Camellia japonica oil on human type I procollagen production and skin barrier function. J. Ethnopharmacol. 2007, 112, 127–131.
- Van Thang, H.; Van Do, T.; Sato, T.; Khai, N.Q. Tea oil Camellia plantation, an enormous potentiality for poverty reduction. Asian J. Agric. Ext. Econ. Sociol. 2014, 3, 1–12.
- Zhong, H.Y.; Wan, C.N.; Xie, B.X. The present status and development tendency of utilization and processing in Camellia oil in China. China For. Sci. Technol. 2001, 15, 6–9.
- Berti, M.; Gesch, R.; Eynck, C.; Anderson, J.; Cermak, S. Camelina uses, genetics, genomics, production, and management. Ind. Crop. Prod. 2016, 94, 690–710.
- Yan, C.; Liu, Y.; Cao, L.; Xia, M.; Zhang, Q.; Li, C.; Ruan, R. Oligosaccharide preparation from microwave-ethanol pretreated Camellia oleifera seed shell by enzymolysis of Agrocybe aegerita. Ind. Crops Prod. 2021, 161, 113155.
- QingYun, L.; Le, Y.; YiMin, Q.; YanLin, L.; Min, C.; YouYan, L. The preparation of biodiesel from Camellia oil catalyzed by immobilized enzyme. Kezaisheng Nengyuan/Renew. Energy Resour. 2012, 30, 55–59.
- Zheng, J.; Liu, H.; Zhou, L. Evaluation of Camellia oleifera as a source for biodiesel production. In Proceedings of the 2011 International Conference on Electrical and Control Engineering, ICECE 2011—Proceedings, Yichang, China, 16–18 September 2011; pp. 1551–1554.
- Allen, C.B. Thermal degradation and biodiesel production using Camellia oleifera seed oil. Bachelor’s Thesis, University of Georgia, Athens, Georgia, 2015.
- Huang, Y.; Li, F.; Bao, G.; Wang, W.; Wang, H. Estimation of Kinematic Viscosity of Biodiesel Fuels from Fatty Acid Methyl Ester Composition and Temperature. J. Chem. Eng. Data 2020, 65, 2476–2485.
- Yahaya, L.E.; Adebowale, K.O.; Olu-Owolabi, B.I.; Menon, A.R.R.; Arr, M. Compositional Analysis of Tea (Camellia sinensis) Seed Oil and Its Application. Int. J. Res. Chem. Environ. 2011, 1, 153–158.
- Poojary, M.M.; Passamonti, P. Interesterification of mafura butter and Camellia oil for cosmeceutical formulations: Chemical composition and physicochemical properties of products. Ind. Crops Prod. 2020, 147, 112178.
- He, L.; Guo-Ying, Z.; Zhang, H.-Y.; Jun-Ang, L. Research progress on the health function of tea oil. J. Med. Plants Res. 2011, 5, 485–489.
- Lee, C.P.; Yen, G.C. Antioxidant Activity and Bioactive Compounds of Tea Seed (Camellia oleifera Abel.) Oil. J. Agric. Food Chem. 2006, 54, 779–784.
- Meng, X.H.; Li, N.; Zhu, H.T.; Wang, D.; Yang, C.R.; Zhang, Y.J. Plant Resources, Chemical Constituents, and Bioactivities of Tea Plants from the Genus Camellia Section Thea. J. Agric. Food Chem. 2019, 67, 5318–5349.
- Akihisa, T.; Tokuda, H.; Ukiya, M.; Suzuki, T.; Enjo, F.; Koike, K.; Nikaido, T.; Nishino, H. 3-Epicabraleahydroxylactone and other triterpenoids from Camellia oil and their inhibitory effects on epstein-barr virus activation. Chem. Pharm. Bull. 2004, 52, 153–156.
- Yuan, J.; Wang, C.; Chen, H.; Zhou, H.; Ye, J. Prediction of fatty acid composition in Camellia oleifera oil by near infrared transmittance spectroscopy (NITS). Food Chem. 2013, 138, 1657–1662.
- Kim, J.K.; Park, H.G.; Kim, C.R.; Lim, H.J.; Cho, K.M.; Choi, J.S.; Shin, D.H.; Shin, E.C. Quality evaluation on use of Camellia oil as an alternative method in dried seaweed preparation. Prev. Nutr. Food Sci. 2014, 19, 234.
- Zhang, L.L.; Wang, Y.M.; Wu, D.M.; Xu, M.; Chen, J.H. Comparisons of antioxidant activity and total phenolics of Camellia oleifera Abel fruit hull from different regions of China. J. Med. Plants Res. 2013, 4, 1407–1413.
- Huang, J.; Ahrends, A.; He, J.; Gui, H.; Xu, J.; Mortimer, P.E. An evaluation of the factors influencing seed oil production in Camellia reticulata L. plants. Ind. Crop. Prod. 2013, 50, 797–802.
- Amiri-Darban, N.; Nourmohammadi, G.; Rad, A.H.S.; Mirhadi, S.M.J.; Heravan, I.M. Potassium sulfate and ammonium sulfate affect quality and quantity of camelina oil grown with different irrigation regimes. Ind. Crop. Prod. 2020, 148, 112308.
- Kamal-Eldin, A.; Mäkinen, M.; Lampi, A.M. The Challenging Contribution of Hydroperoxides to the Lipid Oxidation Mechanism; Kamal-Eldin, A., Ed.; AOCS Press: Champaign, IL, USA, 2003; pp. 1–35.
- Feás, X.; Estevinho, L.M.; Salinero, C.; Vela, P.; Sainz, M.J.; Vázquez-Tato, M.P.; Seijas, J.A. Triacylglyceride, Antioxidant and Antimicrobial Features of Virgin Camellia oleifera, C. reticulata and C. sasanqua Oils. Molecules 2013, 18, 4573–4587.
- Su, M.H.; Shih, M.C.; Lin, K.H.H. Chemical composition of seed oils in native Taiwanese Camellia species. Food Chem. 2014, 156, 369–373.
- Dais, P.; Hatzakis, E. Quality assessment and authentication of virgin olive oil by NMR spectroscopy: A critical review. Anal. Chim. Acta 2013, 765, 1–27.
- Shi, T.; Wu, G.; Jin, Q.; Wang, X. Detection of Camellia oil adulteration using chemometrics based on fatty acids GC fingerprints and phytosterols GC–MS fingerprints. Food Chem. 2021, 352, 129422.
- Shi, T.; Wu, G.; Jin, Q.; Wang, X. Camellia oil authentication: A comparative analysis and recent analytical techniques developed for its assessment. A review. Trends Food Sci. Technol. 2020, 97, 88–99.
- Cheng, X.; Yang, T.; Wang, Y.; Zhou, B.; Yan, L.; Teng, L.; Wang, F.; Chen, L.; He, Y.; Guo, K. New method for effective identification of adulterated Camellia oil basing on Camellia oleifera-specific DNA. Arab. J. Chem. 2018, 11, 815–826.
- Chu, X.; Wang, W.; Li, C.; Zhao, X.; Jiang, H. Identifying Camellia oil adulteration with selected vegetable oils by characteristic near-infrared spectral regions. J. Innov. Opt. Health Sci. 2018, 11, 1850006.
- Aparicio, R.; Aparicio-Ruıíz, R. Authentication of vegetable oils by chromatographic techniques. J. Chromatogr. A 2000, 881, 93–104.
- Wang, X.; Zeng, Q.; Verardo, V.; Contreras, M.D.M. Fatty acid and sterol composition of tea seed oils: Their comparison by the “FancyTiles” approach. Food Chem. 2017, 233, 302–310.
- Li, X.; Kong, W.; Shi, W.; Shen, Q. A combination of chemometrics methods and GC-MS for the classification of edible vegetable oils. Chemom. Intell. Lab. Syst. 2016, 155, 145–150.
- Craske, J.D.; Bannon, C.D. Gas liquid chromatography analysis of the fatty acid composition of fats and oils: A total system for high accuracy. J. Am. Oil Chem. Soc. 1987, 64, 1413–1417.
- Christie, W.W. Methylation of fatty acids. Lipid Technol. 1990, 2, 48–49.
- Igarashi, T.; Aursand, M.; Hirata, Y.; Gribbestad, I.S.; Wada, S.; Nonaka, M. Nondestructive quantitative determination of docosahexaenoic acid and n-3 fatty acids in fish oils by high-resolution 1H nuclear magnetic resonance spectroscopy. J. Am. Oil Chem. Soc. 2000, 77, 737–748.
- McKenzie, J.S.; Donarski, J.A.; Wilson, J.C.; Charlton, A.J. Analysis of complex mixtures using high-resolution nuclear magnetic resonance spectroscopy and chemometrics. Prog. Nucl. Magn. Reson. Spectrosc. 2011, 59, 336–359.
- Kritioti, A.; Menexes, G.; Drouza, C. Chemometric characterization of virgin olive oils of the two major Cypriot cultivars based on their fatty acid composition. Food Res. Int. 2018, 103, 426–437.
- Popescu, R.; Costinel, D.; Dinca, O.R.; Marinescu, A.; Stefanescu, I.; Ionete, R.E. Discrimination of vegetable oils using NMR spectroscopy and chemometrics. Food Control. 2015, 48, 84–90.
- Zhang, L.; Wang, Y.; Wu, D.; Xu, M.; Chen, J. Microwave-assisted extraction of polyphenols from Camellia oleifera fruit hull. Molecules 2011, 16, 4428–4437.
- Shi, T.; Zhu, M.; Chen, Y.; Yan, X.; Chen, Q.; Wu, X.; Lin, J.; Xie, M. 1H NMR combined with chemometrics for the rapid detection of adulteration in Camellia oils. Food Chem. 2018, 242, 308–315.
- Zhu, M.T.; Shi, T.; Chen, Y.; Luo, S.H.; Leng, T.; Wang, Y.L.; Guo, C.; Xie, M.Y. Prediction of fatty acid composition in Camellia oil by 1H NMR combined with PLS regression. Food Chem. 2019, 279, 339–346.
- Robards, K.; Prenzler, P.; Ryan, D.; Zhong, H. Camellia oil and tea oil. In Gourmet and Health-Promoting Specialty Oils; Moreau, R.A., Kamal-Eldin, A., Eds.; AOCS Press: Urbana, IL, USA, 2009; pp. 313–343. ISBN 978-1-893997-97-4.
- Liang, H.; Hao, B.-Q.; Chen, G.-C.; Ye, H.; Ma, J. Camellia as an Oilseed Crop. HortScience 2017, 52, 488–497.
- Yang, C.; Liu, X.; Chen, Z.; Lin, Y.; Wang, S. Comparison of Oil Content and Fatty Acid Profile of Ten New Camellia oleifera Cultivars. J. Lipids 2016, 2016, 3982486.
- Yang, J.; Li, J.; Wang, M.; Zou, X.; Peng, B.; Yin, Y.; Deng, Z. A novel aqueous extraction for Camellia oil by emulsified oil: A frozen/thawed method. Eur. J. Lipid Sci. Technol. 2019, 121, 1800431.
- World Health Organization. Codex Alimentarius Commission Standard for Olive Oils, and Olive Pomace Oils, Codex Stan 33-1981 rev. 2015; Codex Alimentarius International Food Standards; World Health Organization: Geneva, Switzerland, 2015.
- Zeng, W.; Endo, Y. Lipid characteristics of Camellia seed oil. J. Oleo Sci. 2019, 68, 649–658.
- Ma, J.; Ye, H.; Rui, Y.; Chen, G.; Zhang, N. Fatty acid composition of Camellia oleifera oil. J. Für Verbrauch. Leb. 2011, 6, 9–12.
- Li, S.; Zhu, X.; Zhang, J.; Li, G.; Su, D.; Shan, Y. Authentication of Pure Camellia Oil by Using Near Infrared Spectroscopy and Pattern Recognition Techniques. J. Food Sci. 2012, 77, 7.
- Lee, C.-P.; Shih, P.-H.; Hsu, C.-L.; Yen, G.-C. Hepatoprotection of tea seed oil (Camellia oleifera Abel.) against CCl4-induced oxidative damage in rats. Food Chem. Toxicol. 2007, 45, 888–895.
- Oğraş, Ş.Ş.; Kaban, G.; Kaya, M. The effects of geographic region, cultivar and harvest year on fatty acid composition of olive oil. J. Oleo Sci. 2016, 65, 889–895.
- Xie, J.; Liu, T.; Yu, Y.; Song, G.; Hu, Y. Rapid Detection and Quantification by GC–MS of Camellia Seed Oil Adulterated with Soybean Oil. J. Am. Oil Chem. Soc. 2013, 90, 641–646.
- Dodds, E.D.; McCoy, M.R.; Rea, L.D.; Kennish, J.M. Gas chromatographic quantification of fatty acid methyl esters: Flame ionization detection vs. electron impact mass spectrometry. Lipids 2005, 40, 419–428.
- Aro, A.; Becker, W.; Pederssen, J.I. Trans fatty acids in the Nordic countries. Food Nutr. Res. 2006, 50, 151–154.
- Mannina, L.; D’Imperio, M.; Capitani, D.; Rezzi, S.; Guillou, C.; Mavromoustakos, T.; Vilchez, M.D.M.; Fernández, A.H.; Thomas, F.; Aparicio, R. 1H NMR-based protocol for the detection of adulterations of refined olive oil with refined hazelnut oil. J. Agric. Food Chem. 2009, 57, 11550–11556.
- Šmejkalová, D.; Piccolo, A. High-power gradient diffusion NMR spectroscopy for the rapid assessment of extra-virgin olive oil adulteration. Food Chem. 2010, 118, 153–158.
- Mannina, L.; Marini, F.; Gobbino, M.; Sobolev, A.P.; Capitani, D. NMR and chemometrics in tracing European olive oils: The case study of Ligurian samples. Talanta 2010, 80, 2141–2148.
- Agiomyrgianaki, A.; Petrakis, P.V.; Dais, P. Influence of harvest year, cultivar and geographical origin on Greek extra virgin olive oils composition: A study by NMR spectroscopy and biometric analysis. Food Chem. 2012, 135, 2561–2568.
- Cordella, C.B.Y.; Tekye, T.; Rutledge, D.N.; Leardi, R. A multiway chemometric and kinetic study for evaluating the thermal stability of edible oils by 1H NMR analysis: Comparison of methods. Talanta 2012, 88, 358–368.
- Alonso-Salces, R.M.; Holland, M.V.; Guillou, C. 1H-NMR fingerprinting to evaluate the stability of olive oil. Food Control. 2011, 22, 2041–2046.
- Zhu, M.T.; Shi, T.; Luo, X.; Tang, L.J.; Liao, H.X.; Chen, Y. Determination of the Oxidative Stability of Camellia Oils Using a Chemometrics Tool Based on 1H NMR Spectra and α-Tocopherol Content. Anal. Chem. 2020, 92, 932–939.
- Barison, A.; Da Silva, C.W.P.; Campos, F.R.; Simonelli, F.; Lenz, C.A.; Ferreira, A.G. A simplemethodology for the determination of fatty acid composition in edible oils through 1H-NMR spectroscopy. Magn. Reson. Chem. 2010, 48, 642–650.
- Sopelana, P.; Ibargoitia, M.L.; Guillén, M.D. Influence of fat and phytosterols concentration in margarines on their degradation at high temperature. A study by 1H Nuclear Magnetic Resonance. Food Chem. 2016, 197, 1256–1263.
- Guillén, M.D.; Ruiz, A. High resolution 1H nuclear magnetic resonance in the study of edible oils and fats. Trends Food Sci. Technol. 2001, 12, 328–338.
- Ruiz-Aracama, A.; Goicoechea, E.; Guillén, M.D. Direct study of minor extra-virgin olive oil components without any sample modification. 1H NMR multisupression experiment: A powerful tool. Food Chem. 2017, 228, 301–314.