Your browser does not fully support modern features. Please upgrade for a smoother experience.
Please note this is a comparison between Version 2 by Camila Xu and Version 3 by Camila Xu.
Isotopic Hydrograph Separation (IHS)S is a novel research field that has shown a great shift in separating runoff into pre-event and event water throughout its production lifetime.
- isotope hydrology
- text mining
- bibliometric indicator
- web of science
1. Introduction
In 1969, Hubert et al. [1] published their pioneering paper on hydrograph separation using stable isotope tracers. Since then, isotope hydrograph separation (IHS) has gradually become the principal method for determining the relative contributions of different sources of runoff or streamflow (i.e., event or pre-event water) [2][3][4][5][2,3,4,5]. Buttle [6] summarized the hydrological processes, including groundwater ridging, lateral throughflow, preferential flow, saturation overland flow, kinematic waves, and output from surface storage, which significantly improved the knowledge of the mechanisms of runoff generation. In 2013, Klaus and McDonnell [7] published a qualitative and comprehensive review of IHS and concluded that, despite certain limitations, water stable isotopes were still the most effective technology for understanding runoff generation processes and mechanisms. Moreover, several IHS reviews have focused on streamflow generation and associated processes and methods in special environmental settings, which has accelerated the accumulation of IHS studies [8][9][8,9]. Since 2013, there has been a rapid increase in scientific output in the field, which provides an unprecedented opportunity to explore the dynamics of IHS research based on data from a large body of published scientific work. However, to our knowledge, there has not been a quantitative assessment of the publication data in this field, and there are limited documents on text mining and relevant data science methods applied in hydrology research. Utilizing a quantitative and systemic method, we can analyze the characteristics and performances of documents to gain both macro- and micro-insights into the history and development of the field.
Similar to all scientific fields, the study of IHS has changed over time. Interests in certain themes have emerged and disappeared, and the breadth and depth of research content have expanded [10]. The most significant advances were made around the five well-known assumptions implicit in IHS models [9]. The five underlying assumptions are listed as follows: (1) significant isotopic differences occurred between the pre-event (old) and event (new) water; (2) the new water retains a constant isotopic signature in space and time, or any variations can be accounted for; (3) the isotopic signature of the old water is constant in space and time, or any variations can be accounted for; (4) contributions of water from the vadose zone must be negligible, or the isotopic content of soil water must be similar to that of groundwater; and (5) the contributions from surface storage to streamflow are negligible. Many IHS studies have concentrated on the validity and effects of these assumptions in recent decades [2][11][12][13][14][15][16][17][2,11,12,13,14,15,16,17]. Tracing IHS literature by quantitative approaches is interesting and vital for enhancing the understanding of runoff generation and relevant hydrological processes.
Text mining is the process of automatically extracting high-quality information from unstructured or structured texts with diverse formats and types using linguistic and statistical techniques [18][19][18,19]. Thematic analysis is an important subject of textual data mining. Studies have found that temporal changes in themes, usually represented by keywords for a given research domain, can help to uncover the evolution of a topic and its trend [20][21][22][20,21,22]. For example, Yao et al. [23] analyzed the frequency changes in author keywords related to nitrogen in eutrophic lakes or reservoirs at five-year intervals and successfully determined the current and future trends in nitrogen field research. Chen et al. [24] analyzed research trends in management science and engineering in China based on co-keyword analysis and concluded that the foci were game theory, supply chain management, complex networks, data mining, optimization, risk management, and data envelopment analysis. In addition, theme variations based on keyword analysis can also help new researchers to situate themselves and their topics within the field and within changing research interests. Similarly, a systemic analysis of the thematic changes in IHS research is indispensable to understanding how this field evolved over time and predicting future research trends.
Bibliometric analysis is a popular, powerful, and systematic way to analyze the performance of scientific production using mathematical and statistical methods [25][26][25,26]. The results of bibliometric analyses can provide objective views of scientific productions in a given research field and provide effective support for the subjective perceptions of researchers. Many research fields have applied this methodology to assess and predict scientific productivity, development, and future trends [27][28][27,28]. Padilla et al. [29], for example, conducted a bibliometric analysis of global nitrate leaching publications and found an overriding interest in recent decades on the theme of soil nitrogen loss in agroecosystems. Moreover, many different bibliometric indicators can be used to evaluate the literature characteristics as well as thematic influences, such as the number of documents, number of citations, and rank [30]. A quantitative analysis of bibliometric indicators can reveal the most cited papers, hot issues, and other valuable information in a given research field, which can help scientists to quickly develop an understanding of the research situation in their field [31][32][31,32]. Therefore, an analysis of the performance of themes with bibliometric indicators is of vital importance in understanding the global state of IHS.
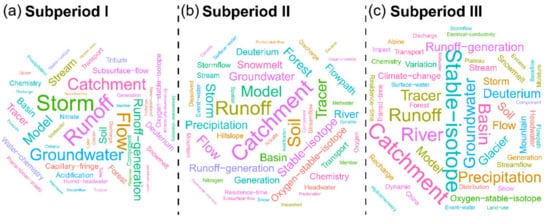
Two papers published before 1991 were excluded from the textual analysis because there were no keywords in these documents. Table 34 presents the number of publications and keywords per period. The number of keywords used per year was 17.6, 42.1, and 125.8 in subperiods I, II, and III, respectively, showing a noticeable expansion in research topics over time. There were 158 keywords in all of subperiod I, including ‘runoff’ (19), ‘storm’ (19), ‘groundwater’ (17), ‘catchment’ (16), and ‘flow’ (14), located in the center of the word cloud of subperiod I (Figure 23a). There was a significant increase to 632 keywords in subperiod II. ‘Catchment’ (99) rose in rank from the fourth to first position (in the center of the word cloud of subperiod II), and ‘soil’ rose from the thirteenth (6) to third position (51), which was close to the ‘catchment’ (Figure 23b). There were 629 keywords in subperiod III, including ‘stable-isotope’ (99), ‘catchment’ (90), ‘groundwater’ (61), ‘runoff’ (60), ‘precipitation’ (59), ‘river’ (55), and ‘basin’ (51) (in the center of the word cloud of subperiod III (Figure 23c)). Some keywords, such as ‘variation’ and ‘spatial’, merely appeared in subperiods II and III, and the sum frequency of the two terms increased from subperiod II to subperiod III.
2. Publication and Keyword Performance
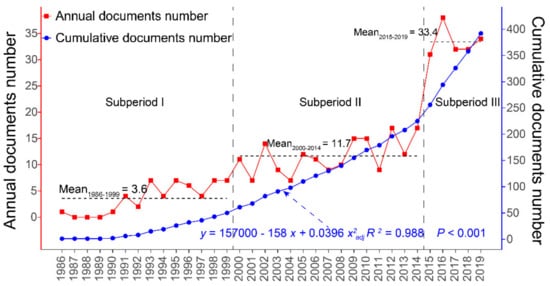
The primary information and statistics regarding the analyzed IHS collection are reported in Table 12. The 392 IHS documents published in 87 sources were written by 1138 authors from 453 institutions in 53 countries. The numbers of TC and average citations per document were 12,413 and 31.67, respectively. The annual growth rate was, on average, 11.3%. Figure 12 shows the yearly output of IHS documents published from 1986 to 2019. The output presented obvious periodical characteristics in terms of the mean value of yearly publications. The whole period could be divided into three subperiod based on the significant changes in average publication output. Before 2000 (subperiod I), the literature output grew slowly, with only 50 documents in 13 years and an average annual output of only 3.6. From 2000 to 2014 (subperiod II), the annual volume of documents increased, with an average production of 11.7 documents per year. The most influential literatures were published in subperiods I and II (Table 23). During 2015 and 2019 (subperiod III), there was a significant upward trend in the number of cumulative publications, increasing from 225 in 2014 to 392 in 2019. The mean output of 33.4 in this subperiod was much higher than that in the other two subperiods. No important literature was published in subperiod III, but this may be due to delayed citing. The number of cumulative documents grew from 1986, following a quadratic function in the form of y = 157,000 − 158x + 0.04x2 (adjusted R2 = 0.988, p < 0.001), indicating that there is a generally increasing trend in IHS publications.Figure 12. The publication output of IHS between 1986 and 2019. The transverse dashed lines present the mean values of the number of documents per year in each subperiod.
Table 12. Principal information about the 1986–2019 IHS collection.
| Description | Results | |||||
|---|---|---|---|---|---|---|
| LCS Per Year | GCS Per Year | |||||
| Total documents | 392 | |||||
| Timespan | 1986:2019 | |||||
| Buttle JM, 1994, Prog Phys Geog (IF: 3.580) [6] | 10.1177/030913339401800102 | 118 | 297 | 4.4 | 11.0 | |
| Klaus J, 2013, J Hydrol (IF: 5.722) [7] | 10.1016/j.jhydrol.2013.09.006 | 92 | 221 | 11.5 | 27.6 | |
| Annual growth rate | 11.28% | |||||
| Hooper RP, 1986, Water Resour Res (IF: 5.240) [33][45] | 10.1029/WR022i010p01444 | 88 | 252 | 2.5 | Total citations (TC) | 12,413 |
| Average citations per document | 31.67 | |||||
| Sources | 87 | |||||
| Authors | 1138 | |||||
| Institutions | 453 | |||||
| Countries | 53 |
Table 23. Twenty most influential papers based on LCS.
| Paper | Digital Object Identifier (DOI) | LCS | GCS | ||
|---|---|---|---|---|---|
| 7.2 | |||||
| Wels C, 1991, J Hydrol [34][46] | 10.1016/0022-1694(91)90181-G | 60 | 139 | 2.0 | 4.6 |
| Laudon H, 2002, Water Resour Res [35][47] | 10.1029/2002WR001510 | 51 | 80 | 2.7 | 4.2 |
| Brown VA, 1999, J Hydrol [3] | 10.1016/S0022-1694(98)00247-9 | 46 | 187 | 2.1 | 8.5 |
| Taylor S, 2001, Water Resour Res [13] | 10.1029/2000WR900341 | 44 | 129 | 2.2 | 6.5 |
| Ogunkoya OO, 1993, J Hydrol [36][48] | 10.1016/0022-1694(93)90005-T | 43 | 93 | 1.5 | 3.3 |
| Kong YL, 2012, J Hydrol [37][49] | 10.1016/j.jhydrol.2012.02.029 | 41 | 78 | 4.6 | 8.7 |
| Hinton MJ, 1994, Water Resour Res [38][50] | 10.1029/93WR03246 | 39 | 110 | 1.4 | 4.1 |
| Laudon H, 1997, J Hydrol [39][51] | 10.1016/S0022-1694(97)00030-9 | 38 | 85 | 1.6 | 3.5 |
| Ladouche B, 2001, J Hydrol [40][52] | 10.1016/S0022-1694(00)00391-7 | 38 | 136 | 1.9 | 6.8 |
| Taylor S, 2002, Hydrol Process (IF: 3.565) [41][53] | 10.1002/hyp.1232 | 38 | 69 | 2.0 | 3.6 |
| Shanley JB, 2002, Hydrol Process [42][54] | 10.1002/hyp.312 | 35 | 94 | 1.8 | 4.9 |
| Lyon SW, 2009, Hydrol Process [43][55] | 10.1002/hyp.7326 | 35 | 56 | 2.9 | 4.7 |
| Liu YH, 2008, J Hydrol [44][56] | 10.1016/j.jhydrol.2008.02.017 | 33 | 62 | 2.5 | 4.8 |
| Mcdonnell JJ, 1991, Water Resour Res [4] | 10.1029/91WR02025 | 31 | 126 | 1.0 | 4.2 |
| Bazemore DE, 1994, J Hydrol [45][57] | 10.1016/0022-1694(94)90004-3 | 31 | 137 | 1.1 | 5.1 |
| Unnikrishna PV, 2002, J Hydrol [46][58] | 10.1016/S0022-1694(01)00596-0 | 28 | 66 | 1.5 | 3.5 |
| Weiler M, 2003, Water Resour Res [47][59] | 10.1029/2003WR002331 | 28 | 146 | 1.6 | 8.1 |
IF: Impact Factor of 2020 Journal Citation Reports.
Figure 23. Word cloud of the most widely used IHS keywords in each subperiod. The size is proportional to the frequency of each keyword. The larger the word size is, the more important it is. For highlighting the important keywords, the keywords with high frequencies and large sizes locate in the center of the word could. (a) Subperiod I, (b) Subperiod II, (c) Subperiod III.
Table 34. Principal information in each subperiod.
| Subperiod | Publication | Percentage of Total Publications (%) | Keywords | Percentage of Total Keywords (%) | Keywords Per Year |
|---|---|---|---|---|---|
| 1991–1999 | 44 | 11.5 | 158 | 11.1 | 17.6 |
| 2000–2014 | 173 | 45.1 | 632 | 44.5 | 42.1 |
| 2015–2019 | 167 | 43.5 | 629 | 44.3 | 125.8 |