Maltol, 3-hydroxy-2-methyl-4-pyrone (Figure 1A), a naturally occurring compound, can be isolated from various types of plants, such as bark and leaves of Larix deciduas, Evodiopanax innovans, Cercidiphyllum japonicum, Citharexylum spinosum, Passiflora incarnata, Panax ginseng, and different kinds of pine plants [1,2,3,4].
1. Introduction
Maltol, mostly used as a flavoring molecule, also has various potential applications as a biomedical compound. Despite its extensive use in the food industry, maltol’s antimicrobial activity was evaluated only briefly, and was suggested to be insufficient on its own. Recently, we have shown that maltol can be used in conjunction with cationic surfactant species to receive higher activity against contaminant microorganisms[1][2][3][4]. In this paper, we have broadened the antimicrobial efficacy studies and evidenced maltol’s mode of action against Gram-negative, Gram-positive bacteria, and fungi. In addition, to increase its efficacy, blends of maltol and two selected cationic surfactants, dodecyl-dimethyl-ammonium chloride (DDAC) and polyquaternium 80 (P-80), were appraised for their activity. Broad efficacy studies revealed synergistic interactions between maltol and both cationic surfactants against most of the tested microorganisms. Electron microscopy images were used to evaluate the microorganisms’ morphology following treatment, pinpointing the specific cell wall damage caused by each of the compounds. Our findings indicate that maltol’s effect on the microbial cell wall can be complemented by catalytic amounts of selected cationic surfactants to enhance and extend its activity. Such a solution can be used as a broad-spectrum preservative for personal care products in cosmetic applications.
Few studies demonstrated that maltol can also be produced by some actinobacteria [5][6] and a mold species [7]. Maltol is a chelating agent, which binds hard metal centers, such as Fe3+ (Ferric maltol; Figure 1B), Ga3+, Al3+, and VO2+. Due to its solubility in aqueous solution, maltol was shown to increase the absorption of several essential metals in animal and human subjects, in comparison to hydrophobic chelating molecules[8][9][10][11][12] . Maltol is widely used in the food industry as a flavoring agent, food additive, and a food preservative. Maltol, known for its characteristic sweet smell, is used to create a sweet aroma in fragrances, freshly baked bread, and cakes. In addition to its extensive use in the food industry, maltol was found to have broad applications, such as a biomedical compound [1][13][14][15][16] and even used as a pest control agent [17]. Maltol is a promising candidate molecule for medical purposes and an important compound in the food industry; moreover, toxicity studies have determined that maltol is non-toxic and generally recognized as safe (GRAS) [7][18].
The antimicrobial activity of maltol, on the other hand, was only briefly investigated in several previous studies [19][20], while its efficacy was suggested mostly as insufficient on its own [21][22]. Recent study discovered that maltol efficacy can be significantly increased by the addition of only small amounts of selected cationic surfactants . In this study, the efficacy studies were widened to better understand the mode of action of maltol and its combination with two cationic surfactants, polyquaternium 80 (P-80), and didecyldimethylammonium chloride (DDAC). For this purpose, the antimicrobial mechanism of maltol and its cationic surfactant combinations were evaluated against the five pharmacopeia microorganisms, Escherichia coli, Staphylococcus aureus, Pseudomonas aeruginosa, Candida albicans, and Aspergillus brasiliensis, using multiple efficacy studies, morphological examination via electron microscopy imaging, and cell permeability assay.
2. Results
2.1. MIC and Checkerboard Assays
To evaluate the effect of maltol combined with either the cationic surfactants, checkerboard assays were performed (
Figure 2 and
Figure 3, and
Figure S1), and FICI values were calculated (
Table 1). MIC
100 values of maltol ranged between 1000 and 4000 ppm, P-80 with 4–1000 ppm, and DDAC with 0.5–6.25 ppm. FICI values were calculated as (MIC
A combined/MIC
A alone) + (MIC
B combined/MIC
B alone), while synergy was defined as FICI ≤ 0.5, and an additive effect was defined as 0.5 < FICI < 0.1
[1]. In all microorganisms, synergistic effect with either one or two of the cationic surfactant blends was observed, except for Gram-positive
S. aureus, which showed only additive antimicrobial effects of the compounds (
Figure 2 and
Figure 3 and
Table 1). In
P. aeruginosa, only the maltol blend with P-80 had a synergistic effect indicated by FICI value of 0.31, while in
E. coli,
C. albicans, and
A. brasiliensis, the synergistic effect was observed in both blends (
Figure 2 and
Figure 3 and
Table 1).
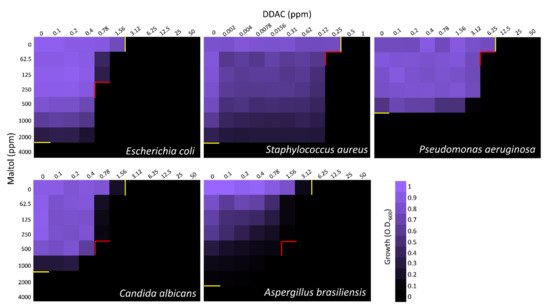
Figure 2. Checkerboard assay of maltol and DDAC against E. coli, S. aureus, P. aeruginosa, C. albicans, and A. brasiliensis. Growth measured after 24 h by O.D.600. On the X-axis, DDAC was diluted in a two-fold series dilution in concentrations range of 0.1–50 ppm. On the Y-axis, maltol was diluted in a two-fold series dilution in a concentration range of 62.5–4000 ppm. Yellow lines indicate MIC100 values of individual compound alone. Red lines indicate the optimal concentrations of the combined compounds. Final values are represented as the average relative growth in each well compared to the blank, based on three independent experiments.
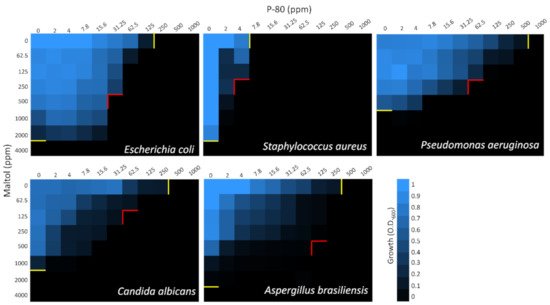
Figure 3. Checkerboard assay of maltol and P-80 against E. coli, S. aureus, P. aeruginosa, C. albicans, and A. brasiliensis. Growth measured after 24 h by O.D.600. On the X-axis, P-80 was diluted in a two-fold series dilution in a concentration range of 2–1000 ppm. On the Y-axis, maltol was diluted in a two-fold series dilution in concentrations range of 62.5–4000 ppm. Yellow lines indicate MIC100 values of individual compound alone. Red lines indicate the optimal concentrations of the combined compounds. Final values are represented as the average relative growth in each well compared to blank, based on three independent experiments.
Table 1. MIC100 values of the individual compounds maltol, DDAC, and P-80, and the combined blends of maltol with either cationic surfactant against E. coli, S. aureus, P. aeruginosa, C. albicans, and A. brasiliensis. MIC values were adopted from checkerboard assays (see Figure 2 and Figure 3) for FICI calculation.
| |
Separate MIC100 (ppm) |
Combined MIC100 (ppm) |
Combined MIC100 (ppm) |
| Maltol |
DDAC |
P80 |
Maltol |
DDAC |
Maltol |
P80 |
| E. coli |
4000 |
3.12 |
250 |
250 |
0.78 |
500 |
31.25 |
| FICI = 0.31 |
FICI = 0.25 |
| S. aureus |
4000 |
0.5 |
7.8 |
62.5 |
0.25 |
250 |
4 |
| FICI = 0.52 |
FICI = 0.58 |
| P. aeruginosa |
1000 |
12.5 |
1000 |
62.5 |
6.25 |
250 |
62.5 |
| FICI = 0.56 |
FICI = 0.31 |
| C. albicans |
2000 |
3.12 |
500 |
500 |
0.78 |
125 |
62.5 |
| FICI = 0.5 |
FICI = 0.19 |
| A. brasiliensis |
4000 |
6.25 |
500 |
500 |
1.56 |
500 |
125 |
| FICI = 0.38 |
FICI = 0.38 |
2.2. Potassium Leakage
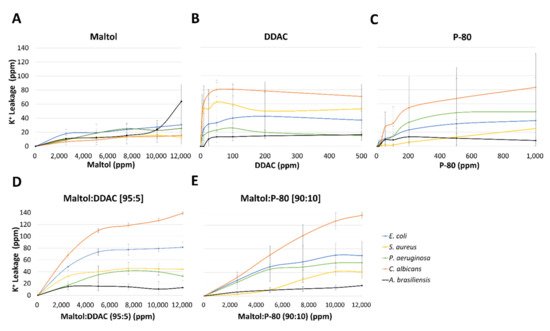
Potassium leakage (ppm) was monitored from the five tested microorganisms, in response to increasing concentrations of maltol, DDAC, P-80, and blends of maltol and DDAC (95:5), and maltol and P-80 (90:10). Maltol caused the lowest effect in all microorganisms in comparison to any other treatment (Figure 4A), with the highest amount of K+ leakage of 64 ppm detected in A. brasiliensis, followed by 30.5 ppm in E. coli, and 25 ppm in P. aeruginosa. Gram-positive S. aureus and C. albicans were affected the least by maltol treatment with 13–16.5 ppm of potassium leakage. Cationic surfactants treatment of DDAC and P-80 caused higher K+ leakage reaching up to 80 ppm in C. albicans (Figure 4B,C). DDAC treatment was the most effective in lower concentrations up to 50 ppm, with a plateauing response afterwards. C. albicans and S. aureus were the most affected by DDAC treatment, followed by an intermediate response of E. coli, while P. aeruginosa and A. brasiliensis were the least affected (Figure 4B). In P-80 treatment, C. albicans was the most affected, followed by P. aeruginosa, E. coli, S. aureus, with the lowest effect observed in A. brasiliensis (Figure 4C). P-80 treatment caused a gradual increase in K+ leakage up to the final tested concentration of 1000 ppm (Figure 4C).
Figure 4. Potassium leakage from the five pharmacopeia microorganisms, E. coli, S. aureus, P. aeruginosa, C. albicans, and A. brasiliensis, in response to increasing concentrations of the tested compounds; (A) maltol, (B) DDAC, (C) P-80, (D) maltol and DDAC (95:5), and (E) maltol and P-80 (90:10). Results are presented as ppm of potassium (K+) cations measured using emission flame photometry. Data are based on three independent experiments and represented as the average potassium leakage (ppm) ± SD.
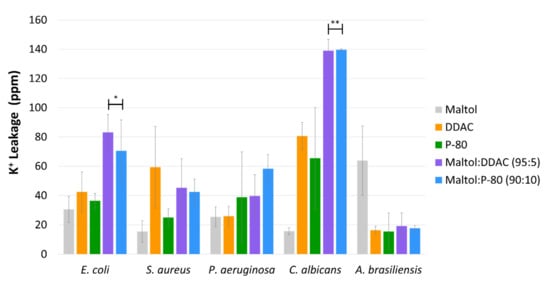
Compared with the individual maltol treatment alone, the blend of maltol with either the cationic surfactants, DDAC or P-80, induced a significantly higher potassium leakage; E. coli with p value < 0.005 for DDAC blend and p value < 0.1 for P-80 blend, C. albicans with p value < 0.001 for both blends, and S. aureus with p value < 0.1 for DDAC blend (Figure 5). In C. albicans for example, potassium leakage caused by maltol and cationic surfactants blends reached 137–139 ppm, while the individual compound treatments reached 78–83 ppm for the cationic surfactants and 15 ppm for maltol. E. coli reached 71–83 ppm of potassium leakage caused by the maltol blends treatments, in comparison to only 30–42 ppm in the individual compound treatments alone (Figure 5).
Figure 5. The average potassium leakage from the five pharmacopeia microorganisms, E. coli, S. aureus, P. aeruginosa, C. albicans, and A. brasiliensis, in response to maltol, DDAC, P-80, maltol:DDAC blend (95:5), and maltol:P-80 blend (90:10), by using a single chosen concentration, which elicited the highest response. Results are presented as ppm of potassium cations measured using emission flame photometry. Data are based on three independent experiments and represented as the average potassium leakage (ppm) ± SD. Significant differences are indicated as; * (p < 0.05) and ** (p < 0.01), using Holm–Sidak.
2.3. Transmission Electron Microscopy (TEM)
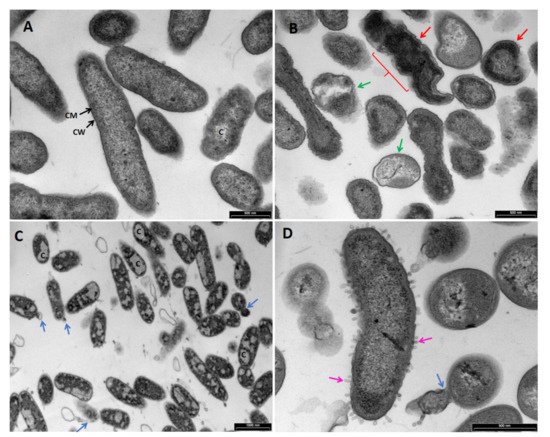
TEM images of P. aeruginosa (Figure 6 and Figure 7), S. aureus (Figure 8), C. albicans (Figure 9), and A. brasiliensis (Figure 10) were taken, following treatment with maltol, DDAC, and a blend of maltol and DDAC combined (95:5). All treatments induced morphological changes to the tested microorganisms. In P. aeruginosa treated with maltol at 4500 ppm (Figure 6B), over-folding of the membrane (red line) and loss of rod shape, replaced by irregular structures (red arrows) were observed, in comparison to the no-treatment control (Figure 6A). Some of the cells seemed more condensed, while others appeared as they lost their intracellular material (green arrows). In some cases, thickening and detachment of the outer cell wall from the inner cell membrane was detected. DDAC treatment (Figure 6C and Figure 7B) caused severe leakage of intracellular material, observed by islands of cytoplasm (C), with many of the cells observed having a membrane bound segments extending from the cell membrane (blue arrows). Treatment with the maltol and DDAC blend (Figure 6D and Figure 7C), caused bleb-like vesicles burgeoning from the bacterial surface (pink arrows), while the segments extending from the cell wall observed in the DDAC treatment were present in the blend treatment as well (blue arrows).
Figure 6. TEM images of Pseudomonas aeruginosa treated with (A) H2O, no-treatment control, (B) maltol at 4500 ppm, (C) DDAC at 500 ppm, (D) blend of maltol and DDAC (95:5) at 5000 ppm. Green arrows: loss of intracellular material. Red line and arrows: over-folding of the membrane and loss of rod shape, replaced by irregular structure. Blue arrows: membrane bound segments extending from the cell membrane. Pink arrows: bleb-like vesicles burgeoning from the bacterial surface. Abbreviations: C: cytoplasm, CM: cell membrane, CW: cell wall.
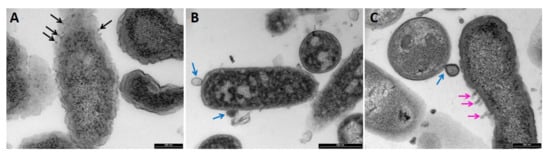
Figure 7. TEM images of Pseudomonas aeruginosa cells treated with (A) maltol at 4500 ppm, (B) DDAC at 500 ppm, and (C) blend of maltol and DDAC (95:5) at 5000 ppm. Black arrows: electron-condensed bodies aggregating near cell surface. Blue arrows: membrane bound segments extending from the cell membrane. Pink arrows: bleb-like vesicles burgeoning from the bacterial surface.
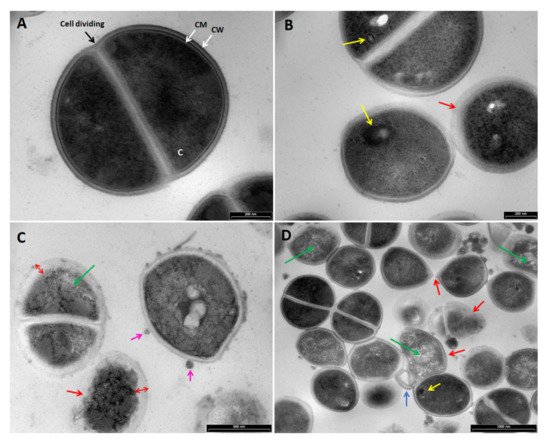
Figure 8. TEM images of Staphylococcus aureus treated with (A) H20, no treatment control, (B) maltol at 4500 ppm, (C) DDAC at 500 ppm, (D) blend of maltol and DDAC (95:5) at 5000 ppm. Green arrows: loss of intracellular material. Red line and arrows: over-folding of the membrane and loss of rod shape, replaced by irregular structure. Blue arrows: intracellular material leakage observed as a membrane bound segments extending from the cell membrane. Pink arrows: bleb-like vesicles burgeoning from the bacterial surface. Yellow arrows: mesosome-like structures. Abbreviations: C: cytoplasm, CM: cell membrane, CW: cell wall.
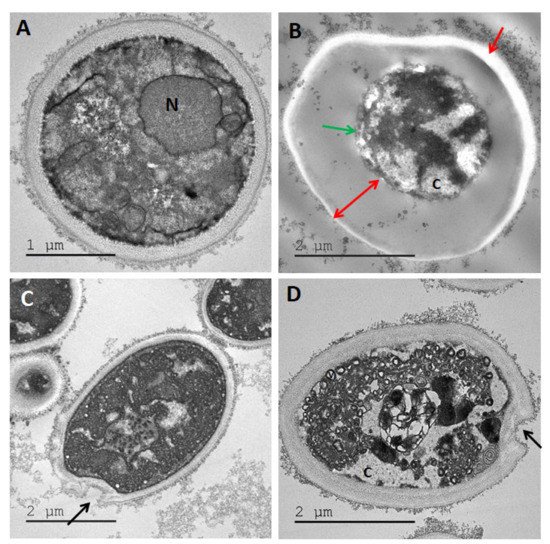
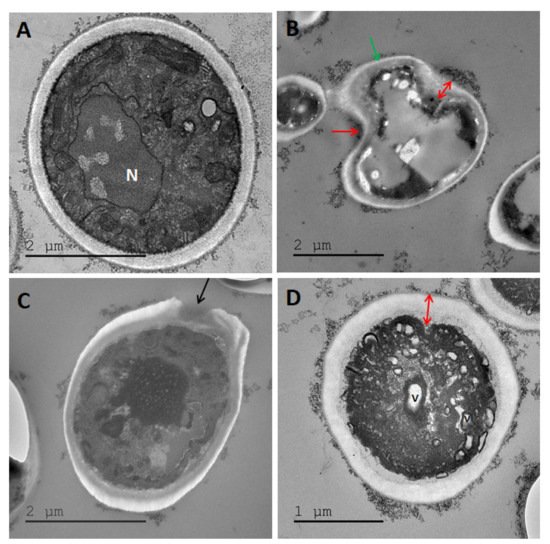
Figure 9. TEM images of Candida albicans treated with (A) H20, no treatment control, (B) maltol at 4500 ppm, (C) DDAC at 500 ppm, (D) blend of maltol and DDAC (95:5) at 5000 ppm. Red arrows: alteration of the cell wall structure, receding of cell membrane and thickening of cell wall. Green arrow: lysis of intracellular material. Black arrows: holes in the cell membrane. Abbreviations: C: cytoplasm, N: nucleus.
Figure 10. TEM images of Aspergillus brasiliensis treated with (A) H20, no treatment control. (B) Maltol at 4500 ppm, (C) DDAC at 500 ppm, (D) blend of maltol and DDAC (95:5) at 5000 ppm. Red arrows: alteration of the cell wall structure, receding of cell membrane and thickening of cell wall. Green arrow: lysis of intracellular material. Black arrow: holes in the cell membrane. N: nucleus, V: vacuoles.
In S. aureus, the maltol treatment induced an appearance of mesosome-like structures (Figure 8B; yellow arrows), non-membrane enclosed bodies (not shown) and irregular cell division (not shown). In addition, in some cases, cell wall appeared blurry as it was losing its integrity (red arrow). The DDAC treatment (Figure 8C) caused an intracellular material leakage appearing as bleb-like vesicles burgeoning from the bacterial surface (pink arrows), loss of intracellular material (green arrows), widening, and detachment of the cell membrane from the cell wall, while cell wall appears blurry (red arrows). The maltol and DDAC blend treatment (Figure 8D) included both individual compounds effects, mesosome like structures, irregular cell division and intracellular material leakage. In addition, increased effect of cocci shape loss was observed (red arrows).
The maltol treatment in C. albicans and A. brasiliensis (Figure 9B and Figure 10B) caused a severe alteration of the cell wall structure, which appeared distant from the intracellular material with receding cell membrane (red arrows), lysis of the cell organelles and intracellular material (green arrow). The DDAC treatment in both yeast and mold species (Figure 9C and Figure 10C) caused cell wall damage observed as holes in the membrane (black arrows). The cell wall seemed to keep its original rounded shape, while the intracellular material appeared intact. The maltol and DDAC blend (95:5) (Figure 9D and Figure 10D) caused vacuoles formation (V) and the appearance of empty islands of cytoplasm (C), specifically in C. albicans (Figure 9D). In addition, cell wall thickening was observed with slight changes in the characteristic rounded cell shape.
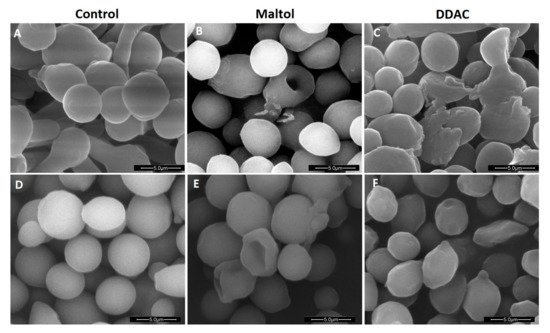
SEM images of C. albicans and A. brasiliensis (Figure 11) supported that the maltol treatment caused a sever alteration of the intracellular material of the cells, observed by hollowed structures of cells, which remained empty (Figure 11B,E). As opposed to maltol, the DDAC treatment appeared to only damage the outer cell wall in A. brasiliensis (Figure 11F), while C. albicans cells appeared severely damaged with a loss of structure (Figure 11C).
Figure 11. Scanning electron microscopy (SEM) images of Candida albicans treated with (A) H20, no-treatment control, (B) maltol at 10,000 ppm, (C) DDAC at 1000 ppm; and Aspergillus brasiliensis treated with (D) H20, no-treatment control, (E) maltol at 10,000 ppm, and (F) DDAC at 500 ppm.
53. Conclusions
In this study, the antimicrobial efficacy of maltol, and its combined effect with two cationic surfactants are investigated. Maltol has a synergistic effect when combined with DDAC or P-80, while the morphological examination allowed us to quantify and attribute this synergistic effect to the cell wall damage observed in TEM images of the microorganisms. The resultant enhanced efficacy of maltol along with the minimal concentration of cationic surfactant can be applied as a preservative solution in order to reduce or eliminate the presence of synthetic compounds within the cosmetic application. Finally, only a catalytic amount of cationic surfactant along with maltol, enabling gentle and friendly formulation are used to the skin, which resulted in high efficacy performance.