1. Introduction
Wild boar
Sus scrofa L. hunting bags are at a very high level in Germany and all over Europe
[1,2][1][2]; populations are still increasing and dispersing into agrarian landscapes. Thus, high densities and dispersal into new areas are accompanied by economic problems such as crop damages and disease transmission to livestock, threats to nature conservancy as well as threats to human wellbeing, e.g., by car accidents
[3,4,5,6,7,8][3][4][5][6][7][8]. Due to factors such as insufficient hunting, as well as underestimation of population densities and reproductive rates
[9], harvest rates seem to be insufficient in many parts of the wild boar range
[1]. Sound hunting management is crucial in order to regulate or even reduce wild boar populations
[1,10,11,12][1][10][11][12]. However, it seems hunting alone is not able to regulate wild boar populations sufficiently
[1,2,12,13][1][2][12][13]. In that context, it seems necessary to have only a few unmanaged areas (compare
[14]).
Throughout the past five decades, wild boar research in Europe
[15,16,17,18][15][16][17][18] has lacked attention to certain biological aspects
[18], e.g., habitat use
[19], dispersal mechanisms
[20[20][21],
21], group structure and social hierarchy
[22], which require examination. In addition, the human factors directly or indirectly influencing wildlife—the so-called “human dimension”—is a relatively new topic in Europe, especially in Germany
[6,23,24[6][23][24][25][26][27],
25,26,27], and necessitates further investigation
[6,12,23,24,25,28,29,30][6][12][23][24][25][28][29][30].
It is generally assumed that biased sex and age ratios, in addition to high hunting pressure (e.g.,
[31,32][31][32]), result in increased reproduction, although food availability and nutritional content were demonstrated as the main cause for higher reproduction
[9,33,34][9][33][34]. Some authors described different models to accomplish regulation of wild boar populations by hunting different proportions of age classes
[21,35,36,37,38][21][35][36][37][38]. Although information on wild boar or feral pig management does exist, it comes mainly from Australia and the USA
[39[39][40][41][42],
40,41,42], only sketchy from Europe
[43,44,45,46,47,48][43][44][45][46][47][48]. The scientific literature on hunting practices in Europe is vague in general
[49] with some on single hunts
[50], a bit on drive hunts that focusses mainly on a biological view (activities, behavioural changes;
[51,52,53,54,55,56][51][52][53][54][55][56]), and fewer on efficiency
[2,51,57,58,59][2][51][57][58][59] or effort
[60,61][60][61]. Additionally, in other regions, the literature on hunting techniques and efficiency is sparse
[62,63,64,65][62][63][64][65].
In order to counteract economic problems such as damage to crops, disease outbreaks, and traffic accidents, the regulation of the wild boar population must change. For sufficient population regulation, and especially for the population reduction necessary to halt infection chains and reduce crop damages
[1,66][1][66], the concept of “hunting management” should be expanded into a comprehensive “wildlife management” concept. This new form of management would oversee everything from private and recreational hunting, along with other anthropogenic influences on wildlife
[2[2][12],
12], to nature conservation. Once this is accomplished, it may be expected that regulation of the population of wild boar may be possible, as long as both public awareness and impact are substantial enough
[67], and additional management measures might be accomplished by professionals. Some significant requirements are necessary for the success of management programs
[12,24][12][24]:
-
Evaluating the opinion and attitudes of stakeholders, hunters, and the general public;
-
Incorporating scientific background, social needs, and social attitude;
-
Monitoring the success of management measures.
Of course, involved people will have to agree with the management plans.
In order to regulate the hunting of wild boar, it is essential to research the animal’s biology (especially behavioural and ecological flexibility;
[68]), hunting methods, and the attitudes and availabilities of hunters. One of the most significant and disturbing factors affecting the success of wildlife management is the management itself: wildlife managers, and especially the hunters, have a big impact on the performance of population regulation
[1,2,12,27,69,70,71][1][2][12][27][69][70][71]. For example, is the number of hunters linked to the hunting bags of wild boar
[2]? Also, it is important to determine a status quo in order to develop management, i.e., how is management (by private hunting) actually conducted?
Hunting bag data is influenced by several factors including weather conditions, nutrition, hunting methods, population densities and visibilities, and only reflect approximate/trend-based population data. Due to several EU conventions and German laws, reliable population data is needed
[72,73][72][73]. Thus, wildlife monitoring systems, specifically for game species, were installed in Germany and its federal states in the last three decades
[72,74][72][74]. In the Federal State of Lower Saxony monitoring systems that track distribution, detailed hunting statistics, as well as the spectrum of opinion of the hunters’, work on a volunteer questionnaire basis and can be used for human dimension surveys. Besides inquiries on hunters’ opinion, knowledge, abilities and willingness, we also conducted a survey on hunting itself. This knowledge should be used when considering management concepts and subsequent decisions, or even in making recommendations to hunters on how they could improve hunting efficiency. We aimed to know: How do hunters hunt? Are hunters willing (compare
[27]) and able to regulate a population sufficiently? What other management tools can be used and accepted by hunters? Therefore, we asked the owners of hunting grounds how hunting was conducted throughout the last two decades with a specific view on differences between regions and trends in hunting techniques.
2. Analysis on Results
Most questions were answered with the usual response rate of 85–90% (from 7285–8059 participating hunting grounds in 2002–2020—representing hunting years 2001/02–2019/20). Only some specific questions on hunting methods and the objectives leading to this were only answered by fewer hunters, mainly depending on the occurrence of wild boar more or less regularly [compare
[26[26]]
]. In addition, we think some of these questions had imprecise wording or were too private/too blunt. To avoid giving the wrong impressions, we chose not to analyse this data further.
2.1. Hunting Methods + Hunting Bags
How Many Wild Boar Were Shot in Your Own Hunting Ground during the Last Season with Which Hunting Method?
Predetermined answers: single hunt, drive hunt within own hunting ground, conjoint drive hunt—meaning hunts on several neighbouring hunting grounds at the same time (see
Figure 2, more specified in the years 2010 and 2011 see
Figure 3). For an explanation of hunting methods see
Supplementary Materials Table S3.
Figure 1. Wild boar hunting indices (HI = shot wild boar/km2 of hunting ground, hunting season 2014/15, official hunting statistics) for every administrative district in the Federal State of Lower Saxony, Germany, indicating wild boar abundances. Additionally shown the main geographic regions (broad black lines) N = North, S = South, E = East, W = West, HI = hunting index = shot wild boar/km2, NL = The Netherlands. Figure adapted from Keuling et al., 2016.
Figure 2. Development of proportions of the hunting methods single and drive hunt (shot animals as % of total hunting bag per hunting method) as a mean for Lower Saxony from 2001–2019 (2001 means hunting year 2001/02: 1 April–31 March). N = min 7286, max 8255, database: WTE 2002–2020. Bait was only surveyed in the shown years. Data only from WTE, as not available from official hunting bag data. Compare also Figure 3.
Figure 3. Percentages within hunting bag, wild boar shot with different hunting methods/strategies (predetermined answers). large graph: proportions total in Lower Saxony within the years 2009/10 (lower bar, N = 8106) and 2010/11 (upper bar, hatched colour, N = 8023), database: WTE 2010 + 2011; small graph: proportions in low (west = W, districts’ hunting index HI < 1 shot/km2) and high (east = E, HI > 1) density regions (2009/10), database: WTE 2010.
Hunting at bait was the most common hunting method in Lower Saxony in the years 2009/10 and 2010/11 (
Figure 3) with a recently decreasing proportion (compare
Table 1,
Figure 2). The proportions of hunting methods within hunting statistics differ based on region (
Table 2,
Figure 3). Since 2005, the proportion of wild boar shot on drive hunts has increased (
Figure 2,
Table 1). After an increase in wild boar shot on drive hunts within the own hunting ground until 2010 this proportion was lowered again since 2011 and showed just a slight decrease during the last two decades (thus, there was no change detectable;
Table 1), whilst the proportion of wild boar shot on conjoint drive hunts was increasing continuously (
Figure 2,
Table 1). Meanwhile, the proportion of wild boars on a single hunt did decrease (
Figure 2,
Table 1).
Table 1. Linear models explaining trends of proportions of the hunting methods single and drive hunt (shot animals as % of total hunting bag per hunting method).
Linear models explaining trends of proportions of the hunting methods single and drive hunt (shot animals as % of total hunting bag per hunting method).
| Hunting Method |
Variable |
Estimate |
SE |
p |
R2 |
F |
| Total single hunt |
Intercept |
13.6851 |
2.3321 |
1.48 × 10⁻⁵ |
0.6326 |
(1.18) = 30.99 |
| Year |
−0.0065 |
0.0012 |
2.77 × 10−0.5 |
| Shot at bait (within single hunt) |
Intercept |
28.8145 |
8.9892 |
0.0150 |
0.5896 |
(1.7) = 10.06 |
| Year |
−0.0142 |
0.0045 |
0.0157 |
| Total drive hunts |
Intercept |
−12.6370 |
2.2829 |
2.96 × 10⁻⁵ |
0.6407 |
(1.18) = 32.1 |
| Year |
0.0064 |
0.0011 |
2.25 × 10⁻⁵ |
| Drive hunt in own hunting ground |
Intercept |
2.4215 |
2.0680 |
0.257 |
0.0617 |
(1.18) = 1.184 |
| Year |
−0.0011 |
0.0010 |
0.291 |
| Comprehensive drive hunts |
Intercept |
−15.30 |
1.533 |
9.20 × 10⁻⁹ |
0.8491 |
(1.18) = 101.2 |
| Year |
7.671 × 10⁻³ |
7.624 × 10⁻⁴ |
8.12 × 10⁻⁹ |
Table 2. The proportions of hunting methods within hunting statistics differ based on six regions in the years 2010 and 2011. Results of Chi
2 goodness of fit test.
goodness of fit test.
| Hunting Method |
df |
p |
x2 |
| Single hunt at bait |
5 |
<0.001 |
1492.0 |
| Single hut within fields |
5 |
<0.001 |
830.0 |
| Accidential at hunt for other game from hide |
5 |
<0.001 |
125.3 |
| stalking |
5 |
<0.001 |
115.3 |
| Collective hide |
5 |
<0.001 |
113.9 |
| Drive hunt within own hunting ground |
5 |
<0.001 |
1317.5 |
| Comprehensive drive hunt |
5 |
<0.001 |
1179.8 |
| Selective wild boar drives |
5 |
<0.001 |
144.7 |
| During harvest |
5 |
<0.001 |
189.8 |
| Small game drive hunt |
5 |
<0.001 |
364.2 |
2.2. How to Hunt?
2.2.1. Do You Bait Wild Boar in Your Hunting Ground?
(N = 7429, database: WTE 2012, singular query in 2012)
There were regional percentage differences on hunting grounds where bait was used (
Figure 4). In hunting grounds in regions with higher frequencies or densities of wild boar, baiting was conducted more frequently (chi
2 goodness of fit test:
x2 = 446.6, df = 5,
p < 0.001). Baiting was more common in regions with higher wild boar densities and less common regions with fewer wild boar occurrences. Those hunting grounds with baiting stations had a mean of 2.6 baiting stations per hunting ground; this did differ between regions (W: 2.2 bs/hg, E: 2.7 bs/hg, see
Figure 1; Kruskal–Wallis test:
x2 = −4541.5, df = 5,
p < 0.001).
Figure 4. Percentages of hunting grounds with or without baiting for wild boar, N = North, S = South, W = West, E = East, CL = central Lowlands, H = Harz mountains, na = not answered. N = 7429, database: WTE 2012, singular query in 2012.
2.2.2. Do You Conduct Drive Hunts on Wild Boar?
(N = 7907, database: WTE 2012, singular query in 2012).
The proportion of hunting grounds where drive hunts were conducted differed due to the occurrence, frequency and density of wild boar (
Figure 5, chi
2 goodness of fit test:
x2 = 836.7, df = 3,
p < 0.001). Only half of the hunting grounds in areas with resident wild boar conducted joint hunts.
Figure 5. Percentages of hunting grounds conducting drive hunts on wild boar within different wild boar occurrence probabilities, na = not answered. N = 7907, database: WTE 2012, singular query in 2012.
2.2.3. On the Drive Hunts You Conduct: Wild Boar Is (A) Main Species or (B) Incidental Species (“Bycatch”)? Which Other Game Species Are Hunted?
(N = 3234 hunting grounds conducting drive hunts at all, database: WTE 2012, singular query in 2012)
In about one-third of all private hunting grounds drive hunts were conducted. Wild boar was considered as the main or aim species in 52% of hunts and considered as an incidental species (“bycatch”) in 21% of hunts. Other ungulate species were hunted regionally and their occurrences differ as follows: red deer
Cervus elaphus (20.6%), fallow deer
Dama dama (21.3%), mouflon
Ovis orientalis musimon (2.4%). On 79% of private hunting grounds, that were conducting drive hunts and answering our questions, roe deer
Capreolus capreolus, 82% meso-predators such as red fox
Vulpes vulpes and martens, all of which are common species, were hunted along with wild boar.
2.2.4. How Do You Conduct Drive Hunts?
- (a)
-
conduction “hunting method”
-
(N = 1969, database: WTE 2012, predetermined answers, see
Supplementary Materials, Table S3 and Figure S4).
Specifically, 65% beat thickets, 16% drove reed and 29% drove copses (within selective drives) (only small overlap of doing at least two of those;
Supplemental Material Figure S4). Additionally, beating maize had high percentages in the northern (60%) and north-western (63%) regions. Intertillage was driven regularly in agricultural regions (33–67%), but only seldom in forested areas (11–15%). Heavy drive hunts had their focus in the eastern parts of Lower Saxony (48–59%), whilst poking (driving only with dogs, no beaters; 5–23%) and slow beating (17–44%) were conducted much less. Collective hides were conducted in about 40% of all answering hunting grounds similarly in all regions. A total of 1467 hunting grounds answered whether they hunted with (94%) or without (6%) dogs.
- (b)
-
hunting party
-
(N = 2224, WTE 2012, predetermined answers):
51% hunted with invited hunters (e.g., neighbours, friends), 48% hunted solely with friends and “co-hunters”, as well as 1% of private hunting grounds had guests who had to pay for the hunt. The proportions of invited hunters differed between regions (chi
2 goodness of fit test: df = 5,
p < 0.001, friends:
x2 = 261.9; invited guest:
x2 = 240.9; paying guests:
x2 = 20.6).
- (c)
-
type of stands*
-
(N = 2119, database: WTE 2012, singular query in 2012, *stands are defined as the position and facility where the hunters are placed)
About 50% used combinations of different types of stands for drive hunts (thus, we have a total count of 3180 answers). Preferred were drive hunt stands (low raised hides ~1.5 m = 44%), followed by stands on ground level (30%), and typically raised hides (>3 m, 26%, usually for seated hiding during a single hunt, “high seat”). The proportions of types of stands used for drive hunts differed strongly within the diverse regions (
Figure 6, chi
2 goodness of fit test: df = 5,
p < 0.001, drive hunt stand:
x2 = 553.0; ground level:
x2 = 331.8; raised hide:
x2 = 152.4). Especially in those regions with low wild boar densities (N north, NW northwest, SW southwest, compare
Figure 1 for a geographical overview), there seemed to be no tradition for drive hunt stands. Hunters did use raised hides quite a lot (existing structures) or just shot standing on ground level during small drive hunts within, e.g., fields, thickets or copses.
Figure 6. Percentages of hunting grounds using different types of stands within wild boar drive hunts. N = North, S = South, W = West, E = East, CL = central Lowlands, H = Harz mountains. N = 2119, database: WTE 2012, singular query in 2012.
2.2.5. Do You Have Any Difficulties in Conducting Drive Hunts? Which Are These?
(N = 2357, database: WTE 2012, singular query in 2012, predetermined answers)
62% (of those answering) had no difficulties in conducting drive hunts. In those regions with low wild boar densities, the effort seemed to be too high (24%). A small proportion (11%) had problems with adverse conditions for shooting due to dense vegetation. A total of 7% of the tenants had some problems selling the high amount of hunting bags. Only 6% had problems getting good dogs and shooters. All other reasons made up less than 5% (organisation 4%, building drive hunt stands 3%, hygienic reasons (cooling, water) 2%, trailing dogs 1%).
3. Current Insights
The WTE does not only provide long-time and area-wide data on hunting bags and wildlife population estimates but also allows with its high rate of participation for insights into human habits. Not only was our data informative and enlightening on regional hunting methods, but we were also able to gain insight into hunters’ abilities, aims and opinions. The variety of different landscapes and different regions within Lower Saxony, as well as the notable participation quota in our study, would give us the ability to transfer our findings with other regions in Germany or even other countries in comparison (well knowing that there are few similar investigations). It would be worthwhile to conduct similar investigations on a broader basis on a European level and ask for changes in hunting attitudes especially in regions where African swine fever occurred.
In general, the rate of hunters answering more specific questions on how hunting was conducted (compare
Figure 6) was much lower than the proportion of answers on more general hunting questions (see, e.g.,
Figure 2) (compare also
[27]). This may mainly base on the occurrence of wild boar in Lower Saxony: hunters without resident wild boar occurrences cannot answer some of these specific questions generally
[27]. Thus, the proportion of hunting grounds conducting wild boar drive hunts could be fostered by more conjoint drive hunts (several hunting grounds with transient wild boar work together). Additionally, possibly this may show some deficiencies in knowledge on how to hunt wild boar sufficiently, and perhaps, also reveals an existing proportion of inexpertness perhaps of the obstinacy of hunters (diminishing speed of innovations). Hunters should be skilled and trained furthermore in all aspects of wild boar hunting (a necessity for regulation, wild boar biology, possibilities for different hunting methods such as targeted single hunt or specific drive hunts especially in low-density areas) to ensure sufficient hunting performance, especially in regions with spreading populations.
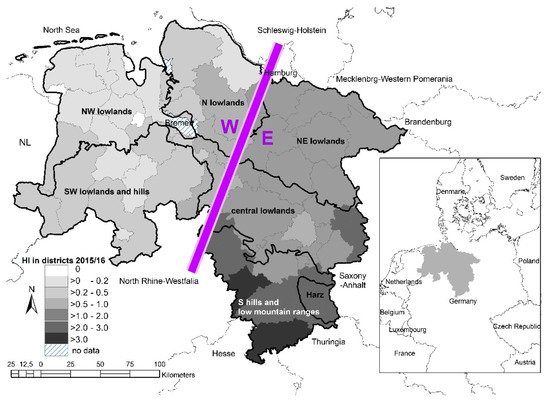
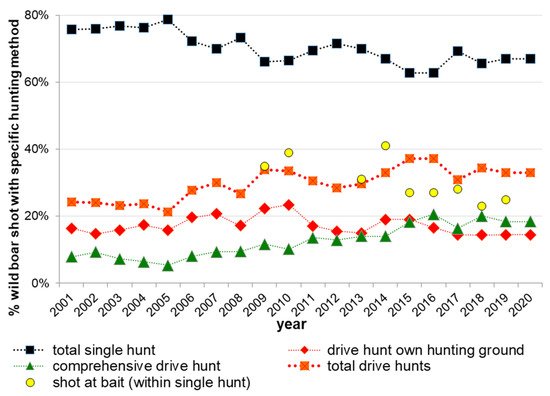
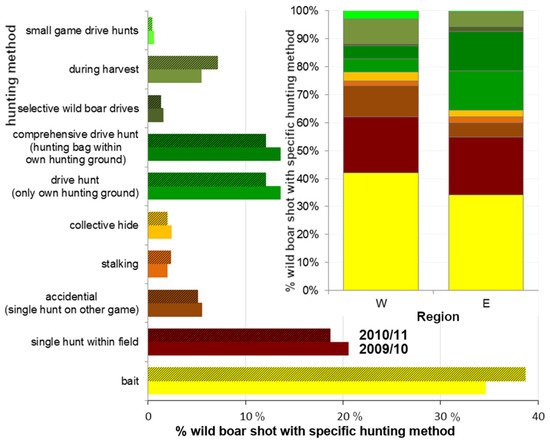
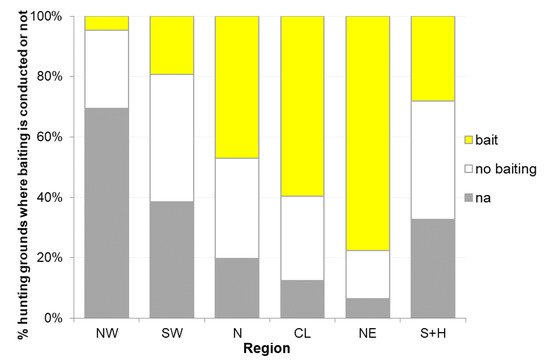
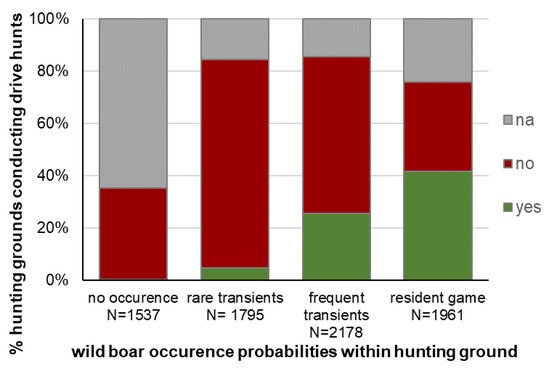
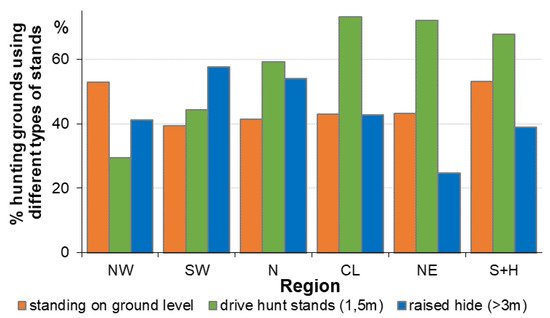 Figure 6. Percentages of hunting grounds using different types of stands within wild boar drive hunts. N = North, S = South, W = West, E = East, CL = central Lowlands, H = Harz mountains. N = 2119, database: WTE 2012, singular query in 2012.