This entry aims to compare two extraction procedures for the analysis of phthalates (PAE) in hot drinks collected from vending machines, usually coffee and tea. The two analytical procedures rely on solid phase extraction (SPE) using C18 cartridge and ultrasound and vortex assisted liquid-liquid dispersive microextraction (DLLME) to mechanically improve dispersion, each followed by a routine analytical method such as GC- FID. Seven phthalates (DMP, DEP, DiBP, DBP, DEHP, DOP, DDP) were analyzed and determined. All analytical parameters (i.e., recovery, limit of detection, limit of quantification, enrichment factors, repeatability, reproducibility) were studied and discussed, as well as the matrix effect. The whole procedure was applied to hot drink matrices, for example coffee, decaffeinated coffee.
1. Introduction
SPE is a sample pretreatment technique that is based, like DLLE, on the partitioning of the analytes present in a sample between the sample solution and a stationary phase consisting of an adsorbent solid. Over time, different types of SPE have been developed, depending on the amount of adsorbent phase used and the solid support used to contain it. The applicability of the SPE to the different matrices analyzed is mainly determined by the polarity of the analytes and the adsorbent used. Polymeric absorbents based on styrene-divinylbenzenes such as XAD have been introduced, also for the retention of polar substances. Then there is the graphitized carbon (GCB), which has a high versatility but which encounters particular problems in the elution of acidic substances due to the strong interaction between these compounds and the oxygen complexes present on its surface. In recent years, immunosorbents have been developed which, thanks to the high chemical selectivity provided by the antigen-antibody interaction, give the analytical method a high sensitivity.
The DLLME, introduced by Rezaee et al. in 2006, it is based on a three-component system consisting of the solution containing the analytes, an extraction solvent and a dispersant, the latter quickly added to the sample to create a peat solution. This technique involves the extraction of analytes from a solution by adding a small volume of an immiscible extraction solvent with the aqueous sample. To optimize the extraction, the researchers used a dispersion solvent to favor the contact surface between the aqueous solution and the extractant with the formation of an oil-in-water microemulsion. The factors influencing this technique are (i) the volume and type of extractant, (ii) the dispersant and (iii) the extraction time. The division of the analytes between the solution and the extractor is very fast and it only takes a few seconds to obtain an optimal extraction. On the other hand, the volume of the extraction solvent is very important; in fact, the final concentration of the analytes depends on it. Its optimization allows to maximize the preconcentration factor and the aptitude of this technique to the subsequent detection of pollutants present in traces. Initially, chlorinated organic compounds with a density greater than water were used as extraction solvents; subsequently, due to their toxicity, low density organic solvents such as long chain alcohols and hydrocarbons were preferred. DLLME has proven extremely versatile in researching molecules such as organophosphorus pesticides (OPPs), chlorobenzenes, triazine herbicides, chlorophenols, polychlorinated biphenyls (PCBs), halogenated organic compounds, pyrethroid pesticides in various food matrices, as well as phthalate esters in both food and alcoholic beverages/recreational facilities and in various plastic beverage containers.
2. Results and Discussion
In this entry, two different extraction techniques are compared for the extraction of PAE from hot drinks generally consumed in plastic containers. PAEs can migrate from the container walls into the container contents, since they are not chemically bonded to the plastic polymer. Since recent studies have demonstrated their possible negative effects on humans, a sensitive and reliable extraction method is required for their extraction and subsequent quantification in the most consumed beverages.
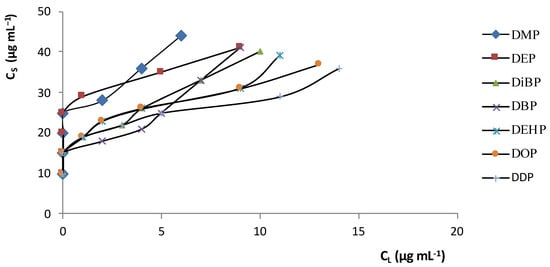
In order to create the best analytical conditions for SPE, adsorption isotherms and breakthrough curves were investigated. Figure 1 shows the distribution isotherms for PAEs between the aqueous solution phase and the C 18 adsorbent (CS is the solute concentration in the solid phase and CL the solute concentration in the liquid phase). The curves are shifted towards the solid phase (CS>>CL,) at different concentrations of PAE (low and high); this presence means that the compounds (solutes) have an affinity towards the adsorbent.
Figure 1. PAE distribution isotherms between the C18 adsorbent and the aqueous solution at 25 °C.
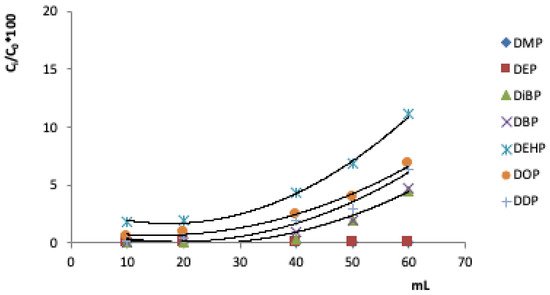
Another important parameter in the evaluation of the SPE methodology concerns the breakthrough curves. They allow you to determine the maximum volume that passes through the cartridge without loss of analyte. Above this volume, the adsorbent phase is unable to retain the analytes, and begins to release analytes into the eluate. Figure 2 shows the turning curves for the seven PAEs studied, i.e. the fraction of the analyte (Ci/C0%) versus volume (mL).
Figure 2. Breakthrough curves of the investigated PAEs in 100 mL of solution added with 40 µg mL -1 of each analyte on the C18 cartridge (100 mg).
The breakthrough curves allow us to find the volume of breakthrough, i.e., the maximum volume for quantitatively retaining the investigated compounds by the adsorbent. The theoretical breakthrough volume was 40 mL, which was also used as the experimental breakthrough volume.
For PAE recoveries different solvents were tested in this study, namely acetone, ethyl acetate,
n-heptane, toluene,
iso-octane,
n-pentane, ethanol and chloroform. Acetone, ethyl acetate and
n-heptane were able to extract PAEs, with different performances (between 40.5% and 100.2%, 21.8% and 101.9%, and 61.4% and 94.7%, respectively). The other solvents such as toluene,
iso-octane,
n-pentane, ethanol and chloroform show very low recoveries. Looking at the data obtained, the best extraction solvent was
n-heptane.
As regards the analytical parameters, the seven PAEs were investigated in the linearity range 5–500 µg mL
−1 (except DEP and DDP, investigated in the range 10–500 µg mL
−1), showing R
2 > 0.9938 and achieving percentage recoveries ranging between 75 and 95%, except for DMP (0.9862 and 43.2%, respectively).
In order to validate the analytical protocol, the sensibility of the method in terms of limit of detection (LOD) and limit of quantification (LOQ) was studied. LODs and LOQs were determined on the basis of the criteria proposed by the International Conference on Harmonization, namely Validation of Analytical Procedure: an analyte that produces a chromatographic peak equal to three times, LOD, or seven times, LOQ, the standard deviation of the baseline noise. The extraction method used showed the value of LODs and LOQs as ranging between 0.1 and 0.9 µg mL
- 1 as well as 1.3 and 8.2 µg mL
−1, respectively, confirming the goodness of the analytical methodology. Precision and accuracy were studied on the basis of the repeatability of the method in one day (intra-day 1 and 2) and in three consecutive days (inter-day). Relative standard deviation (RSD) for intra-day and inter-day measurements, ranges between 3.9 and 11% as well as 5.2 and 14.7%, respectively. Finally,
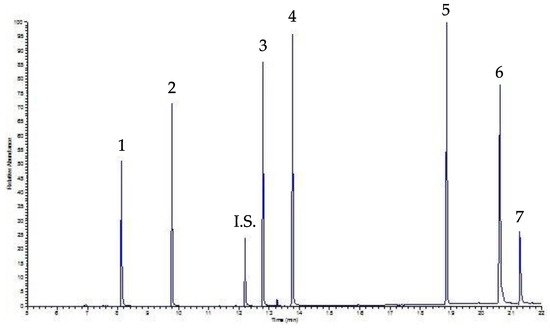
Figure 3 shows a chromatogram of a beverage sample, coffee, spiked with a mixing solution containing 30 µg mL
−1 of each PAE after SPE procedure; the peaks are well-solved and neat.
Figure 3. SPE-GC-FID chromatogram of a coffee sample spiked with 30 µg mL−1 of each PAE. Peaks: 1 DMP, 2 DEP, I.S. Internal Standard, 3 DiBP, 4 DBP, 5 DEHP, 6 DOP, 7 DDP.
On the other hand, as regards DLLME, the original protocol of this extraction technique is based on a ternary system, which extracts analytes in aqueous solution. The dispersing and extracting solvents are added rapidly to the aqueous solution in order to obtain a cloudy solution. The dispersing solvent carries the extraction solvent into the aqueous solution, increasing the contact surface between the investigated analytes and the extraction solvent. Dispersion was achieved by vortexing and ultrasound, as deeply investigated in a previous papers. In this study we have eliminated the addition of NaCl because it has been noted that the breaking of the microemulsion is ensured only by the centrifugation phase, allowing a reduction in the steps of the method and, therefore, the analysis times.
By using UVA-DLLME as the extraction technique, the authors were able to achieve percentage recoveries ranging between 70.2 and 104.0 %. Further, LODs and LOQs achieved by this approach are slightly better than those reported for SPE extraction as well as in the intra-day and inter-day precision.
Finally,
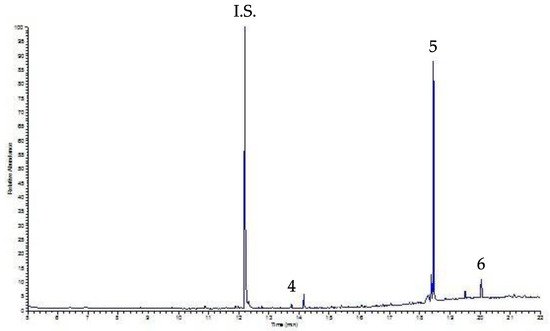
Figure 4 shows the chromatogram of the same sample analyzed in
Figure 3 (i.e., a beverage sample, precisely coffee, spiked with a mixing solution containing 30 µg mL
−1 of each PAE), this time processed by UVA-DLLME. As can be seen, the chromatogram is still well-solved and clear, but in this case the baseline is better, allowing for a lower LOQ than that determined by the SPE approach.
Figure 4. UVA-DLLME-GC-FID chromatogram of a coffee sample spiked with 30 µg mL−1 of each PAE.
In general, both SPE and UVA-DLLME techniques showed good and satisfactory percentage recoveries. The UVA-DLLME technique showed higher recoveries compared to SPE, ranging between 70.2 and 104.0% as well as 77.7 and 93.6%, respectively. The LODs and LOQs obtained are sufficient for determining and quantifying the PAEs in hot beverages. In particular, the UVA-DLLME showed lower values of LOD and LOQ compared to those of SPE, which highlights the higher sensibility of the SPE. Furthermore, the SPE technique has the advantage of achieving higher pre-concentration factors, compared to the UVA-DLLME, whereas this latter technique reduces the analysis times for obtaining the final solution to be injected in the GC, as well as using a smaller volume of solution. The analytical parameters show that the UVA-DLLME technique had greater precision, achieving recoveries ranging between 70.2 and 104.0%, with an RSD lower than 9.2%. These data confirm the robustness and goodness of the analytical protocol. Although the SPE technique showed a higher pre-concentration factor and a higher sensitivity, the UVA-DLLME reached higher quantitative recoveries, with higher precision. Furthermore, UVA-DLLME allowed us to extract the analytes by means of a small amount of
n-heptane (50 µL).
Finally, the UVA-DLLME procedure was applied to coffee and decaffeinated coffee samples.
Figure 5 shows the relative chromatogram of the decaffeinated sample; for both samples the only peaks detected were DEHP and DOP (DBP is less than the LOQ to be evaluated), at levels not affecting human health.
Figura 6. UVA-DLLME-GC-FID chromatogram of a decaffeinated coffee sample
Even if these data show no worrying situation, the next step of this approach is to confirm the results obtained by gas chromatography mass spectrometry analysis (GC-MS); this method of analysis can reach very low LOQs and avoid positive/negative artifacts that could affect the results.