Lithium-ion battery datasheets, also known as specification sheets, are documents that battery manufacturers provide to define the battery’s function, operational limit, performance, reliability, safety, cautions, prohibitions, and warranty. A datasheet lists information about the product for both informational and advertising purposes. Product manufacturers and customers rely on the datasheets for battery selection and battery management.
- lithium-ion batteries
- datasheets
- specifications
- battery manufacturers
- end-users
1. Introduction
Commercial lithium-ion batteries have been the dominant power supply for today’s consumer electronics and high-power and energy mobile systems [1][2][1,2]. A technical specification sheet (datasheet) is a document that prescribes technical requirements to be fulfilled by a product, process, or service [3], is needed to choose and use a lithium-ion battery. A datasheet lists information about the product for both informational and advertising purposes [4]. Datasheets typically define the basic capabilities and performance characteristics, including product composition, methods of use, operating requirements, common applications, and product warnings.
Customers use lithium-ion battery datasheets to select the most appropriate battery for an application; these datasheets also guide product manufacturers to develop battery management systems for enhanced performance, reliability, and safety. A confusing or misleading term describing these performance parameters will affect a proper evaluation of the batteries and datasheet validation and may cause legal issues between customers and battery manufacturers. For example, a capacity term whose measurement condition is not explicitly listed can make the capacity warranty equivocal. Academia also test commercial lithium-ion batteries per the specifications to analyze and model degradation, failure, and protection mechanisms. Any inconsistencies can lead to studies using these batteries being incomplete, invalid, and not ready to be implemented for real-world applications. To date, however, there has been no dedicated review research conducted to investigate various problems in lithium-ion battery datasheets, based on the results of thorough literature research in the major academic publishers (IEEE, Elsevier, Wiley, MDPI, Springer, etc.) and Google scholar search with keywords such as “battery” and “datasheet” or “specification”) [5][6][7][8][9][10][11][5,6,7,8,9,10,11]. This work is a first step toward filling this void by recommending improvements to the battery manufacturers.
This paper is motivated by the difficulty of using battery datasheets to compare suppliers, conduct battery tests, and design products that require batteries. The information provided in the datasheet is insufficient for the end-users due to issues including discrepancies for the same term such as using one voltage reading to specify the capacity but another to specify the cycle life, lack of critical parameters such as the operating current limits, and ambiguity such as specifying a term’s value without mentioning the measurement conditions.
Recommendations are provided for battery manufacturers to develop an informative datasheet with clearly and completely defined items. An informative datasheet will make it easier for users to correctly compare suppliers’ performance, evaluate the lifetime, and develop battery management systems with the appropriate voltage, current, and temperature limits.
2. Electrical Performance and Operating Limits
IEC ref 482-03-15 [3] defines the rated capacity as the capacity value of a battery determined under specified operating conditions and declared by the manufacturer. ANSI C18.2M [12][36] describes the rated capacity as the quantity of electricity declared by the manufacturer which a single cell or battery can deliver during a 5 h period when charging, storing, and discharge under the conditions specified in the ANSI standard in which the battery datasheets determine the cut-off voltage values. ISO 12405-4 describes the rated capacity [13][37] as the supplier’s specification of the total number of ampere-hours that can be withdrawn from a fully charged battery pack or system for a specified set of test conditions, such as discharge rate, temperature, and discharge cut-off voltage.
Battery manufacturers should recommend charging and discharging C-rates for different temperature ranges, considering the adverse effect of increasing C-rate on battery lifetime due to mechanical stress and side-electrochemical reactions such as lithium plating and gas generation. When specifying the maximum discharge current/C-rate, the datasheet should provide the values for continuous discharge rate, pulse discharge rate with pulse length, the applied state of charge (SOC), and temperature range, such that users know the conditions they can use the battery up to the maximum discharge current.
Increased impedance/resistance can cause the battery terminal voltage to reach the discharge cut-off voltage and terminate the battery’s discharge operation, thus decreasing the battery’s power capability and deliverable capacity. In addition to the measurement temperature and battery SOC for the resistance/impedance values, battery datasheets should specify the measurement frequency for the impedance values. A comparison of different methods to measure the internal resistance and impedance can be found in [14][40].
Specific energy, also called gravimetric energy density, is the energy per unit mass stored in a lithium-ion battery/cell. Specific power is the power per unit mass provided by a lithium-ion battery/cell, changing with battery SOC and operating conditions. The specific energy and power are useful in comparing the cost per unit of energy or power among different batteries.
3. Reliability and Recommendations for Storage
The maximum amount of charge that a battery can deliver decreases with usage (cycle life through charge-discharge cycles) and storage (calendar life), known as capacity fade. A lithium-ion battery reaches the end of life when its capacity no longer meets the mission’s requirement, described by the end-of-life (EOL) threshold that is predetermined for the mission. The EOL threshold is application dependent. There is also a required number of cycles or time (lifetime requirement) for each mission. That is, the battery capacity should not drop below the EOL threshold until the required lifetime. Lithium-ion batteries with unsatisfactory lifetimes can significantly reduce customer satisfaction and make products inefficient to use in such applications. Thus, the cycle life and storage life are specified in the datasheets.
Table 17 summarizes the cycle life parameters in the 25 datasheets in which the cycle life is specified for as low as 200 cycles and as high as 15,000 cycles. The cycling characteristics are usually in the form of plots (capacity vs. cycles) or the capacity retention value after being used for a certain number of cycles in which lithium-ion batteries are cycled at certain environmental and loading conditions for a specific number of cycles. Most of the 25 datasheets provide the cycling characteristics for one testing condition, whereas the A123 ANE26650m1-B datasheet provides the plots for multiple testing conditions.
| Manufacturer | Model | Cycle Life |
|---|---|---|
| Panasonic | NCR18650PF | The capacity fade curve for 500 cycles |
| Panasonic | NCR18650B [15] | The capacity fade curve for 500 cycles |
| Panasonic | NCR18650BD | The capacity fade curve for 500 cycles |
| Panasonic | NCR18650BF | The capacity fade curve for 300 cycles |
| Panasonic | UR18650GA | The capacity fade curve for 500 cycles |
| Panasonic | UR18650ZY | Discharge time >38 min. at standard discharge conditions after 300 cycles |
| Panasonic | UR1865ZM2 | The capacity fade curve for 1000 cycles |
| Samsung | ICR18650-26J | ≥1785 mAh (70%) after 300 cycles |
| Samsung | INR21700-50E | ≥3802 mAh (80%) after 500 cycles |
| Samsung | NR18650-15Q | ≥870 mAh (60%) after 250 cycles |
| LG Chem | 18650HE2 | ≥60% after 300 cycles at 10 A discharge or after 200 cycles at 20 A discharge |
| LG Chem | ICR18650MF1 | ≥70% after 500 cycles |
| LG Chem | INR18650 B4 | ≥80% after 300 cycles |
| A123 | AMP20m1HD-A | The capacity fade curve for 3200 cycles |
| A123 | ANR26650m1-B | The capacity fade curves for three conditions up to 1450 cycles |
| ATL | 902738 | — |
| Routejade | SLPB8043128H | ≥2560 mAh after 1000 cycles |
| Routejade | SLPB526495 | ≥2640 mAh after 1000 cycles |
| EEMB | LIR18650 | ≥2050 mAh after 300 cycles |
| EEMB | LIR1632 | ≥80% after 500 cycles |
| GMB | GMB043450S | ≥70% after 500 cycles |
| VPW | 580013 | ≥80% after 2000 cycles at 25 °C, or after 1200 cycles at 45 °C |
| VPW | 580049 | ≥80% after 200 cycles |
| Toshiba | Toshiba-LTO-20AH | The capacity fade curve at 3C, 25 °C up to 15,000 cycles |
| Johnson Controls-SAFT | MP 174865 xlr | The capacity fade curve at C/2, 20 °C up to 950 cycles |
IEC ref 482-03-47 [3] defines storage life (shelf life) as the duration, under specific conditions, at the end of which a battery has retained the ability to perform a specified function. As shown in the third column in Table 28 , out of the 25 datasheets, 21 specify the recommended storage temperature range (ATL, VPW, and Toshiba battery types do not provide information); however, the datasheets do not explain the implications for the storage time associated with each temperature range. For example, the statement “−20–50 °C, less than 1 month” does not reveal the amount of charge and capacity left after the battery is stored for a month at 50 °C.
| Manufacturer | Model | Storage Temperature (°C) | Charge Retention | Capacity Retention |
|---|---|---|---|---|
| Panasonic | NCR18650PF | −20–50 | — | — |
| Panasonic | NCR18650B [15] | −20–50 | — | — |
| Panasonic | NCR18650BD | −20–50 | — | — |
| Panasonic | NCR18650BF | −20–50 | — | — |
| Panasonic | UR18650GA | −20–50 | — | — |
| Panasonic | UR18650ZY | −20–50, less than 1 month −20–40, less than 3 months −20–20, less than 1 year |
Discharge time > 30 min (25 °C) after 20 days at 60 °C, 100% SOC | Discharge time > 40 min (25 °C) after 20 days at 60 °C, 100% SOC and being fully charged at 25 °C |
| Panasonic | UR1865ZM2 | 20–50, less than 1 month −20–40, less than 3 months −20–20, less than 1 year |
— | — |
| Samsung | ICR18650-26J | −20–60, 1 month −20–45, 3 months −20–23, 1 year |
Charge ≥ 2040 mAh (80%) after 30 days at 23 °C, 100% SOC | — |
| Samsung | INR21700-50E | −20–60, 1 month −20–45, 3 months −20–23, 1 year |
Charge ≥ 2040 mAh (80%) after 30 days at 60 °C, 100% SOC | — |
| Samsung | NR18650-15Q | 45–60, 1 month 20–45, 3 months −20–25, 18 months |
— | — |
| LG Chem | 18650HE2 | −20–60, 1 month −20–45, 3 months −20–20, 1 year |
Charge ≥ 90% after 1 month at 23 °C, 100% SOC | Capacity ≥ 80% after 1 week at 60 °C, 100% SOC |
| LG Chem | ICR18650MF1 | −20–60, 1 month −20–45, 3 months −20–20, 1 year |
Charge ≥ 90% after 30 days at 25 °C, 100% SOC | Capacity ≥ 80% after 1 week at 60 °C, 100% SOC |
| LG Chem | INR18650 B4 | −20–60, 1 month −20–45, 3 months −20–20, 1 year |
Charge ≥ 90% after 30 days at 25 °C, 100% SOC | Capacity ≥ 80% after 1 week at 60 °C, 100% SOC |
| A123 | AMP20m1HD-A | −40–60 | — | — |
| A123 | ANR26650m1-B | −40–60 | — | — |
| ATL | 902738 | — | The cell voltage for long-time storage shall be 3.6–3.9 V at 25 ± 3 °C after 3 months | — |
| Routejade | SLPB8043128H | 40–60 for up to 1 week 25–40 for up to 3 months −20–25 for up to 1 year |
Charge ≥ 75% after 1 week at 60 °C, 100% SOC | — |
| Routejade | SLPB526495 | 40–60 for up to 1 week 25–40 for up to 3 months −20–25 for up to 1 year |
Charge ≥ 75% after 1 week at 60 °C, 100% SOC | — |
| EEMB | LIR18650 | 1 month: −5–35 °C; 6 months: 0–35 °C. |
Discharge time ≥4 h after 12 months storage at 40–50% SOC at 25 °C, 65 ± 20% RH | — |
| EEMB | LIR1632 | 1 month: −20–60 °C 3 months: −20–45 °C 12 months: −20–25 °C |
Electricity Charge: 80% after 28 days at 20 °C at 100% SOC | Capacity fade over storage time at 20, 40, 60 °C |
| GMB | GMB043450S | Less than 1 year: −20–25 Less than 3 months: −20–40 |
— | — |
| VPW | 580013 | — | — | — |
| VPW | 580049 | — | — | — |
| Toshiba | Toshiba-LTO-20AH | — | — | The capacity fade over float storage time at 25, 35 and 45 °C, 2.7 V |
| Johnson Controls-SAFT | MP 174865 xlr | Recommended: 10–30 Allowable: −40–60 |
— | — |
Nine datasheets specify the amount of charge left in a battery after being stored at 100% SOC. Five datasheets specify the capacity retention after storage. Particularly, EEMB LIR1632 provides the capacity fade over storage time at three different temperatures. ATL 902738 specifies the cell voltage after storage. Toshiba provides the capacity fade over float storage at 2.7 V at three different temperatures.
4. Discrepancies in Datasheets for the Same Battery Model
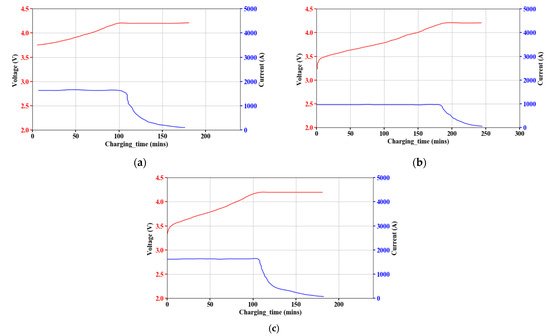
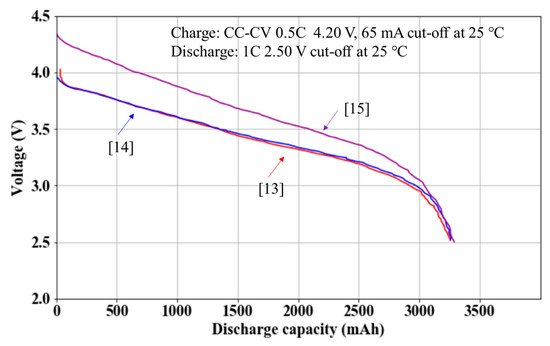
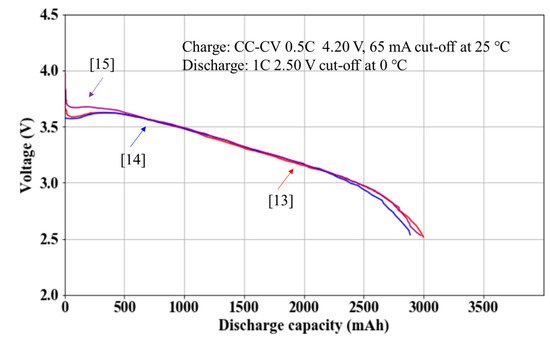
For Panasonic NCR18650B cells, three different datasheets are found online [16][17][15][13,14,15]. The specified capacity and nominal voltage are the same; however, the physical parameters, charge/discharge characteristic curves, and cycling characteristics curves are all different. Figure 13 compares the charge curves. The charging C-rate is 0.5 C in “The Charge Characteristics for NCR18650B” Plot [16][13] and “Charge Characteristics” Plot [15] and 0.3 C in “TYPICAL CHARGE CHARACTERISTICS” plot [17][14].

Figure 24 and Figure 35 shows that compares that the discharge characteristic curves are inconsistent with each other at the same discharge C-rate and temperature. The discharge curves have significant variation. This may be due to a change in the electrode and electrolyte properties or variation in the manufacturing batch. These should be clarified in the datasheet so customers can select the right product for their targeted application.


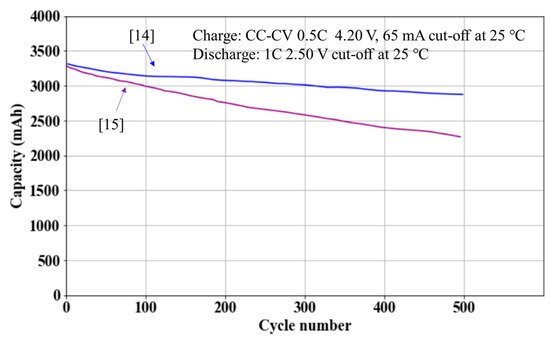
Figure 46 shows there is a distinct difference between the cycling performance in the two data sheets [17][15][14,15]. This all results in confusion for low-volume battery customers who do not have direct communication access with battery manufacturers. Thus, battery manufacturers should provide the official datasheet for clarification for commercial-off-the-shelf battery models sold on various third-party sales websites. The battery manufacturer should confirm the credentials of distributors and third-party sales websites.

