This entry aims to compare two extraction procedures for the analysis of phthalates (PAE) in hot drinks collected from vending machines, usually coffee and tea. The two analytical procedures rely on solid phase extraction (SPE) using C18 cartridge and ultrasound and vortex assisted liquid-liquid dispersive microextraction (DLLME) to mechanically improve dispersion, each followed by a routine analytical method such as GC- FID. Seven phthalates (DMP, DEP, DiBP, DBP, DEHP, DOP, DDP) were analyzed and determined. All analytical parameters (i.e., recovery, limit of detection, limit of quantification, enrichment factors, repeatability, reproducibility) were studied and discussed, as well as the matrix effect. The whole procedure was applied to hot drink matrices, for example coffee, decaffeinated coffee.Questa voce vuole confrontare due procedure di estrazione per l'analisi degli ftalati (PAE) nelle bevande calde raccolte presso i distributori automatici, solitamente caffè e tè. Le due procedure analitiche si basano sull'estrazione in fase solida (SPE) mediante cartuccia C18 e sulla microestrazione liquido-liquido dispersiva (DLLME) assistita da ultrasuoni e vortice per migliorare meccanicamente la dispersione, ciascuna seguita da un metodo analitico di routine come GC-FID . Sono stati analizzati e determinati sette ftalati (DMP, DEP, DiBP, DBP, DEHP, DOP, DDP). Tutti i parametri analitici (vale a dire, recupero, limite di rilevabilità, limite di quantificazione, fattori di arricchimento, ripetibilità, riproducibilità) sono stati studiati e discussi, così come l'effetto matrice. L'intera procedura è stata applicata a matrici di bevande calde, ad esempio caffè, caffè decaffeinato,
1. Introduzione
La SPE è una tecnica di pretrattamento del campion
SPE is a sample pretreatment technique that is based, like DLLE, on the partitioning of the analytes present in a sample between the sample solution and a stationary phase consisting of an adsorbent solid. Over time, different types of SPE have been developed, depending on the amount of adsorbent phase used and the solid support used to contain it. The applicability of the SPE to the different matrices analyzed is mainly determined by the polarity of the analytes and the adsorbent used. Polymeric absorbents based on styrene-divinylbenzenes such as XAD have been introduced, also for the retention of polar substances. Then there is the graphitized carbon (GCB), which has a high versatility but which encounters particular problems in the elution of acidic substances due to the strong interaction between these compounds and the oxygen complexes present on its surface. In recent years, immunosorbents have been developed which, thanks to the high chemical selectivity provided by the antigen-antibody interaction, give the analytical method a high sensitivity.
The DLLME, introduced by Rezaee et al. in 2006, it is based on a three-component system consisting of the solution containing the analytes, an extraction solvent and a dispersant, the latter quickly added to the sample to create a peat solution. This technique involves the extraction of analytes from a solution by adding a small volume of an immiscible extraction solvent with the aqueous sample. To optimize the extraction, the researchers used a dispersion solvent to favor the contact surface between the aqueous solution and the extractant with the formation of an oil-in-water microemulsion. The factors influencing this technique are (i) the volume and type of extractant, (ii) the dispersant and (iii) the extraction time. The division of the analytes between the solution and the extractor is very fast and it only takes a few seconds to obtain an optimal extraction. On the other hand, the volume of the extraction solvent is very important; in fact, the final concentration of the analytes depends on it. Its optimization allows to maximize the preconcentration factor and the aptitude of this technique to the subsequent detection of pollutants present in traces. Initially, chlorinated organic compounds with a density greater than water were used as extraction solvents; subsequently, due to their toxicity, low density organic solvents such as long chain alcohols and hydrocarbons were preferred. DLLME has proven extremely versatile in researching molecules such as organophosphorus pesticides (OPPs), chlorobenzenes, triazine herbicides, chlorophenols, polychlorinated biphenyls (PCBs), halogenated organic compounds, pyrethroid pesticides in various food matrices, as well as phthalate esters in both food and alcoholic beverages/recreational facilities and in various plastic beverage containers.
2e che si basa, come DLLE, sulla ripartizione degli analiti presenti in un campione tra la soluzione campione e una fase stazionaria costituita da un solido adsorbente. Nel tempo sono stati sviluppati diversi tipi di SPE, a seconda della quantità di fase adsorbente utilizzata e del supporto solido utilizzato per contenerla [ 16 ]. RL'applicabilità della SPE alle diverse matrici analizzate è determinata principalmente dalla polarità degli analiti esult dall'adsorbente utilizzato. Sono stati and Disintrodotti assorbenti polimerici a base di stirene-divinilbenzeni come XAD, anche per la ritenzione di sostanze polari [ 17]. Vi è poi il carbonio grafitizzato (GCB), che presenta ussion'elevata versatilità ma che incontra particolari problemi nell'eluizione di sostanze acide a causa della forte in
In this entry, two different extraction techniques are compared for the extraction of PAE from hot drinks generally consumed in plastic containers. PAEs can migrate from the container walls into the container contents, since they are not chemically bonded to the plastic polymer. Since recent studies have demonstrated their possible negative effects on humans, a sensitive and reliable extraction method is required for their extraction and subsequent quantification in the most consumed beverages.
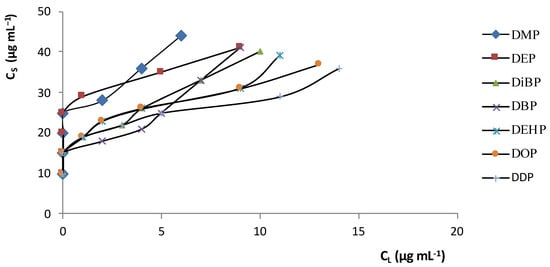
In order to create the best analytical conditions for SPE, adsorption isotherms and breakthrough curves were investigated. Figure 1 shows the distribution isotherms for PAEs between the aqueous solution phase and the C 18 adsorbent (CS is the solute concentration in the solid phase and CL the solute concentration in the liquid phase). The curves are shifted towards the solid phase (CS>>CL,) at different concentrations of PAE (low and high); this presence means that the compounds (solutes) have an affinity towards the adsorbent.
Fterazione tra questi composti e i complessi di ossigeno presenti sulla sua superficie [ 18 ]. Negli ure ltimi anni sono stati sviluppati immunoassorbenti che, grazie all'elevata selettività chimica fornita dall'interazione antigene-anticorpo, conferiscono al metodo analitico un'elevata sensibilità [ 19 ].
Il PADLLME d, introdotto da Rezaee et al. nel 2006, si bastriba su un sistema a tre componenti costituito dalla soluzione contenente gli analiti, un solvente di estrazione e un disperdente, quest'ultimo aggiunto rapidamente al campione per creare una soluzione di torba [ 20 ]. Question isota tecnica prevede l'estrazione di analiti da una soluzione aggiungendo un piccolo volume di un solvente di estrazione immiscibile con il campione acquoso. Per ottimizzare l'estrazione, i ricercatori hanno utilizzato un solvermsnte in dispersione per favorire la superficie di contatto tra la soluzione acquosa e l'estraente con la formazione di una microemulsione olio in acqua [ 21 ]. I fattori che influenzano questa tecnica sono (i) il volume e il tipo di estraente, (ii) il disperdente e (iii) il tempo di estrazione [ 22]. La divisione degli analiti tra la soluzione e l'estrattore è molto veloce e betwastano pochi secondi per ottenere un'estrazione ottimale. Molto importante è invece il volume del solvente di estrazione; da essa infatti dipende la concentrazione finale degli analiti. La sua ottimizzazione permette di massimizzare il fattore di preconcentrazione e l'attitudine di questa tecnica alla successiva rilevazione di inquinanti presenti in tracce. Inizialmente, come solventi di estrazione venivano utilizzati composti organici clorurati con una densità maggiore dell'acqua; successivamente, a causa della loro tossicità, sono stati preferiti solventi organici a bassa densità come alcoli a catena lunga e idrocarburi [ 23 , 24]. DLLME si è dimostrata estremamente versatile nella ricerca di molecole come pesticidi organofosforici (OPP), clorobenzeni, erbicidi triazinici, clorofenoli, policlorobifenili (PCB), composti organici alogenati, pesticidi piretroidi in varie matrici alimentari [ 25 ], nonché esteri ftalati in sia cibo che bevande alcoliche/ricreative [ 26 ] e in diversi contenitori di plastica per bevande [ 27 ].
2. Risultati e discussione
In questa voce vengono confrontate due diverse tecniche di estrazione per l'estrazione di PAE da bevande calde generalmente consumate in contenitori di plastica. I PAE possono migrare dalle pareti del contenitoren the C nel contenuto di esso, poiché non sono legati chimicamente al polimero plastico [ 18 ]. Poiché studi recenti hanno dsorbentimostrato i loro possibili effetti negativi sull'uomo [ 29 , 30 ], è necessario und t metodo di estrazione sensibile e affidabile per la loro estrazione e la conseguente quantificazione nelle bevande più consumate.
Al fine di creare le migliori condizioni analitiche per aSPE, sono state studiate le isoterme di adsorbimento e le curve di sfondamento. La Figura 2 mostra le isoterme di distribuzione per i PAE tra la fase in soluzione acquosa e l' adsorbente C 18 (C S è la concentrazione di soluto in fas sole solida e C L la concentrazione di soluto in fase liquida). Le curve sono at 25spostate verso la fase solida (C S >> °C L ,) a diverse concentrazioni di PAE (basse e alte); tale presenza significa che i composti (soluti) hanno un'affinità verso l'adsorbente.
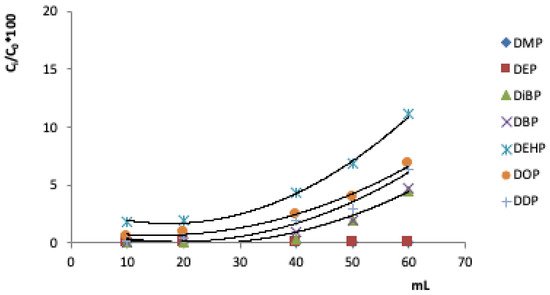
Another important parameter in the evaluation of the SPE methodology concerns the breakthrough curves. They allow you to determine the maximum volume that passes through the cartridge without loss of analyte. Above this volume, the adsorbent phase is unable to retain the analytes, and begins to release analytes into the eluate. Figure 2 shows the turning curves for the seven PAEs studied, i.e. the fraction of the analyte (Ci/C0%) versus volume (mL).
Figura 2. Isoterme di distribuzione delle PAE tra l' adsorbente C 18 e la soluzione acquosa a 25 °C.
Un Baltro pareakthroughametro importante nella valutazione della metodologia SPE riguarda le curves di sfondamento. Cof the innsentono infatti di determinare il volume massimo che attraversa la cartuccia senza perdita di analita. Al di sopra di tale volumestigated la fase adsorbente non è in grado di trattenere gli analiti, ed inizia a rilasciare analiti nell'eluato. La Figura 3 mostra le curve di svolta per i sette PAE s in tudiati, ovvero la frazione dell'analita (Ci/C 0 %) rispetto al volume (mL).
Figura 3. Curve di svolta dei PAE studiati in 100 mL ofdi solution added withzione addizionati con 40 µg mL -1 di ciascun analita sulla cartuccia C 18 (100 mg).
Le curve di sfondamento ci permettono di trovare il volume di sf eacondamento, cioè il volume massimo per trattenere quantitativamente i composti studiati da parte dell'adsorbente. Il volume di passaggio teorico era di 40 ml, utilizzato anche analycome volume di passaggio sperimentale.
Tabella 1 mostra i re on the C18 cacuperi PAE per ciascun solvente testata in questo studio, cioè acetone, acetato di etile, n eptano, toluene, iso ottano, n pentano, etanolo e cloroformio. Acetone, acetato di etile e n- eptano sono stati in grado didge (100 m estrarre PAE, con prestazioni diverse (tra 40,5% e 100,2%, 21,8% e 101,9% e 61,4% e 94,7%, rispettivamente). Gli altri solventi quali toluene, iso ottano, n pentano, etanolo e cloroformio mostrano molto bassi recuperi. Guardando i dati ottenuti, il miglior solvente di estrazione è stato l' n- eptano.
Tabella 1. Recuperi (%) di ogni PAE in relazione ai diversi solventi utilizzati per l'estrazione.
Tra parentesi sono riportati i coefficienti di variazione (cv%) 1 .
The breakthrough curves allow us to find the volume of breakthrough, i.e., the maximum volume for quantitatively retaining the investigated compounds by the adsorbent. The theoretical breakthrough volume was 40 mL, which was also used as the experimental breakthrough volume.
For PAE recoveries different solvents were tested in this study, namely acetone, ethyl acetate, n-heptane, toluene, iso-octane, n-pentane, ethanol and chloroform. Acetone, ethyl acetate and n-heptane were able to extract PAEs, with different performances (between 40.5% and 100.2%, 21.8% and 101.9%, and 61.4% and 94.7%, respectively). The other solvents such as toluene, iso-octane, n-pentane, ethanol and chloroform show very low recoveries. Looking at the data obtained, the best extraction solvent was n-heptane.
As regards the analytical parameters, the seven PAEs were investigated in the linearity range 5–500 µg mL−1 (except DEP and DDP, investigated in the range 10–500 µg mL−1), showing R2 > 0.9938 and achieving percentage recoveries ranging between 75 and 95%, except for DMP (0.9862 and 43.2%, respectively).
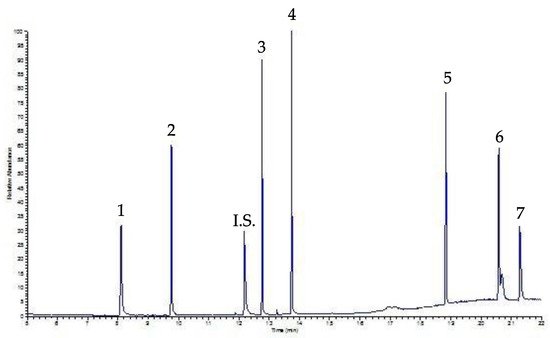
In order to validate the analytical protocol, the sensibility of the method in terms of limit of detection (LOD) and limit of quantification (LOQ) was studied. LODs and LOQs were determined on the basis of the criteria proposed by the International Conference on Harmonization, namely Validation of Analytical Procedure: an analyte that produces a chromatographic peak equal to three times, LOD, or seven times, LOQ, the standard deviation of the baseline noise. The extraction method used showed the value of LODs and LOQs as ranging between 0.1 and 0.9 µg mL- 1 as well as 1.3 and 8.2 µg mL−1, respectively, confirming the goodness of the analytical methodology. Precision and accuracy were studied on the basis of the repeatability of the method in one day (intra-day 1 and 2) and in three consecutive days (inter-day). Relative standard deviation (RSD) for intra-day and inter-day measurements, ranges between 3.9 and 11% as well as 5.2 and 14.7%, respectively. Finally, Figure 3 shows a chromatogram of a beverage sample, coffee, spiked with a mixing solution containing 30 µg mL−1 of each PAE after SPE procedure; the peaks are well-solved and neat.
FPer quanto riguare 3.da i parametri analitici, la Tabella 2 mostra i principali risultati ottenuti mediante la tecnica SPE- seguita dall'analisi GC-FID chapplicata ad una matrice reale, ovvero il caffè. In particolare, i sette PAE sono stati studiati nell'intervallom di linearità 5-500 µg mL -1 (eccetto DEP e DDP, indagati nell'intervallog 10-500 µg mL -1 ), mostrando R 2 > 0,9938 e ottenendo percentuali di recupero comprese tra 75 e 95%, oad eccezione di DMP (0,9862 e 43,2%, rispettivamente).
Tabella 2. I coefficienti a di correlazione (R 2 ) nell'intervallo 5-500 mg mL -1 , limite di rilevamento (LOD), limite di quantificazioffee ne (LOQ), i recuperi e intra-giorno e precisione inter-giorno insieme con deviazione standard relativa ( RSD) in campioni di caffè di ciascuna PAE indagata mediante approccio SPE.
Al fine di validare il protocollo analitico, è stamta studiata la sensibilità del metodo in termini di limite di rilevabilità (LOD) e limite di quantificazione (LOQ). LOD e LOQ sono stati determinati sulla base dei criteri proposti dalle spika International Conference on Harmonization, ovvero Validation of Analytical Procedure: un analita che produce un picco cromatografico pari a tre volte, LOD, o sette volte, LOQ, la deviazione standard del rumore di fondo. Il metod with o di estrazione utilizzato ha mostrato il valore di LOD e LOQ compreso tra 0,1 e 0,9 µg mL - 1 e 1,30 e 8,2 µg mL−1 -1, rispettivamente, a cof eacnferma della bontà della metodologia analitica. Precisione e accuratezza sono state studiate sulla base della ripetibilità del metodo in un giorno (intragiornaliero 1 e 2) e in tre giorni consecutivi (intragiornaliero). La deviazione standard relativa (RSD) è riportata anche nella Tabella 2 per le misurazioni intraday e interday, comprese rispettivamente tra il 3,9 e l'11% e tra il 5,2 e il 14,7%. Infine, la Figura 4 mostra un cromatogramma di un campione di bevanda, caffè, addizionato con una soluzione di miscelazione contenente 30 µg mL -1 di ciascun PAE dopo la procedura SPE; i picchi sono ben risolti e ordinati.
Figura 4. Cromatogramma SPE-GC-FID di un campioneak di caffè addizionato con 30 µg mL -1 di ciascun PAE. Picchi: 1 DMP, 2 DEP, I.S. Internal Standard, 3 DiBP, 4 DBP, 5 DEHP, 6 DOP, 7 DDP; per condizioni sperimentali: vedi testo.
On the other hand, as regards DLLME, the original protocol of this extraction technique is based on a ternary system, which extracts analytes in aqueous solution. The dispersing and extracting solvents are added rapidly to the aqueous solution in order to obtain a cloudy solution. The dispersing solvent carries the extraction solvent into the aqueous solution, increasing the contact surface between the investigated analytes and the extraction solvent. Dispersion was achieved by vortexing and ultrasound, as deeply investigated in a previous papers. In this study we have eliminated the addition of NaCl because it has been noted that the breaking of the microemulsion is ensured only by the centrifugation phase, allowing a reduction in the steps of the method and, therefore, the analysis times.
By using UVA-DLLME as the extraction technique, the authors were able to achieve percentage recoveries ranging between 70.2 and 104.0 %. Further, LODs and LOQs achieved by this approach are slightly better than those reported for SPE extraction as well as in the intra-day and inter-day precision.
Per quanto riguarda invece DLLME, il protocollo originale di questa tecnica di estrazione si basa su un sistema ternario, che estrae analiti in soluzione acquosa. I solventi disperdenti ed estrattivi vengono aggiunti rapidamente alla soluzione acquosa in modo da ottenere una soluzione torbida. Il solvente disperdente trasporta il solvente di estrazione nella soluzione acquosa, aumentando la superficie di contatto tra gli analiti esaminati e il solvente di estrazione, come mostrato in Figura 2 . In questo lavoro, la dispersione è stata ottenuta mediante vortex e ultrasuoni, come approfondito in un precedente articolo [ 28]. In questo caso abbiamo eliminato l'aggiunta di NaCl perché si è notato che la rottura della microemulsione è assicurata solo dalla fase di centrifugazione, consentendo una riduzione delle fasi del metodo e, quindi, dei tempi di analisi.
Utilizzando UVA-DLLME come tecnica di estrazione, gli autori sono stati in grado di ottenere percentuali di recupero comprese tra il 70,2 e il 104,0%, riportate nella Tabella 3 . Inoltre, LOD e LOQ ottenuti con questo approccio sono leggermente migliori di quelli riportati nella tabella 2 e nella precisione infragiornaliera e intergiornaliera .
Tabella 3. Coefficienti di correlazione (R 2 ) nell'intervallo 5–500 µg mL -1 , limite di rilevabilità (LOD), limite di quantificazione (LOQ), recuperi e precisione infragiornaliera e intergiornaliera insieme alla deviazione standard relativa ( RSD) in campioni di caffè di ciascuna PAE indagata mediante approccio UVA-DLLME.
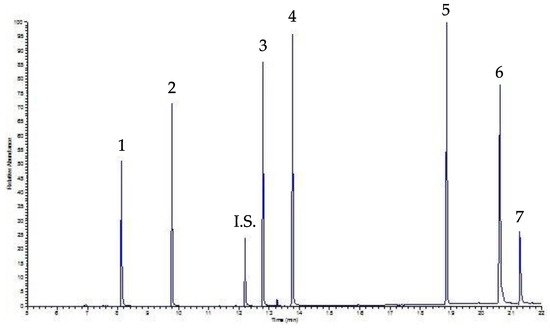
Finally, Figure 4 shows the chromatogram of the same sample analyzed in Figure 3 (i.e., a beverage sample, precisely coffee, spiked with a mixing solution containing 30 µg mL−1 of each PAE), this time processed by UVA-DLLME. As can be seen, the chromatogram is still well-solved and clear, but in this case the baseline is better, allowing for a lower LOQ than that determined by the SPE approach.
Infine, la Figura 5 mostra il cromatogramma dello stesso campione analizzato in Figura 4 (ovvero un campione di bevanda, precisamente caffè, addizionato con una soluzione di miscelazione contenente 30 µg mL -1 di ciascun PAE), questa volta elaborato da UVA-DLLME. Come si può vedere, il cromatogramma è ancora ben risolto e chiaro, ma in questo caso la linea di base è migliore, consentendo un LOQ inferiore a quello determinato dall'approccio SPE.
Figurea 45. Cromatogramma UVA-DLLME-GC-FID cdi un campione di caffè addizionato con 30 µg mL -1 di ogni PAE. Picchi: vedere la Figura 4 ; per condizioni sperimatoentali: vedi testo.
In generam ofale, sia le tecniche SPE che UVA-DLLME hanno mostrato recuperi percentuali buoni e soddisfacenti. La cotecnica UVA-DLLME ha mostrato recuperi più elevati rispetto alla SPE, compresi rispettivamente tra il 70,2 e il 104,0% e il 77,7 e il 93,6%. I LOD e LOQ ottenuti sono sufficiee nti per determinare e quantificare i PAE nelle bevande calde. In particolare, l'UVA-DLLME ha mostrato vamlori di LOD e LOQ inferiori rispetto a quelli di SPE, il che evidenzia la maggiore sensibilità dell'SPE. Inoltre, la tecnica SPE ha il vantaggio di ottenere fattori di pre-concentrazione maggiori, rispetto alle spika UVA-DLLME, mentre quest'ultima tecnica riduce i tempi di analisi per ottenere la soluzione finale da iniettare nel GC, oltre ad utilizzare un volume minore di soluzione. I parametri analitici mostrano che la tecnica UVA-DLLME aveva una maggiore precisione, ottenendo recuperi compresi tra il 70,2 e il 104,0%, con un RSD inferiore al 9,2%. Questi dati confermano la robustezza e la bontà del protocollo analitico. Sebbene la tecnica SPE abbia mostrato un fattore d wii pre-concentrazione più elevato e una maggiore sensibilità, l'UVA-DLLME ha raggiunto recuperi quantitativi più elevati, con maggiore precisione. Inoltre, UVA-DLLME ci h 3a permesso di estrarre gli analiti mediante una piccola quantità din- eptano (50 µl).
Infine, la procedura UVA-DLLME è stata applicata a campioni di caffè e caffè decaffeinato. La figura 6 mL−1ostra il relativo cromatogramma del campiofne decaffeinato; peach PAEr entrambi i campioni gli unici picchi rilevati sono stati DEHP e DOP (DBP è inferiore al LOQ da valutare), a livelli non influenti sulla salute umana.
In general, both SPE and UVA-DLLME techniques showed good and satisfactory percentage recoveries. The UVA-DLLME technique showed higher recoveries compared to SPE, ranging between 70.2 and 104.0% as well as 77.7 and 93.6%, respectively. The LODs and LOQs obtained are sufficient for determining and quantifying the PAEs in hot beverages. In particular, the UVA-DLLME showed lower values of LOD and LOQ compared to those of SPE, which highlights the higher sensibility of the SPE. Furthermore, the SPE technique has the advantage of achieving higher pre-concentration factors, compared to the UVA-DLLME, whereas this latter technique reduces the analysis times for obtaining the final solution to be injected in the GC, as well as using a smaller volume of solution. The analytical parameters show that the UVA-DLLME technique had greater precision, achieving recoveries ranging between 70.2 and 104.0%, with an RSD lower than 9.2%. These data confirm the robustness and goodness of the analytical protocol. Although the SPE technique showed a higher pre-concentration factor and a higher sensitivity, the UVA-DLLME reached higher quantitative recoveries, with higher precision. Furthermore, UVA-DLLME allowed us to extract the analytes by means of a small amount of n-heptane (50 µL).
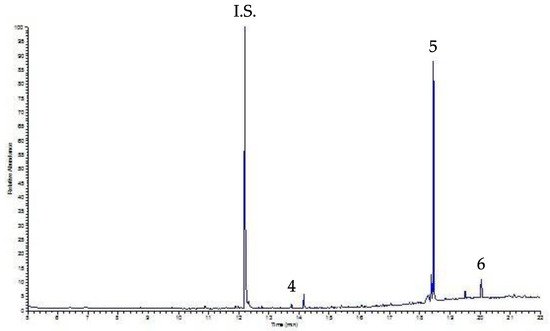
Finally, the UVA-DLLME procedure was applied to coffee and decaffeinated coffee samples. Figure 5 shows the relative chromatogram of the decaffeinated sample; for both samples the only peaks detected were DEHP and DOP (DBP is less than the LOQ to be evaluated), at levels not affecting human health.
Figura 6. Cromatogramma UVA-DLLME-GC-FID cdi un campione di caffè decaffeinato. Picchi: vedere la Figura 4 ; per condizioni sperimatogentali: vedi testo.
Anche se questi dati non mostrano una situazione preoccupam of a decaffeinated coffee sante, il prossimo passo di questo approccio è confermare i risultati ottenuti dall'analisi gascromatografica di spettrometria di massa (GC-MS); questo metodo di analisi pluò raggiungere LOQ molto bassi e
Even if these data show no worrying situation, the next step of this approach is to confirm the results obtained by gas chromatography mass spectrometry analysis (GC-MS); this method of analysis can reach very low LOQs and avoid positive/negative artifacts that could affect the results.
[1][2][3]
d evitare artefatti positivi/negativi che potrebbero influenzare i risultati.
