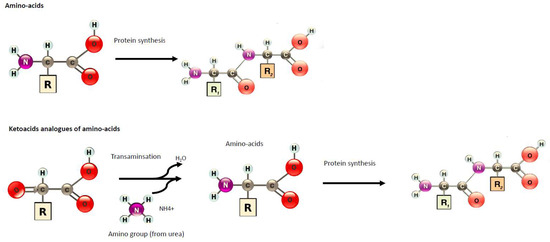
Diet is a key component of care during chronic kidney disease (CKD). In order to reduce the risk of nutritional disorders in very-low protein diets (VLDP), supplementation by nitrogen-free ketoacid analogues (KAs) have been proposed.
- chronic kidney disease
- low protein diet
- ketoacid analogues
- intestinal microbiota
- dialysis
1. Introduction
Component Name | mg/pill | ||||
|---|---|---|---|---|---|
Ca-Keto-dl-isoleucine | 67 |
Study | ||||||||||||||||||||||||||||||||||||||||||||||||||||||||||||||||||||
|---|---|---|---|---|---|---|---|---|---|---|---|---|---|---|---|---|---|---|---|---|---|---|---|---|---|---|---|---|---|---|---|---|---|---|---|---|---|---|---|---|---|---|---|---|---|---|---|---|---|---|---|---|---|---|---|---|---|---|---|---|---|---|---|---|---|---|---|---|
Study | Models | Diet Intervention | Design of Study | Follow-Up | Diet | Results (LPD vs. VLDP/LPD + KAs) | ||||||||||||||||||||||||||||||||||||||||||||||||||||||||||||||
Follow-Up | Results | Comments | ||||||||||||||||||||||||||||||||||||||||||||||||||||||||||||||||||
Wang et al., 2018 [8] | [7] |
|||||||||||||||||||||||||||||||||||||||||||||||||||||||||||||||||||
Milovanova et al., 2018 [3] | [2] | 5/6 nephrectomy rats | RCT | n = 42 in LPD + KA vs. LPD n = 37 | Non-diabetic CKD 3B–4 | NPD: 22% protein | vs. | LPD: 6% protein | vs. | LPD + KAs: 5% protein plus 1% KA | LPD (0.6 g/kg of body weight/day, comprising 0.3 g of vegetable protein and 0.3 g of animal protein, phosphorus content ≤ 800 mg/day and calories: 34–35 kcal/kg/day) vs. LPD + KA: 0.6 g/kg of body weight/day | 24 weeks | 14 months | ↓ muscle atrophy | ↑ activities of mitochondrial electron transport chain complexes and mitochondrial respiration, | ↓ muscle oxidative damage | ↑ eGFR (29.1 L/min/1.73 m ↑body weight | 2 vs. 26.6) | ↓SBP | ↑BMI and muscle body mass | NO change in albumin levels | No change in lipids parameters | ↓ phosphate, FGF23, and PTH levels ↑Klotho levels and phosphate binder uses | ↑bicarbonates levels | ||||||||||||||||||||||||||||||||||||||||||||
Ca-Ketoeucine | ||||||||||||||||||||||||||||||||||||||||||||||||||||||||||||||||||||
Similar protein intake in both group | Long follow up | Liu et al., 2018 [9] | [8] | 101 | ||||||||||||||||||||||||||||||||||||||||||||||||||||||||||||||||
Di Iorio et al., 2018 [20] | [19] | KKAy mice, an early type 2 DN model | RCT, crossover trial | CKD stages 3B–4 | Group A1: 3 months of FD, 6 months of VLPD + KA, 3 months of FD and 6 months of MD | Group B: 3 months of FD, 6 months of MD, 3 months of FD and 6 months of VLPD + KA. | n = 30 in each group | NPD: 22% protein | vs. | LPD: 6% protein | vs. | LPD + KAs: 5% protein plus 1% KA | 12 weeks | ↓ proteinuria |
FD: proteins 1 g/kg body weight (bw)/day (animal proteins 50–70 g/day, vegetal proteins 15–20 g/day), energy 30–35 kcal/bw/day, calcium (Ca) 1.1–1.3 g/day, phosphorus (P) 1.2–1.5 g/day, sodium (Na) 6 g/day and potassium (K) 2–4 g/day. | MD: proteins 0.7–0.8 g/kg bw/day (animal proteins 30–40 g/day, vegetal proteins 40–50 g/day), energy 30–35 kcal/bw/day, Ca 1.1–1.3 g/day, P 1.2–1.5 g/day, Na 2.5–3 g/day and K 2–4 g/day. | VLPD + KA: proteins 0.3–0.5 g/kg bw/day (animal proteins 0 g/day, vegetal proteins 30–40 g/day), energy 30–35 kcal/bw/day, Ca 1.1–1.3 g/day, P 0.6–0.8 g/day, Na 6 g/day, K 2–4 g/day plus a mixture of KA | ↓ mesangial proliferation and oxidative stress |
6 months | ↑ serum albumin and body weight | No difference in creatinine and GFR | ↓ SBP | No change in creatinuria | ↓proteinuria | ↓ phosphate, FGF23, and PTH levels | ↑bicarbonates levels | ↑Hg levels | ↓protein carbamylation | Sodium intake and phosphore intake was reduce in VLDP + KA group | Ca-Ketophénylalanine | 10] | [9] | ||||||||||||||||||||||||||||||||||||
Garneata et al., 2016 [21] | 68 | |||||||||||||||||||||||||||||||||||||||||||||||||||||||||||||||||||
[20] | 3/4 nephrectomy rats | RCT | CKD stage 4–5, | proteinuria < 1 g/24 h | n = 207 | NPD: 18% protein | vs. | LPD: 6% protein | vs. | LPD + KAs: 5% protein plus 1% KA | 12 weeks | LPD = 0.6 g protein/kg per day | vs. | VLPD + KA = vegetarian diet, 0.3 g protein/kg per day + KA | 15 months | ↓ proteinuria | ↓ intrarenal RAS activation. | ↓ transforming growth factor-β1 in the mesangial cells | ↓ RRT initiation or a >50% reduction in the initial GFR (13% in KA+LDP vs. 42% in LPD reached the primary composite efficacy point i.e., RRT initiation or a >50% reduction in the initial GFR) | ↓CRP | ↑bicarbonates levels | ↓uric acid | ↓ phosphate, FGF23 and PTH levels and phosphate binder uses | No difference in proteinuria | No difference of death and CV events | No difference of albumin, BMI | No change in lipids parameters |
Ca-Ketovaline | 86 | |||||||||||||||||||||||||||||||||||||||
Zhang et al., 2016 [ |
||||||||||||||||||||||||||||||||||||||||||||||||||||||||||||||||||||
Long follow up | Large effective | Only 14% of patients screened was included | Zhang et al., 2015 [11] | [10] |
||||||||||||||||||||||||||||||||||||||||||||||||||||||||||||||||
Di Iorio et al., 2012 [22] | [21] | 5/6 nephrectomy rats | RCT, crossover trial | eGFR < 55 and > 20 mL/min/1.73 m 2 | Group A: VLDP + KA during the first week and LPD during the second week | Group B: LPD during the first week and a VLPD + KA during the second week. | n = 16 in each group | NPD: 11 g/kg/day protein | vs. | LPD: 3 g/kg/day protein | vs. | LPD + KAs: 3 g/kg/day protein which including 5% protein plus 1% KA | LPD = 0.6 g protein/kg per day | 24 weeks | vs. VLPD + KA = 0.3 g protein/kg per day + KA | ↑ body weight, gastrocnemius muscle mass | ↓ autophagy marker in muscle | No difference of inflammation markers | 1 week | ↓ phosphate (−12%), FGF23 (−33.5) | No change on calcium | a post hoc of this study, ↓ indoxyl sulfate [ 23] | [ ] | ↑bicarbonates levels | Short exposition | Ca-Hydroxy-dl-methionine | ||||||||||||||||||||||||||||||||||||||||||
Wang et al., 2014 [12] | [11] | |||||||||||||||||||||||||||||||||||||||||||||||||||||||||||||||||||
Di Iorio et al., 2009 [24 | 59 | |||||||||||||||||||||||||||||||||||||||||||||||||||||||||||||||||||
] | [23] | 5/6 nephrectomy rats | RCT, crossover trial | eGFR < 55 and > 20 mL/min | Group A: VLDP + KA during 6 month and a LPD during 6 month | Group B: LPD during 6 month and a VLDP + KA during 6 month. | n = 16 in each group 32 patients | NPD: 22% protein | vs. | LPD: 6% protein | vs. | LPD + KAs: 5% protein plus 1% KA | LPD = 0.6 g protein/kg per day | vs. | VLPD + KA = 0.3 g protein/kg per day + KA | 24 weeks | 6 months | ↑improved protein synthesis and increased related mediators such as phosphorylated Akt in the muscle | ↓ protein degradation and proteasome activity in the muscle | ↓proteinuria and AGE | Open label | Phosphor intake was different and lower in VLDP+ KA | l-Lysine monoacetate | 105 | ||||||||||||||||||||||||||||||||||||||||||||
Gao et al., 2010 [13] | [12] |
|||||||||||||||||||||||||||||||||||||||||||||||||||||||||||||||||||
Menon et al., 2009 [25] | [24] | 5/6 Nephrectomy rats | Post hoc study of MDRD study B | NPD: 22% protein | vs. | LPD: 6% protein | vs. | LPD + KAs: 5% protein plus 1% KA | CKD stage 4 nondiabetic | n = 255 | LPD = 0.6 g protein/kg per day | vs. | VLPD + KA = 0.3 g protein/kg per day + KA | 24 weeks | 10.2 years | ↓ proteinuria, glomerular sclerosis, and tubulointerstitial fibrosis | ↑renal function | ↑ body weight and albumin | ↓ lipid and protein oxidative products | No delay progression to kidney failure | ↑the risk of death. | Long follow up without intervention -Observance and protein intake was not monitored during the follow up | l-Threonine | |||||||||||||||||||||||||||||||||||||||||||||
Gao et al., 2011 [14] | [13] | 53 | ||||||||||||||||||||||||||||||||||||||||||||||||||||||||||||||||||
5/6 Nephrectomy rats | ||||||||||||||||||||||||||||||||||||||||||||||||||||||||||||||||||||
Teplan et al., 2008 [4] | [3] |
RCT, double-blind placebo | CKD stage 4 | n = 111 | NPD: 22% protein | vs. | LPD: 6% protein | vs. | LPD + KAs: 5% protein plus 1% KA | LDP: 0.6 g protein/kg per day | vs. | LPD + KA: 0.6 g protein/kg per day + KA | 6 months | 36 months | ↑ body weight and albumin | ↓ADMA ↑ Kruppel-like factor-15, a transcription factor shown to reduce fibrosis | ↓ BMI and visceral body fat in obese patients | ↓proteinuria | l-Tryptophan | |||||||||||||||||||||||||||||||||||||||||||||||||
↓ glycated hemoglobin | ↓LDL-cholesterol | Mean BMI was > 30 kg/m2 at the inclusion | Long follow up | No difference of protein intake | Using a placebo | Maniar et al., 1992 [15] | [14] | 23 | ||||||||||||||||||||||||||||||||||||||||||||||||||||||||||||
Mircescu et al., 2007 [26] | [25] | 5/6 Nephrectomy rats | RCT | eGFR <30 mL/min/1.73 m 2, nondiabetic | n = 53 | NPD: 16% casein | vs. | LPD + EAA: 6% casein + EAA | vs. | LPD + KAs: 6% casein + KA | VLPD + KA =0.3 g/kg vegetable proteins + KA | 3 months | vs. | LPD =0.6 g/kg/d) | No difference on body weight | No difference on proteinuria vs. LDP + EAA but reduction vs. NPD | 48 weeks | ↓ creatinemia, proteinuria, glomerular sclerosis, and tubulointerstitial fibrosis vs. NPD but no difference vs. LPD + EAA | ↑survival vs. NPD but no difference vs. LPD + EAA | ↑bicarbonates levels | ↑calcium levels and ↓ phosphate | lower percentages of patients in group I required renal replacement therapy initiation (4% vs. 27%). | No change of rate of eGFR and proteinuria |
l-Histidine | 38 | |||||||||||||||||||||||||||||||||||||||||||
No change in SBP | Open label | Laouari et al., 1991 [16] | [15] |
|||||||||||||||||||||||||||||||||||||||||||||||||||||||||||||||||
Gennari et al., 2006 [27] | [26] | 5/6 Nephrectomy rats | Post hoc study of MDRD study | NPD: 12% casein |
l-Tyrosine | 30 |
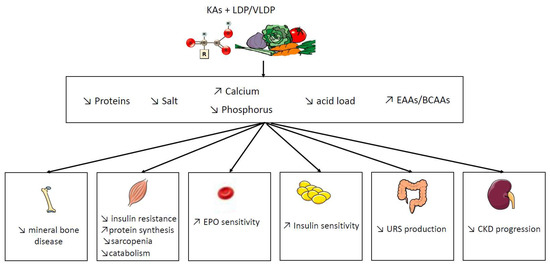
2. Potential Benefit of Ketoacid Analogues
RCT | |||||||||||||||||||||||||||||||||||
CKD stage 4–5 | |||||||||||||||||||||||||||||||||||
n | |||||||||||||||||||||||||||||||||||
= 255 | |||||||||||||||||||||||||||||||||||
vs. | |||||||||||||||||||||||||||||||||||
LPD + EAAs: 5% casein + EAA | vs. | LPD + KAs: 5% casein + KA | LPD = 0.6 g protein/kg per day | vs. | VLPD + KA = 0.3 g protein/kg per day + KA | 2,2 years | ↓Appetite and growth | No increase in BCAAs | |||||||||||||||||||||||||||
No significant effect of diet on serum total CO2 was seen | Benjelloun et al., 1993 [17] | [16] |
|||||||||||||||||||||||||||||||||
Menon et al., 2005 [28] | [27] | Rats with after a single 5 mg/kg intravenous injection of Adriamycin: a model of induces glomerular damage in glomerulonephritis. | Post oc study of MDRD study | RCT | NPD: 21% protein | vs. | LPD + KAs: 6% protein plus KA | 15 days | ↓ proteinuria | ↓ glycosaminoglycan excretion and glomerular glycosaminoglycan contents | |||||||||||||||||||||||||
CKD stage 4–5 | n = 255 | LPD = 0.6 g protein/kg per day | vs. | VLPD + KA = 0.3 g protein/kg per day + KA | 2.2 years | ↓ homocysteinemia by 24% at 1 year | Barsotti et al; 1988 [18] | [17] |
] | 5/6 Nephrectomy rats | |||||||||||||||||||||||||
Feiten et al., 2005 [29] |
RCT | n = 24 | eGFR <25 mL/min | NPD: 20.5% protein | vs. | LPD + KAs: 3.3% protein plus 7.5% KA | 3 months | VLPD + KA = 0.3 g/kg vegetable proteins + KA | vs. | LPD = 0.6 g/kg/d | ↑survival |
4 months | ↑ GFR | ↓ proteinuria and histological damage of kidney | No difference in body weight and albuminuria | ||||||||||||||||||||
[28 |
↑bicarbonates levels | No change on calcium levels | ↓ phosphate and PTH | Decrease the progression of renal decline function of rate of eGFR | No change in lipid parameters | No change in nutritional status (BMI, albumin) | Open label |
Meisinger et al., 1987 [19] | [18] |
5/6 Nephrectomy rats | LPD: 8% protein | vs. | LPD + KAs: 8% protein plus KA | 3 months | ↓ proteinuria |
Short time of follow up | |||||||||||||||||||||||||||||||||||||||
Significant reduction in dietary phosphorus (529 ± 109 to 373 ± 125 mg/day, | |||||||||||||||||||||||||||||||||||||||
p | |||||||||||||||||||||||||||||||||||||||
< 0.05) | |||||||||||||||||||||||||||||||||||||||
Prakash et al., 2004 | |||||||||||||||||||||||||||||||||||||||
[ | |||||||||||||||||||||||||||||||||||||||
30] | [29] |
RCT, double-blind placebo | eGFR:28 mL/min/1.73 m 2 | n = 34 | LPD = 0.6 g protein/kg per day + placebo | vs. | VLPD = 0.3 g protein/kg per day + KA | 9 months | preserve mGFR (−2% in LDP + KA vs. −21% in LPD) | No effect on proteinuria | No effect of BMI and albumin | Measure of GFR with 99mTc-DTPA | The placebo is problematic because protein intake was different between both groups. | ||||||||||||||||||||||||||
Teplan et al., 2003 [5] | [4] |
RCT | eGFR: 22–36 mL/min/1.73 m 2 | n = 186 | LPD 0.6 g protein/kg per day + rhuEPO + KA | vs. LPD: 0.6 g protein/kg per day + rhuEPO | vs. LPD: 0.6 g protein/kg per day | 3 years | Slower progression of CKD | ↓proteinuria | ↓LDL-cholesterol | No change in SBP | ↑albumin | ↑ plasmatic leucine levels | Role of rhuEPO unclear | Insulin clearance | |||||||||||||||||||||||
Di Iorio et al., 2003 [31] | [30] |
RCT | eGFR: < or =25 mL/min/1.73 m 2 | n = 10 in each group | LPD = 0.6 g protein/kg per day | vs. | VLPD = 0.3 g protein/kg per day + KA | 2 years | No difference on hemoglobin | ↓ EPO dose | ↓ phosphate and PTH | No change in BMI and albumin | No difference in the rate of RRT initiation (8 vs. 7) | Slower rate of GFR decline (creatinine clearance) | ↓SBP and 24 h NA excretion | ↓LDL-cholesterol | Very few populations | ||||||||||||||||||||||
Bernhard et al., 2001 [6] | [5] |
RCT | CKD stage 4–5 | n = 6 in each group | LPD = 0.6 g protein/kg per day | vs. | LPD + KA = 0.6 g protein/kg per day + KA | 3 months | No difference could be attributed to the ketoanalogs total body flux and leucine oxidation | No difference on phosphorus, calcium levels | No difference on BMI and albumin | No difference in renal function and proteinuria | No difference on bicarbonatemia | KA is metabolically safe | Short follow-up | Small effective | |||||||||||||||||||||||
Malvy et al., 1999 [32] | [31] |
RCT | eGFR<20 mL/min/1.73 m 2 | n = 50 | LPD:LPD = 0.65 g protein/kg per day + Ca+ | vs. | VLPD + KA = 0.3 g protein/kg per day + KA | 3 months or time to eGFR < 5 mL/min/1.73 m2 or RRT | No difference on GFR progression | ↑calcium levels | ↓ phosphate and PTH | No difference on lipid parameters | |||||||||||||||||||||||||||
Kopple et al., 1997 [33] | [32] |
Post hoc study of MDRD study | RCT | CKD stage 4–5 | n = 255 | LPD = 0.6 g protein/kg per day | vs. | VLPD + KA = 0.3 g protein/kg per day + KA | 2,2 years | No difference of death and first hospitalization | ↑ albumin | ↓ transferrin, body wt, percent body fat, arm muscle area, and urine creatinine excretion | No correlation between nutritional parameters and death or hospitalization | ↓ energy intake | |||||||||||||||||||||||||
Levey et al., 1996 [34] | [33] |
Post hoc study of MDRD study | RCT | CKD stage 4–5 | n = 255 | LPD = 0.6 g protein/kg per day | vs. | VLPD + KA = 0.3 g protein/kg per day + KA | 2.2 years | A 0.2 g/kg/d lower achieved total protein intake was associated with a 1.15 mL/min/yr slower mean decline in GFR (p = 0.011), which is equivalent to 29% of the mean GFR decline | Reanalyze of MDRD study by using correlations of protein intake with a rate of decline in GFR and time to renal failure | ||||||||||||||||||||||||||||
Klahr et al., 1994 Study 2 [35] | [34] |
RCT | CKD stage 4–5 | n = 255 | LPD = 0.6 g protein/kg per day | vs. | VLPD + KA = 0.3 g protein/kg per day + KA | 27 months | Marginally slower eGFR decline (−19% in LPD vs. 12% in VLDP + KA, p 0.067) | No significant interactions between blood-pressure interventions and the rate of decline in eGFR | No difference on albumin | No difference in proteinuria | -Large RCT study | -Good adherence of diet | -Measured GFR with iothalamate | ||||||||||||||||||||||||
Coggins et al. 1994 [36] | [35] |
Feasibility phase of the MDRD Study | eGFR: 8 to 56 mL/min/1.73 m 2 | n = 96 | 25 participants were excluded | LPD = 0.6 g protein/kg per day | vs. | VLPD + KA = 0.3 g protein/kg per day + KA | 6 months | No difference on lipid parameters | Pilot study | ||||||||||||||||||||||||||||
Lindenau et al. 1990 [37] | [36] |
RCT | eGFR<15 mL/min/1.73 m 2 | n = 40 | LPD = 0.6 g protein/kg per day + Ca+ vs. VLPD + KA = 0.4 g protein/kg per day + KA | 12 months | Improvement in osteo-fibrotic as well as in osteo-malacic changes | A calcium supplementation was given in LPD diet as a control for KA | |||||||||||||||||||||||||||||||
Jungers et al. 1987 [38] | [37] |
RCT | CKD stage 5 | n = 19 | LPD = 0.6 g protein/kg per day + Ca+ vs. VLPD + KA = 0.4 g protein/kg per day + KA | 12 months | No difference on biochemical or morphometric sign of de-nutrition | ↑mean renal survival duration until dialysis | Small and effective | ||||||||||||||||||||||||||||||
Hecking et al., 1982 [7] | [6] |
RCT | Mean eGFR: 10.8 mL/min/1.73 m 2 | n = 15 | LPD = 0.6 g protein/kg per day + Ca+ vs. LPD + KA = 0.6 g protein/kg per day + KA or EAA or placebo | 3 weeks per periods | ↓ phosphate | No difference on GFR and proteinuria | No difference on lipids parameters | No difference on albumin | Small and effective | versus the placebo |
FD: Free diet. P: phosphorus. MDRD: Modification of Diet in the Renal Disease Study. eGFR: estimated Glomerular Filtration Rate. RRT: renal replacement therapy. FGF23: Fibroblast Growth Factor 23. LPD: Low protein diet. VLDP: Very low protein diet. KA: Keto-analogues. RCT: randomized controlled trial. EAA: essential amino acids; PTH: parathyroid hormone.
References
- Brenner, B.M.; Meyer, T.W.; Hostetter, T.H. Dietary protein intake and the progressive nature of kidney disease: The role of hemodynamically mediated glomerular injury in the pathogenesis of progressive glomerular sclerosis in aging, renal ablation, and intrinsic renal disease. N. Engl. J. Med. 1982, 307, 652–659.
- Milovanova, L.; Fomin, V.; Moiseev, S.; Taranova, M.; Milovanov, Y.; Lysenko Kozlovskaya, L.; Kozlov, V.; Kozevnikova, E.; Milovanova, S.; Lebedeva, M.; et al. Effect of essential amino acid кetoanalogues and protein restriction diet on morphogenetic proteins (FGF-23 and Klotho) in 3b-4 stages chronic кidney disease patients: A randomized pilot study. Clin. Exp. Nephrol. 2018, 22, 1351–1359.
- Teplan, V.; Schück, O.; Racek, J.; Mareckova, O.; Stollova, M.; Hanzal, V.; Malý, J. Reduction of plasma asymmetric dimethylarginine in obese patients with chronic kidney disease after three years of a low-protein diet supplemented with keto-amino acids: A randomized controlled trial. Wien. Klin. Wochenschr. 2008, 120, 478–485.
- Teplan, V.; Schück, O.; Knotek, A.; Hajný, J.; Horácková, M.; Kvapil, M. Czech multicenter study Enhanced metabolic effect of erythropoietin and keto acids in CRF patients on low-protein diet: Czech multicenter study. Am. J. Kidney Dis. 2003, 41, S26–S30.
- Bernhard, J.; Beaufrère, B.; Laville, M.; Fouque, D. Adaptive response to a low-protein diet in predialysis chronic renal failure patients. J. Am. Soc. Nephrol. 2001, 12, 1249–1254.
- Hecking, E.; Andrzejewski, L.; Prellwitz, W.; Opferkuch, W.; Müller, D.; Port, F.K. A controlled study of supplementation with essential amino acids and alpha-keto acids in the conservative management of patients with chronic renal failure. Z. Ernahrungswiss. 1982, 21, 299–311.
- Wang, D.; Wei, L.; Yang, Y.; Liu, H. Dietary supplementation with ketoacids protects against CKD-induced oxidative damage and mitochondrial dysfunction in skeletal muscle of 5/6 nephrectomised rats. Skelet Muscle 2018, 8, 18.
- Liu, D.; Wu, M.; Li, L.; Gao, X.; Yang, B.; Mei, S.; Fu, L.; Mei, C. Low-protein diet supplemented with ketoacids delays the progression of diabetic nephropathy by inhibiting oxidative stress in the KKAy mice model. Br. J. Nutr. 2018, 119, 22–29.
- Zhang, J.-Y.; Yin, Y.; Ni, L.; Long, Q.; You, L.; Zhang, Q.; Lin, S.-Y.; Chen, J. Low-protein diet supplemented with ketoacids ameliorates proteinuria in 3/4 nephrectomised rats by directly inhibiting the intrarenal renin-angiotensin system. Br. J. Nutr. 2016, 116, 1491–1501.
- Zhang, Y.; Huang, J.; Yang, M.; Gu, L.; Ji, J.; Wang, L.; Yuan, W. Effect of a low-protein diet supplemented with keto-acids on autophagy and inflammation in 5/6 nephrectomized rats. Biosci. Rep. 2015, 35, e00263.
- Wang, D.-T.; Lu, L.; Shi, Y.; Geng, Z.-B.; Yin, Y.; Wang, M.; Wei, L.-B. Supplementation of ketoacids contributes to the up-regulation of the Wnt7a/Akt/p70S6K pathway and the down-regulation of apoptotic and ubiquitin-proteasome systems in the muscle of 5/6 nephrectomised rats. Br. J. Nutr. 2014, 111, 1536–1548.
- Gao, X.; Wu, J.; Dong, Z.; Hua, C.; Hu, H.; Mei, C. A low-protein diet supplemented with ketoacids plays a more protective role against oxidative stress of rat kidney tissue with 5/6 nephrectomy than a low-protein diet alone. Br. J. Nutr. 2010, 103, 608–616.
- Gao, X.; Huang, L.; Grosjean, F.; Esposito, V.; Wu, J.; Fu, L.; Hu, H.; Tan, J.; He, C.; Gray, S.; et al. Low-protein diet supplemented with ketoacids reduces the severity of renal disease in 5/6 nephrectomized rats: A role for KLF15. Kidney Int. 2011, 79, 987.
- Maniar, S.; Beaufils, H.; Laouari, D.; Forget, D.; Kleinknecht, C. Supplemented low-protein diets protect the rat kidney without causing undernutrition. J. Lab. Clin. Med. 1992, 120, 851–860.
- Laouari, D.; Jean, G.; Kleinknecht, C.; Broyer, M. Growth, free plasma and muscle amino-acids in uraemic rats fed various low-protein diets. Pediatr. Nephrol. 1991, 5, 318–322.
- Benjelloun, A.S.; Merville, P.; Cambar, J.; Aparicio, M. Effects of a low-protein diet on urinary glycosaminoglycan excretion in adriamycin-treated rats. Nephron 1993, 64, 242–248.
- Barsotti, G.; Moriconi, L.; Cupisti, A.; Dani, L.; Ciardella, F.; Lupetti, S.; Giovannetti, S. Protection of renal function and of nutritional status in uremic rats by means of a low-protein, low-phosphorus supplemented diet. Nephron 1988, 49, 197–202.
- Meisinger, E.; Gretz, N.; Strauch, M. Hyperfiltration due to amino and keto acid supplements of low-protein diets: Influence on proteinuria. Infus. Klin Ernahr 1987, 14 (Suppl. 5), 26–29.
- Di Iorio, B.R.; Marzocco, S.; Bellasi, A.; De Simone, E.; Dal Piaz, F.; Rocchetti, M.T.; Cosola, C.; Di Micco, L.; Gesualdo, L. Nutritional therapy reduces protein carbamylation through urea lowering in chronic kidney disease. Nephrol. Dial. Transplant. 2018, 33, 804–813.
- Garneata, L.; Stancu, A.; Dragomir, D.; Stefan, G.; Mircescu, G. Ketoanalogue-Supplemented Vegetarian Very Low-Protein Diet and CKD Progression. J. Am. Soc. Nephrol. 2016, 27, 2164–2176.
- Di Iorio, B.; Di Micco, L.; Torraca, S.; Sirico, M.L.; Russo, L.; Pota, A.; Mirenghi, F.; Russo, D. Acute effects of very-low-protein diet on FGF23 levels: A randomized study. Clin. J. Am. Soc. Nephrol. 2012, 7, 581–587.
- Marzocco, S.; Dal Piaz, F.; Di Micco, L.; Torraca, S.; Sirico, M.L.; Tartaglia, D.; Autore, G.; Di Iorio, B. Very low protein diet reduces indoxyl sulfate levels in chronic kidney disease. Blood Purif. 2013, 35, 196–201.
- Di Iorio, B.R.; Cucciniello, E.; Martino, R.; Frallicciardi, A.; Tortoriello, R.; Struzziero, G. Acute and persistent antiproteinuric effect of a low-protein diet in chronic kidney disease. G Ital. Nefrol 2009, 26, 608–615.
- Menon, V.; Kopple, J.D.; Wang, X.; Beck, G.J.; Collins, A.J.; Kusek, J.W.; Greene, T.; Levey, A.S.; Sarnak, M.J. Effect of a very low-protein diet on outcomes: Long-term follow-up of the Modification of Diet in Renal Disease (MDRD) Study. Am. J. Kidney Dis. 2009, 53, 208–217.
- Mircescu, G.; Gârneaţă, L.; Stancu, S.H.; Căpuşă, C. Effects of a supplemented hypoproteic diet in chronic kidney disease. J. Ren. Nutr. 2007, 17, 179–188.
- Gennari, F.J.; Hood, V.L.; Greene, T.; Wang, X.; Levey, A.S. Effect of dietary protein intake on serum total CO2 concentration in chronic kidney disease: Modification of Diet in Renal Disease study findings. Clin. J. Am. Soc. Nephrol. 2006, 1, 52–57.
- Menon, V.; Wang, X.; Greene, T.; Beck, G.J.; Kusek, J.W.; Selhub, J.; Levey, A.S.; Sarnak, M.J. Homocysteine in chronic kidney disease: Effect of low protein diet and repletion with B vitamins. Kidney Int. 2005, 67, 1539–1546.
- Feiten, S.F.; Draibe, S.A.; Watanabe, R.; Duenhas, M.R.; Baxmann, A.C.; Nerbass, F.B.; Cuppari, L. Short-term effects of a very-low-protein diet supplemented with ketoacids in nondialyzed chronic kidney disease patients. Eur. J. Clin. Nutr. 2005, 59, 129–136.
- Prakash, S.; Pande, D.P.; Sharma, S.; Sharma, D.; Bal, C.S.; Kulkarni, H. Randomized, double-blind, placebo-controlled trial to evaluate efficacy of ketodiet in predialytic chronic renal failure. J. Ren. Nutr. 2004, 14, 89–96.
- Di Iorio, B.R.; Minutolo, R.; De Nicola, L.; Bellizzi, V.; Catapano, F.; Iodice, C.; Rubino, R.; Conte, G. Supplemented very low protein diet ameliorates responsiveness to erythropoietin in chronic renal failure. Kidney Int. 2003, 64, 1822–1828.
- Malvy, D.; Maingourd, C.; Pengloan, J.; Bagros, P.; Nivet, H. Effects of severe protein restriction with ketoanalogues in advanced renal failure. J. Am. Coll. Nutr. 1999, 18, 481–486.
- Kopple, J.D.; Levey, A.S.; Greene, T.; Chumlea, W.C.; Gassman, J.J.; Hollinger, D.L.; Maroni, B.J.; Merrill, D.; Scherch, L.K.; Schulman, G.; et al. Effect of dietary protein restriction on nutritional status in the Modification of Diet in Renal Disease Study. Kidney Int. 1997, 52, 778–791.
- Levey, A.S.; Adler, S.; Caggiula, A.W.; England, B.K.; Greene, T.; Hunsicker, L.G.; Kusek, J.W.; Rogers, N.L.; Teschan, P.E. Effects of dietary protein restriction on the progression of advanced renal disease in the Modification of Diet in Renal Disease Study. Am. J. Kidney Dis. 1996, 27, 652–663.
- Klahr, S.; Levey, A.S.; Beck, G.J.; Caggiula, A.W.; Hunsicker, L.; Kusek, J.W.; Striker, G. The effects of dietary protein restriction and blood-pressure control on the progression of chronic renal disease. Modification of Diet in Renal Disease Study Group. N. Engl. J. Med. 1994, 330, 877–884.
- Coggins, C.H.; Dwyer, J.T.; Greene, T.; Petot, G.; Snetselaar, L.G.; Van Lente, F. Serum lipid changes associated with modified protein diets: Results from the feasibility phase of the Modification of Diet in Renal Disease Study. Am. J. Kidney Dis. 1994, 23, 514–523.
- Lindenau, K.; Abendroth, K.; Kokot, F.; Vetter, K.; Rehse, C.; Fröhling, P.T. Therapeutic effect of keto acids on renal osteodystrophy. A prospective controlled study. Nephron 1990, 55, 133–135.
- Jungers, P.; Chauveau, P.; Ployard, F.; Lebkiri, B.; Ciancioni, C.; Man, N.K. Comparison of ketoacids and low protein diet on advanced chronic renal failure progression. Kidney Int. Suppl. 1987, 22, S67–S71.