Your browser does not fully support modern features. Please upgrade for a smoother experience.
Please note this is a comparison between Version 1 by Thomas Birngruber and Version 2 by Rita Xu.
In burn injuries, risk factors and limitations to treatment success are difficult to assess clinically. However, local cellular responses are characterized by specific gene-expression patterns. MicroRNAs (miRNAs) are single-stranded, non-coding RNAs that regulate mRNA expression on a posttranscriptional level.
- burn
- skin
- miRNAs
- biomarkers
- gene regulation
- extracellular vesicles
1. Introduction
Burns are complex injuries with a multitude of local and systemic changes that are aggravated in severe and large lesions caused by full-thickness burns. Several local responses have already been described to be triggered by a severe burn injury [1][2][3][1,2,3], but the determinants of why and when a burn injury is causing the transition from a local to a systemic response are still widely unknown [4]. As a local response, immediately after the burn, the transcription activator nuclear factor-κB (NF-κB) is activated to regulate further inflammatory mediators. In the following pro-inflammatory phase [3], macrophages release mediators, such as interleukin-6 (IL-6), tumor necrosis factor alpha (TNF-α), prostaglandins and reactive nitrogen species [1]. Pro-inflammatory cytokines are released and accompanied by the formation of reactive oxygen species (ROS), and increased apoptosis is, in part, triggered by TNF-α [2]. The systemic responses to severe burns affect almost every organ system and are referred to as hypermetabolic response. The exact cause of this effect is still unclear, but an increased and prolonged expression of glucocorticoids, glucagon, catecholamines and dopamine, together with increased levels of cytokines, ROS, nitric oxide and several other mediators after a burn injury, lead to the hypermetabolic state in the patient that can last for years [5]. The first 48 h of the systemic response to a severe burn are characterized by a decrease in metabolism, cardiac output and oxygen consumption [6]. Surgical treatment of burn injuries in the early phase within the first 24 h after the burn has shown to improve patients’ prognosis in terms of inflammatory and hypermetabolic response [7]. However, the mere clinical assessment regarding depth and severity of such wounds is often imprecise and underestimated [8] and does not allow a prediction of the systemic response. Biomarkers for an evidence-based decision as to whether or not a burn wound should be surgically restored are needed to improve patient outcome. Therefore, an in-depth understanding of how local responses transition into systemic changes is highly relevant.
MicroRNAs (miRNAs) have been reported as reliable biomarkers for multiple disease types, including several skin conditions [9]. Differential expressions of certain miRNAs are described for psoriasis [10][11][12][10,11,12], atopic dermatitis [13][14][13,14] and keloid tissue [15]. In the denatured dermis of patients with full-thickness burns, 66 miRNAs showed differential expression four days after the burn, when compared to unburned skin [16], but to date, no biomarker has been established among these in clinical practice. Most of the biomarker studies for skin conditions have used plasma or serum samples [9][17][18][9,17,18], but local miRNAs might be masked by miRNAs from tissues that are in close contact with the bloodstream, such as blood cells, liver, kidney or lung tissue [19]. Locally, miRNAs have already been found in the dermal interstitial fluid (dISF) of rats and humans [20]. Because of the use of minimally invasive sampling techniques, such as dermal open-flow micro-perfusion (dOFM) [21], dISF is now more easily accessible [19] and offers the opportunity of measuring miRNA directly at the burned skin site. Reportedly, miRNAs are transported by extracellular vesicles [18], which have also been detected in dISF, where they were shown to mediate crosstalk of keratinocytes and fibroblasts in the context of aging [22]. Little is known about alterations in dermal extracellular vesicles/exosome-like vesicles (ELVs) at the burn injury site, but ELVs derived from human mesenchymal stem cells from the umbilical-chord were shown to accelerate wound healing in the burn wounds of rats [23].
2. In the Early Response to Burn Injuries Putatively Involved miRNAs Are Identified through a Bioinformatics Approach
To identify regulated miRNAs after burn injuries, we set up a bioinformatics approach and analyzed publicly available GEO datasets from transcriptomic studies of biopsies collected from burn patients. To do so, the NCBI-GEO database [24][27] was screened for expression data in the early phase of partial-thickness burns of human skin biopsies. The GEO-dataset GSE8056 [25] was considered the most suitable at the time of the analysis. It included microarray data of 12 samples, three per group, each consisting of the pooled RNA of five patients. We compared three sample-pools from 0 to 3 days after the burn injury, with the three corresponding control sample-pools. Of the 54,675 annotated genes in the analyzed dataset, 3558 (6.5%) were differentially regulated with an adjusted p-value (padj) of < 0.05, 992 (1.8%) with padj < 0.01 and 114 (0.2%) with padj < 0.001 (Table 1). These highly significant early burn-response genes (differentially regulated genes with padj < 0.001) (Table 2) were depicted in a heatmap (Figure 12) and considered for further analysis steps. Among these genes of the early burn response were matrix-associated genes, such as matrix metalloproteases (MMP) and collagens (COL); immunomodulatory genes, such as members of the interleukin (IL) and chemokine (c-x-c motif) ligand (CXCL) families; signal cascade transducers that activate various major cellular pathways; and several others. Of the 114 genes, 79 were upregulated in burn samples (70%) and 35 were downregulated (30%) (Table 1). This is also visualized in the volcano plot and Venn diagram.
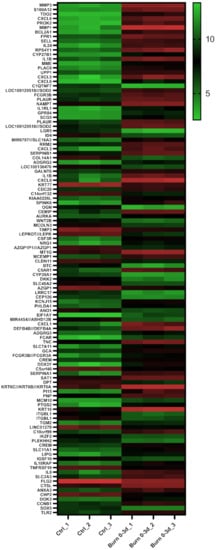
Figure 12. Heatmap displaying 114 early burn response genes that are differentially expressed in the GSE8056 dataset with padj < 0.001. The color indicates the expression, with green being downregulated and red upregulated. Data are displayed as log2 of normalized counts.
Table 1. Results of the GEO2R analysis of the GSE8056 dataset. The groups for control (no burn) and the pooled burn samples 3 days after the burn wounds were compared.
| No. | % |
|---|
| P | t | B | logFC | Gene Symbol | Gene Title | GSM | 198875 0 h |
GSM 198876 0 h |
GSM 198877 0 h |
Mean 0 h |
GSM 198866 3 d |
GSM 198867 3 d |
GSM 198868 3 d |
Mean 3 d |
|---|
| Total genes annotated | 54,675 | 100% |
| 14 | 203434_s_at | 0.0001246 | 3.19 × 10⁻⁸ | 19.65 | 9.10 | 4.28 | MME | membrane metalloendopeptidase | 12.02 | 11.80 | 16.98 | 13.60 | 211.84 | 278.65 | 300.48 | 263.66 |
| padj < 0.05 | 3558 | 6.5% | ||||||||||||||
| 49 | 238512_at | 0.0006066 | 5.67 × 10⁻⁷ | padj < 0.01 | 992 | 1.8% | ||||||||||
| padj < 0.001 | 114 | 0.2% | ||||||||||||||
| −13.73 | upregulated | 79 | 70% | |||||||||||||
| downregulated | 35 | 30% |
Table 2. Selected early burn-response genes, including their rank based on FDR (compare with heatmap Figure 2).
| ID | padj | |||||||||||||||
|---|---|---|---|---|---|---|---|---|---|---|---|---|---|---|---|---|
| 6.78 | −2.38 | WNT2B | Wnt family member 2B | 190.56 | 162.10 | 190.51 | 181.06 | 35.37 | 30.40 | 38.82 | 34.87 | |||||
| 51 | 201150_s_at | 0.0006066 | 5.88 × 10⁻⁷ | −13.67 | 6.75 | −2.35 | TIMP3 | TIMP metallopeptidase inhibitor 3 | 2684.61 | 2025.09 | 2336.93 | 2348.88 | 471.36 | 471.65 | 431.15 | 458.05 |
| 56 | 204745_x_at | 0.0006066 | 6.22 × 10⁻⁷ | 13.57 | 6.70 | 2.62 | MT1G | metallothionein 1G | 642.73 | 474.11 | 677.58 | 598.14 | 3296.03 | 3958.74 | 3704.69 | 3653.15 |
| 62 | 219908_at | 0.000613 | 7.14 × 10⁻⁷ | −13.34 | 6.58 | −3.11 | DKK2 | dickkopf WNT signaling pathway inhibitor 2 | 210.42 | 228.11 | 234.28 | 224.27 | 26.20 | 34.89 | 18.92 | 26.67 |
| 76 | 201645_at | 0.000613 | 8.52 × 10⁻⁷ | 13.04 | 6.42 | 3.08 | TNC | tenascin C | 293.96 | 214.10 | 190.91 | 232.99 | 1506.81 | 2321.70 | 2087.41 | 1971.97 |
| 81 | 205000_at | 0.0006873 | 1.02 × 10⁻⁶ | 12.75 | 6.26 | 4.96 | DDX3Y | DEAD-box helicase 3. Y-linked | 11.08 | 6.00 | 10.63 | 9.24 | 152.53 | 371.48 | 375.00 | 299.67 |
| 87 | 229947_at | 0.0007308 | 1.16 × 10⁻⁶ | 12.54 | 6.14 | 5.05 | PI15 | peptidase inhibitor 15 | 18.37 | 22.90 | 19.28 | 20.18 | 332.87 | 1159.94 | 760.88 | 751.23 |
| 101 | 219181_at | 0.0008774 | 1.62 × 10⁻⁶ | 12.02 | 5.83 | 3.30 | LIPG | lipase G. endothelial type | 16.70 | 12.60 | 27.13 | 18.81 | 196.16 | 170.26 | 164.54 | 176.99 |
| 106 | 202499_s_at | 0.0009022 | 1.77 × 10⁻⁶ | 11.89 | 5.75 | 3.23 | SLC2A3 | solute carrier family 2 member 3 | 133.38 | 70.10 | 72.10 | 91.86 | 785.79 | 729.58 | 970.77 | 828.71 |
| 113 | 238009_at | 0.0009914 | 2.07 × 10⁻⁶ | −11.65 | 5.61 | −2.13 | SOX5 | SRY-box 5 | 92.71 | 104.10 | 133.17 | 109.99 | 24.77 | 24.69 | 24.90 | 24.79 |
Within these 114 early burn response genes, miRNA target sites in their 3′UTRs were identified by using two platforms:
In TargetScanHuman, mRNAs of the early burn response genes were entered and conserved sites for miRNA families broadly conserved among vertebrates were recorded. In parallel, potential miRNA interaction partners for the early burn response genes were also scanned with miRWalk. We identified 113 miRNAs by TargetScanHuman and 251 miRNAs with miRWalk that potentially regulate the 114 early burn response genes. For further analysis, we selected those miRNAs that showed ≥5 interaction partners and/or were found as potential targets by both methods. Thereby, 43 miRNAs were identified as potential regulators of early burn response genes. For 37 of these miRNAs, gene expression assays for analysis were commercially available.
3. Extracellular Vesicles and Their miRNA Cargo in dISF of Burned Skin Have Been Characterized
To investigate the presence and characteristics of ELVs in the dISF of burn injuries, dOFM was performed as previously described [21][26][27][21,28,29], and ELVs were enriched through centrifugation (Figure 23). To verify the presence of ELVs, the exosomal markers flotillin and CD9 were detected in ELV-enriched fractions and mixed particle fractions (MPF) of burned skin and control skin (Figure 34a). There were no changes in the CD9 signal in the ELV-enriched fraction. A slight decrease in CD9 was present in the MPF of burned skin. Protein concentrations in the MPF were 0.8 mg/mL in burn samples and 0.5 mg/mL in control samples (p = 0.06). There were no changes in protein concentrations in the ELV-enriched fractions of burn sites (Figure 34b). Particle sizes in ELV-enriched fractions were not altered in the dISF of burned skin (Figure 34c).
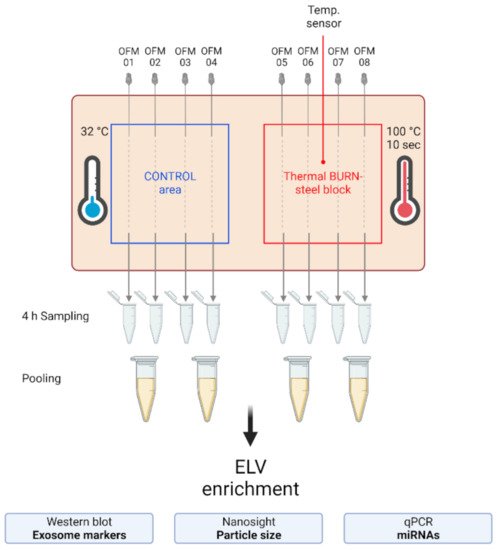
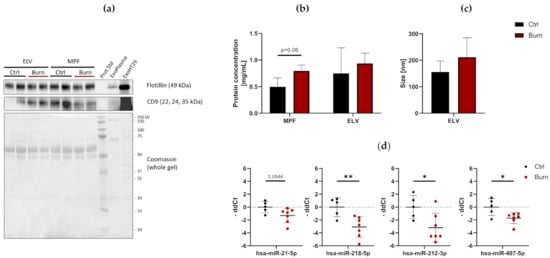
Figure 23. Experimental setup of the dISF sampling with dOFM in an ex vivo human skin model for burn injuries. OFM probes were inserted into ex vivo human skin at the control area (OFM 1–4) and burn area (OFM 5–8), where a steel block of 100 °C was applied for 10 s to provoke a thermal burn. A temperature sensor inserted into the skin enabled the control of temperature at the burn area. OFM was sampled over 4 h. Samples from 2 adjacent probes were pooled. The collected dISF was centrifuged at increasing speeds to enrich ELVs for further experiments.
Figure 34. Characterization of dISF in an ex vivo human skin model for burn injuries. (a) Western blot for expression of exosomal markers flotillin and CD9. Coomassie staining of the whole gel is displayed as loading control. (b) Protein concentration in MPF and ELV and (c) mean size (nm) of particles in the ELV. (d) MiRNAs differentially expressed in dISF sampled with dOFM. Data are derived from 3 independent experiments and presented as individual values of -ddCt, normalized to an interplate calibrator and expressed relative to controls, with means (line) and standard deviation (whiskers). Significance was tested with Student´s t-test, followed by Bonferroni correction; p-values <0.05 were considered as statistically significant, with *, ** indicating p < 0.05, p < 0.01.
4. After a Burn Injury miR-497-5p Is Downregulated in dISF
Of the 37 miRNAs analyzed as potential regulators of early burn response, 32 were detected by qPCR in the ELV-enriched fractions of dISF, collected within the first 4 h after a burn. Five miRNAs could not be detected, namely miR-182-5p, miR-183-5p, miR-302c-3p, miR-367-3p and miR-372-3p. Three miRNAs were altered in ELV-enriched fractions. In tissue and in dISF of burn sites, miRNA-497-5p was downregulated. For miR-218-5p and miR-212-3p, a downregulation was observed in dISF, but not in tissue (Figure 4d and Figure 45).
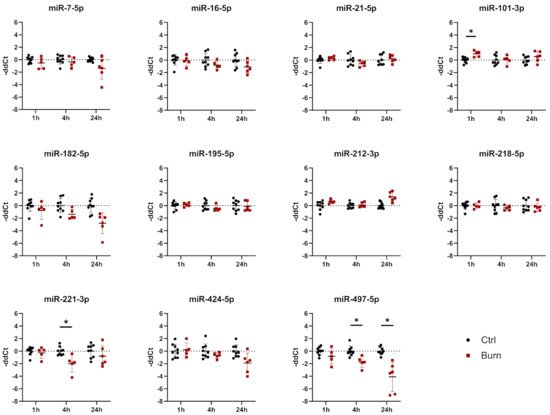
Figure 45. Expression of 11 selected miRNAs in skin biopsies putatively targeting early burn-response genes. Data are derived from 3 independent experiments and presented as individual values of –ddCt, normalized to SNORD 48 and U6 and expressed relative to control, with means (line) and standard deviation (whiskers). Significance was tested with Student´s t-test, followed by Bonferroni correction; p-values < 0.05 were considered as statistically significant, with * indicating p < 0.05.
We created a potential interaction network of miRNAs in dISF (black and red) with the selected mRNA target genes (blue). The miRNAs found to be differentially regulated in dISF are displayed in red and highlighted by their name next to the interaction point. The miRNAs that showed differential expression were tightly embedded within the network and they were potential regulators of several genes that are differentially regulated in early burn response. For miR-497-5p, five interaction points were recorded; miR-218-5p showed six network interactions; miR-21-5p interacted with four partners; and miR-212-5p had one interaction.