Your browser does not fully support modern features. Please upgrade for a smoother experience.
Please note this is a comparison between Version 1 by Matejka Podlogar and Version 2 by Camila Xu.
The three-component hybrid (rGO/TiO2/CN) nanocomposite was prepared in order to enhance the photocatalytic properties of anatase TiO2 nanoparticles (NPs) under solar-like irradiation. The rGO/TiO2/CN was prepared in a mixture of the reduced graphene oxide (rGO, 8 wt%), anatase TiO2 nanoparticles (NPs), and graphitic carbon nitride (g-C3N4, 16 wt%).
- graphitic carbon nitride
- reduced graphene oxide
- hydrothermal synthesis
1. Introduction
The presence of micropollutants on a large scale, particularly in virtually every aquatic ecosystem, has become a major problem. The widespread presence of man-made products, such as pharmaceuticals, dyes, pesticides, plastics, etc., are being detected daily, and investigation into their damaging impact on the biosphere and even human health do not show any positive aspects either. Pollution reaches the environment by different pathways, most abundantly through wastewater treatment [1][2][1,2], where currently employed wastewater treatment plants (WWTP) proved ineffective in the decomposition of harmful complexes. Given the global significance of clean water resources, new processing solutions of wastewater are required. In order to meet today’s requirements and quickly introduce new technologies, solutions must be highly efficient, inexpensive and easily up-scalable.
In the field of remediation and the environmental protection of water systems, photocatalysis has attracted a lot of attention in recent years. A seemingly effective approach for this global problem employs advanced oxidation processes (AOPs) in the presence of a catalyst. The term AOP is reserved for a highly effective purification reaction in water, where the production of hydroxyl radicals (HO●) directly assists the decomposition of harmful organic micropollutants [3][4][3,4].
As a catalyst, titanium dioxide (TiO2) was employed already very early; however, its photocatalytic application is limited due to the high recombination rate of photogenerated charge carriers and efficiency for photodegradation under abundant sunlight. The latter is due to TiO2′s wide bandgap energy of 3.2 eV, which makes merely 5% of the sunlight energy effective for the reaction [5]. Given the importance of water remediation and in order to employ this fascinating, cheap, and harmless compound in other applications, many strategies have been implemented [6]. Tuning the band gap or reducing the recombination rate of the semiconductor by ion doping has been a known technique for decades. Today, catalytic limitations are being overcome by producing complex nanostructures where TiO2 is coupled with metal or non-metal elements [7][8][7,8]. In these composites, heterostructures are introduced, which effectively tailor the bandgap width or recombination rate of electron-hole pairs. Such TiO2-based nanocomposites have been successfully fabricated and showed enhanced photocatalytic activity shifted into the visible, e.g., sunlight range [9]. The combination of more components into the system to reduce the bandgap width, however, reduce overall catalytic activity in comparison to a single bandgap excitation, and to avoid this pitfall, so-called Z-scheme photocatalytic systems are being considered lately [10]. This photocatalytic reaction can facilely be realized by introducing a metal sink into a two-semiconductor heterojunction, by using noble metal nanoparticles, for example [11]. Very promising and mostly cheaper, however, are composites of graphene oxide/TiO2/graphitic carbon nitride [5][12][13][5,12,13].
Graphene-based materials are attractive and well covered throughout the literature [14]. Their unique 2D structure of covalently bonded carbon atoms into a honeycomb-like lattice makes them mechanically strong and conductive, and because only a single atomic layer can be stabilized, they have a huge surface area, which gives a high aspect ratio between the junctions and bulk components. Not much thicker are graphene oxide (GO) and reduced graphene oxide (rGO) [15], two-dimensional structures with similar high mechanical strength, superb electron mobility, and great specific surface area. In the catalytic process, a graphene-based material, more commonly (rGO), serves as an electron sink, which in addition also decreases the recombination rates of the semiconductor [16][17][16,17]. The rGO/TiO2 nanocomposites can easily be prepared by the sol-gel and hydrothermal method, with simultaneous TiO2 growth and GO reduction to rGO [18][19][18,19].
Graphitic carbon nitride (g-C3N4), which is also added to the rGO/TiO2 composite, is a two-dimensional metal-free polymeric semiconductor. The g-C3N4 with s-triazine ring structure has been of interest to researchers due to its chemical, thermal, photochemical, and physical stability, as well as for its low bandgap energy of 2.7 eV [20]. Furthermore, the synthesis of g-C3N4 by the thermal treatment of nitrogen-rich precursors such as urea, dicyandiamide, melamine, and cyanamide [21] is cheap and simple. On the other hand, the main disadvantages, such as the fast recombination of photoinduced electron-hole pairs, renders its usefulness as a single photocatalyst [22].
The preparation of a three-component hybrid (rGO/TiO2/CN) photocatalyst has been used for different photocatalytic reactions [5][12][13][23][5,12,13,23]. However, in our opinion, many more experiments will have to be performed to explore the full potential of this exciting new material. Among them are two areas, namely, different synthesis routes and the investigation of photocatalytic performances and the degradation rate of other micropollutants.
2. Characterization
Characterization
Raman and FTIR analyses were used to identify the chemical bonding in the synthetized photocatalysts. Figure 1A shows the FTIR spectra of the prepared GO, rGO, and g-C3N4 samples. The GO sample shows three characteristic absorption peaks in 1721, 1041, and 1381 cm−1 attributed to several oxygen functional groups, i.e., C=O and C-O stretching, and C-OH bending. The stretching vibration at 1225 cm−1 is assigned to the C-O-C of the epoxy groups. The broad stretching vibration band of the hydroxyl group, O-H, associated with absorbed water molecules and alcohol groups, is represented as a broad peak at 3380 cm−1. Typical absorption peaks of GO disappear in the rGO spectrum. There, the absorption peak at 1617 cm−1 is assigned to the skeleton vibration of less-oxidized graphitic materials, C=C. Comparison between the rGO spectrum and the GO spectrum shows that the reduction of GO by thermal treatment was significant. In the FTIR spectrum of the g-C3N4 sample, several strong peaks were observed in the 1200–1650 cm−1 region. Typical stretching vibrations of C-N heterocycles are represented at 1217, 1315, 1395, and 1452 cm−1. The two bands appeared at 1541 and 1633 cm−1, related to the stretching vibrations of C=N heterocycles, while the peaks located at 885 and 804 cm−1 arose from the characteristic breathing mode of tri-s-triazine rings units. All are characteristic for g-C3N4 material. The extra vibrational region between 3000–3300 cm−1, although not directly related to the g-C3N4 structure, is commonly found in this compound [5][24][5,24], and can be associated with H2O absorption and possible N-H bonds at the surface. Figure 1B shows characteristic functional vibrations of FTIR spectra of the prepared pure TiO2 nanoparticles, TiO2/rGO, TiO2/CN nanocomposites, and the rGO@TiO2/CN hybrid photocatalyst.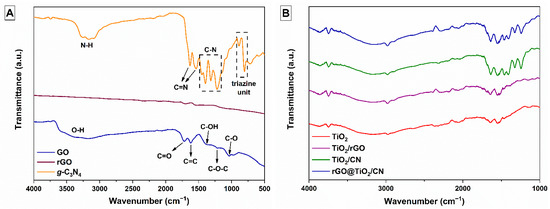
Figure 1. (A) FTIR spectra of as-prepared GO, rGO, and g-C3N4 materials and (B) pure TiO2 nanoparticles, TiO2/rGO, TiO2/CN nanocomposites, and rGO@TiO2/CN hybrid photocatalyst.
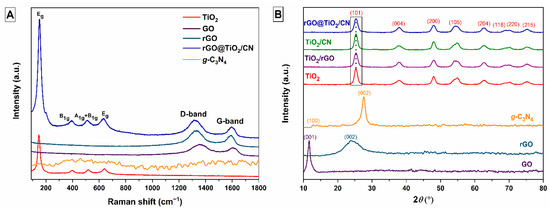
Figure 2. (A) Raman spectra of TiO2, GO, rGO, g-C3N4, and rGO@TiO2/CN nanocomposite, and (B) XRD patterns of the prepared materials.
Table 1.
Calculated crystallite size (
D
, nm) of TiO
2
samples using the Scherrer equation.
| Sample ID | D, nm |
|---|---|
| TiO2 | 7.6 |
| TiO2/rGO | 6.8 |
| TiO2/CN | 7.5 |
| rGO@TiO2/CN | 6.7 |
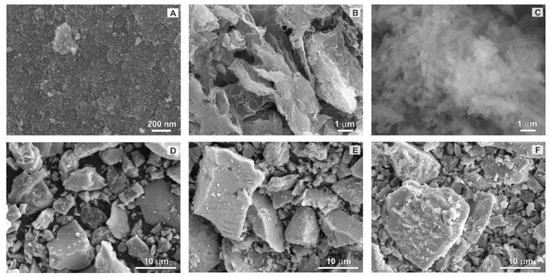
Figure 3. SEM images of (A) pure TiO2 nanoparticles, (B) rGO, (C) g-C3N4, (D) TiO2/rGO, (E) TiO2/CN, and (F) rGO@TiO2/CN.
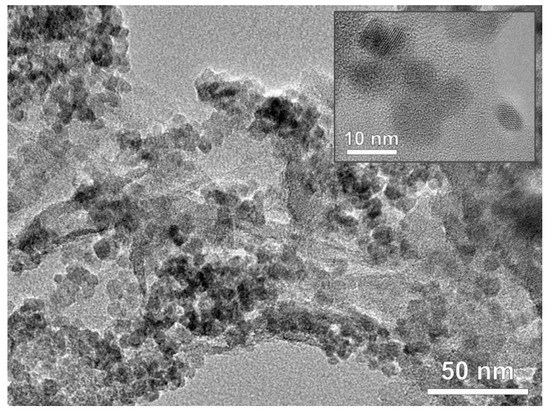
Figure 4. TEM image of rGO@TiO2/CN nanocomposite and inset of anatase TiO2 nanoparticles.
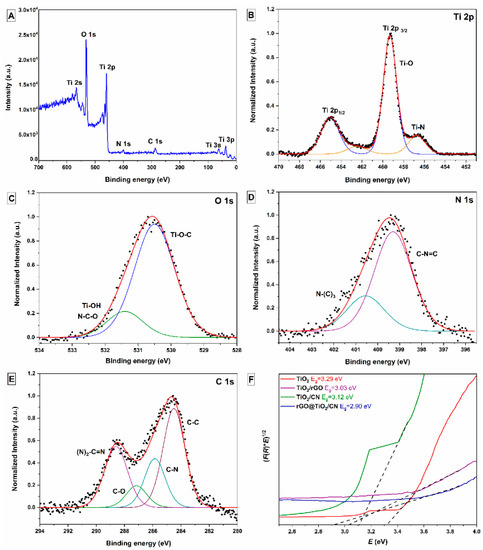
Figure 5. High-resolution XPS spectra of the as-prepared rGO@TiO2/CN sample: (A) fully scanned spectrum, (B) Ti 2p, (C) O 1s, (D) N 1s, (E) C 1s, and (F) band gap energies (Eg) of prepared pure TiO2 nanoparticles, TiO2/rGO, and TiO2/CN nanocomposites, and rGO@TiO2/CN hybrid.
