Your browser does not fully support modern features. Please upgrade for a smoother experience.
Please note this is a comparison between Version 1 by Sanjib Kumar Behera and Version 2 by Camila Xu.
The deficiencies of nutrient elements and inappropriate nutrient management practices in agricultural soils of the world is one of the reasons for low crop productivity, reduced nutritional quality of agricultural produce, and animal/human malnutrition.
- micronutrients
- available sulfur
- tropical soil
- soil health
- human health
1. Introduction
Soils are the prime sources of nutrients for plant growth and development [1][2][1,2]. Plants absorb the desired nutrients from soil in different proportions as per requirements [3][4][3,4]. Phytomicrobiome (microbial community associated with plant) play a pivotal role in enhancing nutrient availability and crop yield [5][6][5,6]. Soil is linked to the well-being of animals and humans through agriculture and agricultural produces [7]. Macronutrients are required in higher quantities by the plants whereas micronutrients (otherwise called as trace elements) are needed in smaller quantities but both the categories of nutrients play equally important roles in plant metabolism. The deficiency of phyto-available (hereafter referred as available) nutrients in soils adversely affect soil health, crop production, nutritional quality of agricultural produces and in turn, human/animal health [8][9][8,9].
Besides nitrogen (N), phosphorus (P) and potassium (K) deficiency, deficiencies of sulfur (S) [10][11][10,11] and micronutrients (zinc (Zn), boron (B), iron (Fe), copper (Cu) and manganese (Mn)) (either single nutrient deficiency or multi-nutrient deficiency) have been reported in different soils of the world, including in India [12][13][14][12,13,14]. The essential micronutrients for field crops are Zn, B, Fe, Cu, Mn and molybdenum [15]. Other micronutrients at low concentrations considered essential for some plants are nickel and cobalt. The incidence of micronutrient deficiencies in crops and soils has increased markedly in recent years. The emergence of micronutrient deficiencies in soils of different parts of the world is primarily due to cultivation of high-yielding crops and cultivars, increased cropping intensity, enhanced application of high-analysis (>30% of available nutrients) NPK fertilizers having lower amounts of micronutrient contaminants, less or no use of organic manures and increased use of advanced soil and plant analysis technologies [15]. The extent of S and micronutrient deficiencies vary within different administrative boundaries such as districts and states because of the variations in soil types, prevailing climatic conditions, nature and type of crops and soil–crop management practices [8][16][8,16]. The intake of foods (obtained from crops) low in micronutrient concentration and produced from micronutrient-deficient soils causes micronutrient malnutrition in animals and humans [14][17][14,17]. However, adoption of agronomic biofortification strategies such as application of micronutrients to soil and crops (as foliar spray) has the potential to ameliorate micronutrient deficiencies in soil–plant systems, and to enhance crop productivity and micronutrient content in agricultural produce, which could alleviate micronutrient malnutrition in animals and humans [18].
There is a need for continuous evaluation and monitoring of the extent of S and micronutrient deficiencies in agricultural soils, at the district and state levels, for the production and supply of the right kind and quantity of S and micronutrient fertilizers and the adoption of appropriate site-specific S and micronutrient management practices [14][19][14,19]. The mapping of S and micronutrient deficiencies in soils using geostatistical tools is useful for proper visualization of location and/or area-wise deficiencies [20]. These maps are useful for taking decisions regarding the application of required nutrients in right quantity, appropriate form and in the right place and in balanced proportions for obtaining the higher nutrient use efficiency. The efficient S and micronutrient management practices in soil–plant systems help in sustainable crop production, production of better-quality agricultural produce and in turn, improve animal and human health [7][9][21][22][7,9,21,22].
2. Concentration of Available S, Zn, B, Fe, Cu and Mn
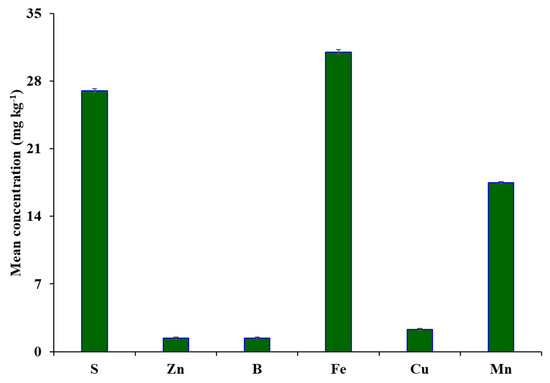
The concentration of available S, Zn and B varied from 0.02–822, 0.01–59.8 and 0.01–109 mg kg−1, respectively (Table 3). The concentration of available Fe, Cu and Mn varied from 0.01–964, 0.01–99.2 and 0.01–483 mg kg−1, respectively. However, the mean concentration of available nutrients followed the order: available Fe > available S > available Mn > available Cu > available Zn, available B (Figure 1). The CV values of available nutrients varied from 111% (for available S) to 338% (for available B).


Figure 1. Mean concentration of available S and micronutrients in agricultural soils of India. Error bars indicate stand error of the means.
Table 3.
Descriptive statistics of available sulfur and micronutrients in soils the India (
n
= 242827).
| Nutrients | Minimum | Maximum | Mean | SD | CV (%) | Skewness | Kurtosis |
|---|
| S (mg kg | −1 | ) | 0.02 | 822 | 27.0 | 29.9 | 111 | 4.28 | 35.6 |
| Zn (mg kg | −1 | ) | 0.01 | 59.8 | 1.40 | 1.60 | 118 | 7.35 | 118 |
| B (mg kg | −1 | ) | 0.01 | 109 | 1.40 | 4.70 | 338 | 12.8 | 189 |
| Fe (mg kg | −1 | ) | 0.01 | 964 | 31.0 | 52.2 | 168 | 5.53 | 47.3 |
| Cu (mg kg | −1 | ) | 0.01 | 99.2 | 2.30 | 3.50 | 153 | 10.8 | 186 |
| Mn (mg kg | −1 | ) | 0.01 | 483 | 17.5 | 21.4 | 122 | 5.72 | 59.7 |
Note: S = available sulfur, Zn = available zinc, B = available boron, Fe = available iron, Cu = available copper, Mn = available manganese, SD = standard deviation, CV = coefficient of variation.
3. Distribution of Single Nutrient Deficiencies of S, Zn, B, Fe, Cu and Mn
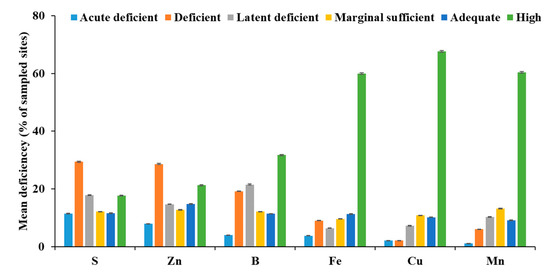
The concentration of available nutrients in soils were grouped into acute deficient, deficient, latent deficient, marginally sufficient, adequate and high categories. About 11.4%, 29.4% and 17.8% of the sampled sites were acute deficient (≤7.5 mg kg−1), deficient (>7.5–≤15.0 mg kg−1) and latent deficient (>15.0–≤22.5 mg kg−1) in available S, respectively (Figure 2). Meanwhile, 12.1%, 11.6% and 17.7% of the sampled sites were marginally sufficient (>22.5–≤30.0 mg kg−1), adequate (>30.0–≤40.0 mg kg−1) and high (>40.0 mg kg−1) in available S. Out of 615 districts, >30–≤40% of the sampled sites in 86 districts, >40–≤50% of the sampled sites in 70 districts and >50% of the sampled sites in 101 districts were deficient (acute deficient + deficient) in available S. More than 50% of the sampled sites in 12 districts of Gujarat, 13 districts of Madhya Pradesh and 8 districts each in Odisha and Tamil Nadu were deficient in available S.


Figure 2. Mean deficiency of available S and micronutrients in agricultural soils of India. Error bars indicate stand error of the means.
About 7.90%, 28.6% and 14.7% of the sampled sites were acute deficient (≤0.30 mg kg−1), deficient (>0.30–≤0.60 mg kg−1) and latent deficient (>0.60–≤0.90 mg kg−1) in available Zn, respectively (Figure 2). Meanwhile, 12.7%, 14.8% and 21.3% of the sampled sites were marginally sufficient (>0.90–≤1.20 mg kg−1), adequate (>1.20–≤1.80 mg kg−1) and high (>1.80 mg kg−1) in available Zn, respectively. More than 30–≤40% of the sampled sites in 68 districts, >40–≤50% of samples in 57 districts and >50% of the sampled sites in 131 districts were deficient (acute deficient + deficient) in available Zn. More than 50% of the sampled sites in 16 districts of Bihar, 40 districts of Madhya Pradesh, 13 districts of Maharashtra and 23 districts of Tamil Nadu were deficient in available Zn.
About 4.00%, 19.2% and 21.5% of the sampled sites were acute deficient (≤0.20 mg kg−1), deficient (>0.20–≤0.50 mg kg−1) and latent deficient (>0.50–≤0.70 mg kg−1) in available B, respectively (Figure 2). Meanwhile, 12.1%, 11.4% and 31.7% of the sampled sites were marginally sufficient (>0.70–≤0.90 mg kg−1), adequate (>0.90–≤1.10 mg kg−1) and high (>1.10 mg kg−1) in available B, respectively. More than 30–≤40% of the sampled sites in 75 districts, >40–≤50% of the sampled sites in 57 districts and >50% of the sampled sites in 86 districts were deficient (acute deficient + deficient) in available B. More than 50% of the sampled sites in 6 districts each of Assam and Karnataka, 7 districts of Jharkhand, 10 districts of Kerala, 15 districts of Odisha and 5 districts each of Maharashtra, Telangana and West Bengal were deficient in available B.
About 3.80%, 9.00% and 6.40% of the sampled sites were acute deficient (≤2.50 mg kg−1), deficient (>2.50–≤4.50 mg kg−1) and latent deficient (>4.50–≤6.50 mg kg−1) in available Fe, respectively (Figure 2). Meanwhile, 9.60%, 11.3% and 59.9% of the sampled sites were marginally sufficient (>6.50–≤8.50 mg kg−1), adequate (>8.50–≤10.5 mg kg−1) and high (>10.5 mg kg−1) in available Fe, respectively. More than 15–≤20% of the sampled sites in 55 districts, >20–≤25% of samples in 17 districts and >25% of the sampled sites in 83 districts were deficient (acute deficient + deficient) in available Fe. More than 25% of the sampled sites in 17 districts of Gujarat, 14 districts of Maharashtra, 8 districts of Rajasthan and 9 districts of Uttar Pradesh were deficient in available Fe.
About 2.10%, 2.10% and 7.20% of the sampled sites were acute deficient (≤0.20 mg kg−1), deficient (>0.20–≤0.40 mg kg−1) and latent deficient (>0.40–≤0.60 mg kg−1) in available Cu, respectively (Figure 2). Meanwhile, 10.8%, 10.2% and 67.6% of the sampled sites were marginally sufficient (>0.60–≤0.80 mg kg−1), adequate (>0.80–≤1.00 mg kg−1) and high (>1.00 mg kg−1) in available Cu. Out of 615 districts, >15–≤20% of the sampled sites in 13 districts, >20–≤25% of the sampled sites in 8 districts and >25% of the sampled sites in 5 districts were deficient (acute deficient + deficient) in available Cu. More than 25% of the sampled sites in one district of Haryana, three districts of Tamil Nadu and one district of Odisha were deficient in available Cu.
About 1.10%, 6.00% and 10.3% of the sampled sites were acute deficient (≤1.00 mg kg−1), deficient (>1.00–≤3.00 mg kg−1) and latent deficient (>3.00–≤5.00 mg kg−1) in available Mn, respectively (Figure 2). Meanwhile, 13.2%, 9.10% and 60.4% of the sampled sites were marginally sufficient (>5.00–≤7.00 mg kg−1), adequate (>7.00–≤9.00 mg kg−1) and high (>9.00 mg kg−1) in available Mn, respectively. More than 15–≤20% of the sampled sites in 21 districts, >20–≤25% of samples in 14 districts and >25% of the sampled sites in 41 districts were deficient (acute deficient + deficient) in available Mn. More than 25% of the sampled sites in 4 districts of Bihar, 7 districts each of Jammu and Kashmir, Punjab and Rajasthan, 1 district each of Haryana, Himachal Pradesh, Tamil Nadu and Telangana and 12 districts of Uttar Pradesh were deficient in available Mn.
