Brillouin Spectroscopy: Comparison
Please note this is a comparison between Version 2 by Bruce Ren and Version 1 by María Victoria Gómez-Gaviro.
Brillouin spectroscopy is an empirical spectroscopy technique which allows for the determination of elastic moduli for a given material. The technique uses inelastic scattering of light when it encounters acoustic phonons in a crystal, a process known as Brillouin scattering, to determine phonon energies and therefore interatomic potentials of a material. The scattering occurs when an electromagnetic wave interacts with a density wave, photon-phonon scattering. This technique is commonly used to determine the elastic properties of materials in mineral physics and material science. Brillouin spectroscopy can be used to determine the complete elastic tensor of a given material which is required in order to understand the bulk elastic properties.

Brillouin spectroscopy has recently gained considerable interest within the biomedical field as an innovative tool to study mechanical properties in biology. The Brillouin effect is based on the inelastic scattering of photons caused by their interaction with thermodynamically driven acoustic modes or phonons and it is highly dependent on the material’s elasticity. Therefore, Brillouin is a contactless, label-free optic approach to elastic and viscoelastic analysis that has enabled unprecedented analysis of ex vivo and in vivo mechanical behavior of several tissues with a micrometric resolution, paving the way to a promising future in clinical diagnosis.

  • Brillouin spectroscopy
  • diagnosis
  • mechanics
  • viscoelasticity
  • biological tissues

1. Comparison with Raman Spectroscopy

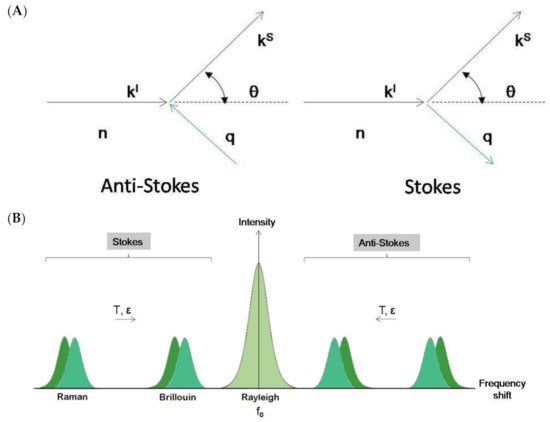
An illustration of an example Brillouin and Raman spectrum. In practice the distinction between Brillouin and Raman spectroscopy depends on which frequencies we choose to sample. Brillouin scattering generally lies within the GHz frequency regime.

Brillouin spectroscopy is similar to Raman spectroscopy in many ways; in fact the physical scattering processes involved are identical. However, the type of information gained is significantly different. The process observed in Raman spectroscopy, Raman scattering, involves high frequency molecular rotational and vibrational modes. Information relating to modes of vibration, such as the six normal modes of vibration of the carbonate ion, (CO3)2

1. Introduction
As the role of mechanical properties of cells and tissues is gaining high relevance in the study of a wide range of biological processes, Brillouin imaging has emerged as a promising tool for the characterization of biological samples in terms of their viscoelastic behavior. Traditional techniques for the characterization of biomaterials such as magnetic bead twisting, deformation microscopy, micro-rheology, or atomic force microscopy (AFM) either require contact, are destructive, or do not provide sufficient resolution. Conventional optical coherence elastography, which is a clinical tool that measures tissue biomechanics, is very sensitive to environmental vibrations [1]. On the contrary, Brillouin imaging presents a contactless, label-free, non-destructive modality for probing biological samples in the GHz/micron scale and with great potential in clinical diagnosis.
The Brillouin light scattering (BS) effect was predicted by Léon Brillouin [2][3] and Leonid I. Mandelstam [4][5][6] independently in 1922 and 1926, respectively. However, there is controversy due to the possibility that L. I. Mandelstam had already presented this effect in 1918 [7]. L. I. Mandelstam joined Eugenii Gross to detect the BS experimentally, becoming the first person to observe the Brillouin effect and offer empirical confirmation [8].
The laser’s invention in the 1960s brought a light source powerful enough to reduce acquisition times and increase the resolution, resulting in hundreds of experimental works in the area of condensed matter and becoming a consolidated tool [8][9]. Following the theoretical model presented by L. Brillouin and L. I. Mandelstam, Brillouin–Mandelstam scattering (for the sake of simplicity, it will be only denoted as Brillouin scattering (BS)) is based on the light’s interaction with collective fluctuations of density in the physical medium, provoking a change in the frequency of the scattered light; this effect is explained by a sort of Doppler effect in addition to the Bragg condition to obtain constructive interference.
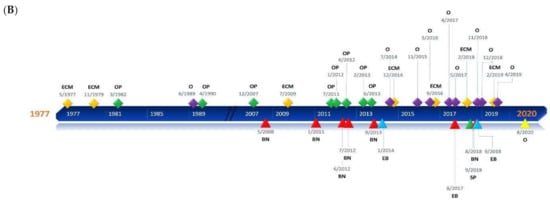
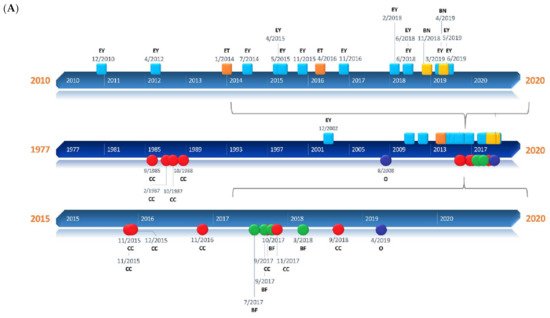
The first examples of BS measurements on biological tissues were described in the late 1970s and early 1980s that demonstrated the power of this system as a research tool of high resolution and sensitivity [10][11]. Following the development of the virtually imaged phased array (VIPA) spectrometers in 1996 and the introduction of Brillouin imaging in 2005, the topic has flourished into a prolific and fast-moving research field [12][13][14]. During the last decade, a great variety of applications of BS to biology and biomedicine has been reported. BS has been tested as a screening and diagnostic tool and a monitoring resource for a wide range of biological samples at cellular and tissue resolution [15]. This work aims to offer an overview of the development of BS-based techniques in biology, offering a comprehensive summary of the currently available literature and state-of-the-art instrumentation, and explores possible future outlooks (Figure 1A,B).
Figure 1. Timelines of the different applications presented in the review. (A) Square milestones represent publications related to human applications of Brillouin and have been classified into three groups: ophthalmology (EY), epithelial tissue (ET), and bone (BN). Circular milestones represent publications related to Brillouin microscopic studies regarding subcellular components (CC), biofilms (BF), and others (O). (B) Rhomboidal milestones represent Brillouin studies of animal tissues such as extracellular matrix (ECM), ephthalmological tissues (OP) such as the cornea or crystalline lenses, and others (O) that include neuronal, vascular, and oncological applications, among others. Triangular milestones represent publications related to Brillouin studies of animal organs such as bone (BN), spine (SP), embryos (EB), or others (O).

2. Brillouin Light Scattering

2.1. Physical Basis

Scattering of light results from the interaction of the electromagnetic field with the constituents of the physical medium. That is the reason why a laser beam can be seen in directions other than the propagation direction. The scattered light can be more or less intense depending on the density of the physical medium and the particle size. The scattered light is composed of different components: one component corresponds to the original frequency (Rayleigh) and others result from intense frequency changes (Raman) or very subtle ones (Brillouin). Apart from the energy change in the scattered light, another relevant difference between Raman and Brillouin scattering includes the physical origin of the effect. In a simplified manner, the intramolecular vibrations are relevant in Raman scattering and the low energy collective vibrations are relevant for Brillouin scattering. The magnitude of the Brillouin-scattered light is about 103 times smaller than the Raman component and its frequency changes only about 10

, can be obtained through a Raman spectroscopy study shedding light on structure and chemical composition,[2] whereas Brillouin scattering involves the scattering of photons by low frequency phonons providing information regarding elastic properties.[3] Optical phonons measured in Raman spectroscopy have wavenumbers on the order of 10 –10000 cm

6–10

5

times with respect to the incident laser light; therefore, it is very challenging to assess.
The classical explanation of the Brillouin effect relies on the interaction of the electric field of the light with thermal fluctuations of the dielectric constant of the physical medium as first described in 1880 by the Lorentz–Lorenz equation. A historical review of this formula is presented by H. Kragh [16]:
where n2 = ε; n is the refractive index and ε is the dielectric constant, r is the specific refractivity, and ρ the mass density. However, a new vision of the Brillouin–Mandelsatm effect arises with the introduction of quantum mechanical approaches. Light is constituted by photons that behave as if they suffer an inelastic collision when traversing a physical medium (Figure 2A). The counterpart of this collision is the collective vibrations of the medium. These vibrations can be expressed in eigenmodes and can thus be treated as quasiparticles (phonons). In an inelastic collision, energy and momentum must be conserved, resulting in the following relationships:
where ks and ki correspond to the scattered and incident light wave vectors, q is the acoustic wave vector, ωs and ωi correspond to the scattered and incident light’s physical frequencies, and ω(q) is the acoustic frequency. The shift in the probing light’s frequency is therefore equivalent to the acoustic frequency of the phonons and it is known as the Brillouin shift. Hard media have high acoustic frequencies and therefore larger Brillouin shifts than soft media. The Brillouin shift is also highly dependent on the temperature of the media as thermal energy increases the vibrational frequency of phonons (Figure 2B).
Figure 2. (A). Schematic representation of the Brillouin–Mandelstam effect as a collision between photon (kl) and phonon (q). n is the refractive index of the physical medium and θ is the scattering angle. (B). Schematic representation of Brillouin and Raman spectra. In both experimental techniques, a small amount of light undergoes inelastic scatter, gaining or losing energy and giving rise to a couple of symmetric, frequency-shifted peaks in the spectrum. The remaining elastically scattered light (Rayleigh scatter) appears as a broad central peak with the same frequency as the incident light (f0). In Brillouin and Raman spectroscopies, peak frequency position varies with temperature (T) and strain (ε). In Raman spectroscopy, the intensity ratio between Stokes and anti-Stokes peaks varies also with T.
This picture, which may be mathematically but not conceptually simple (Figure 2A), is well established in solid state physics and is based on a crystalline lattice. In systems without crystalline lattice, as is the case of liquids or glasses, the concept of hydrodynamic modes has been successfully introduced [17][18]. A typical Brillouin scattering spectrum is shown in Figure 2B.
The stimulated Brillouin spectroscopy (SBS) is a conceptually different method that has been recovered and is being considered for biomedical research. This method has shown its potential in liquids and some polymers [19], and is based on the interference of two incident laser beams traversing the sample in different directions but crossing in a defined sample region. A density diffraction grid is stimulated (mainly by electrostriction) and can propagate in the physical medium. Its propagation velocity corresponds to an acoustic wave’s propagation velocity and is detected by one of the lasers. SBS imaging enables measurements with fast acquisition times free from elastic scattering background; therefore, it has been presented as a compelling alternative to conventional BS [20]. However, as SBS is based on the simultaneous application of two lasers, internal scattering may entail a critical hindering in its applicability to non-transparent samples if an initial optical clearing step is not performed. Nevertheless, its Raman homologous SRS has been successfully applied to non-cleared 1 mm thick mouse brain sections with a cellular resolution [21].
There is a growing tendency to combine Brillouin with Raman spectroscopy; therefore, a brief insight on the physical basis of the Raman effect should be provided to understand its contribution to some of the Brillouin studies that will be presented in this review. Both Brillouin and Raman scattering are based on the principle of inelastic scattering of light by phonons that are acoustic in the case of Brillouin and optical in the case of Raman. While the probing of acoustic phonons by BS provides information about the speed of propagation of lattice vibrations, which relates to the mechanical properties and density of the material, the probing of optical phonons by Raman yields information concerning the intrinsic vibrations of molecules, indicating the types of bonds that exist between them and allowing for the molecular characterization of samples. More in depth, Raman scattering is caused by intermediate electronic states that arise due to quantum vibrations specific for different molecular bond types, leading to asymmetric electronic transitions that vary in their final resting state. Raman is not a type of fluorescence emission that is characterized by energy loss in the excited electronic state but for which the resting state corresponds to the pre-excitation one [22]. Contrarily, in Raman, the electrons do not suffer energy loss in the excited state but relax into a different resting-state depending on the corresponding bond’s vibrational energy, inducing a Raman frequency shift proportional to such a vibrational state [22].

2.2. Experimental Setup: Scattering Geometries

The experimental implementation of a Brillouin spectroscopy system is somewhat complicated as the photon–phonon interaction occurs within the material under study and must be described in a reference frame outside the material, namely the laboratory reference frame. This fact is very relevant and therefore the so-called scattering geometries is crucial in the BS experiment. The scattering geometries are geometrical relationships between the sample orientation, incident, and scattered light beams in the laboratory reference frame. Moreover, these scattering geometries determine the direction and magnitude of the acoustic scattering wave vector (q) that is fundamental for the correct interpretation of the BS experiment in general and particularly in the case of material with preferential directions as in crystals or fibers.
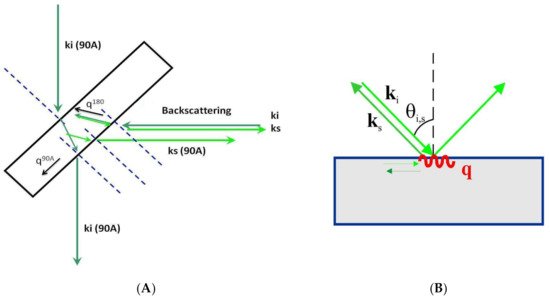
The most commonly used scattering geometries are 90, 90A, and 180 (backscattering geometry) [23]. Figure 3A shows the 90A and 180 (backscattering geometries) with the incident’s geometrical relations, scattered light directions, and the acoustic wave vectors involved. As can be observed, different scattering geometries imply different orientations of the acoustic wave vector. The magnitude of the acoustic wave vector is provided by:
where λ0 is the laser vacuum wavelength and n is the refractive index of the physical medium. The wave vector’s magnitude in the 90A scattering geometry is independent of the refractive index of the material studied. In contrast, in the other scattering geometries, the refractive index is always present. The combination of these scattering geometries in an optically and elastically isotropic material provides the value of the corresponding refractive index:
where f90A and f

1 , while phonons involved in Brillouin scattering are on the order of 0.1 – 6 cm80

correspond to the Brillouin frequency shift of the experiment for the 90A and backscattering geometries, respectively.
Figure 3. Representation of different scattering geometries. (A) 90A and 180 as used in solid transparent samples or liquids inside a cuvette. ki and ks are incident and scattered optical wave vectors, respectively. q90A and q

1. This order of magnitude difference becomes obvious when attempting to run Raman spectroscopy vs. Brillouin spectroscopy experiments. In Brillouin scattering, and similarly Raman scattering, both energy and momentum are conserved in the relations:[1]

[math]\displaystyle{ \hbar\Omega= \pm\hbar(\omega_i-\omega_s ) }[/math]
[math]\displaystyle{ q = (k_t-k_s) }[/math]

Where ω and k are the angular frequency and wavevector of the photon, respectively. While the phonon angular frequency and wavevector are Ω and q. Subscripts i and s correspond to incident and scattered waves. The first equation is the result of the application of the conservation of energy to the system of the incident photon, the scattered photon, and the interacting phonon. Applying conservation of energy also sheds light upon the frequency regime in which Brillouin scattering occurs. The energy imparted on an incident photon from a phonon is relatively small, generally around 5-10% that of the photon’s energy.[4] Given an approximate frequency of visible light, ~1014 GHz, it’s easy to see that Brillouin scattering generally lies in the GHz regime. The second equation describes the application of conservation of momentum to the system.[1] The phonon, which is either generated or annihilated, has a wavevector which is a linear combination of the incident and scattered wavevectors. This orientation will become more apparent and important when the orientation of the experimental setup is discussed.

Geometric relationships between longitudinal, L, and transverse, T, acoustic waves.

The equations describe both the constructive (Stokes) and destructive (anti-Stokes) interactions between a photon and phonon. Stokes scattering describes the interaction scenario in which the material absorbs the photon, creating a phonon, inelastically emitting a photon with a lower energy than that of the absorbed photon. Anti-Stokes scattering describes the interaction scenario in which the incoming photon absorbs a phonon, phonon annihilation, and a photon with a higher energy than that of absorbed photon is emitted. The figure illustrates the differences between Raman scattering and Brillouin scattering along with Stokes and anti-Stokes interactions as it seen in experimental data. The figure depicts three important details. The first is the Rayleigh line, the peak which has been suppressed at 0 cm−1. This peak is a result of Rayleigh scattering, a form of elastic scattering from the incident photons and the sample. Rayleigh scattering occurs when the induced polarization of the atoms, resulting from the incident photons, does not couple with possible vibrational modes of the atoms. The resulting emitted radiation has the same energy as the incident radiation, meaning no frequency shift is observed. This peak is generally quite intense and is not of direct interest for Brillouin spectroscopy. In an experiment the incident light is most often a high power laser. This results in a very intense Rayleigh peak which has the ability to wash out the Brillouin peaks of interest. In order to adjust for this, most spectrum are plotted with the Rayleigh peak either filtered out or suppressed. The second noteworthy aspect of the figure is the distinction between Brillouin and Raman peaks. As previously mentioned, Brillouin peaks range from 0.1 cm−1 to approximately 6 cm−1 while Raman scattering wavenumbers ranges from 10–10000 cm−1.[1] As Brillouin and Raman spectroscopy probe two fundamentally different interaction regimes this is not too large of an inconvenience. The fact that Brillouin interactions are such low frequency however creates technical challenges when performing experiments for which a Fabry-Perot interferometer must be used in order to overcome. A Raman spectroscopy system is generally less technically complicated and can be performed with a diffraction grating spectrometer. The figure also highlights the difference between Stokes and anti-Stokes scattering. Stokes scattering, positive photon creation, is displayed as a positive shift in wavenumber. Anti-Stokes scattering, negative photon annihilation, is displayed as a negative shift in wavenumber. The locations of peaks are symmetric about the Rayleigh line because they correspond to the same energy level transition but of a different sign.[4] In practice six Brillouin lines, of interest, are generally seen in a Brillouin spectrum. Acoustic waves have three polarization directions one longitudinal and two transverse directions each being orthogonal to the others. Solids can be considered nearly incompressible, within an appropriate pressure regime, as a result longitudinal waves, which are transmitted via compression parallel to the propagation direction, can transmit their energy through the material easily and thus travel quickly. The motion of transverse waves, on the other hand, is perpendicular to the propagation direction and is thus less easily propagated through the medium. As a result, longitudinal waves travel more quickly through solids than transverse waves. An example of this can be seen in quartz with an approximate acoustic longitudinal wave velocity of 5965 m/s and transverse wave velocity of 3750 m/s. Fluids cannot support transverse waves. As a result, transverse wave signals are not found in Brillouin spectra of fluids. The equation shows the relationship between acoustic wave velocity, V, angular frequency Ω, and phonon wavenumber, q.[1]

[math]\displaystyle{ V=\Omega /q }[/math]

According to the equation, acoustic waves with varying speeds will appear on the Brillouin spectra with varying wavenumbers: faster waves with higher magnitude wavenumbers and slower waves with smaller wavenumbers. Therefore, three distinct Brillouin lines will be observable. In isotropic solids the two transverse waves will be degenerate, as they will be traveling along elastically identical crystallographic planes. In non-isotropic solids the two transverse waves will be distinguishable from one another, but not distinguishable as being horizontally or vertically polarized without a deeper understanding of the material being studied. They are then generically labeled transverse 1 and transverse 2.

2. Applications

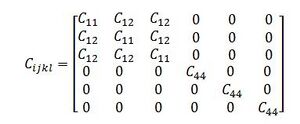
Cubic elastic tensor after symmetry reduction.

Brillouin spectroscopy is an extremely strong tool for determining the complete elastic tensor, [math]\displaystyle{ c_{ijkl} }[/math], of solids. The elastic tensor is an 81 component 3x3x3x3 matrix which, through Hooke’s Law, relates stress and strain within a given material. The number of independent elastic constants found within the elastic tensor can be reduced, through symmetry operations, and depends on the symmetry of a given material ranging from 2 for non-crystalline substances or 3 for cubic crystals to 21 for systems with triclinic symmetry. The tensor is unique to given materials and thus must be independently determined for each material in order to understand their elastic properties. The elastic tensor is especially important to mineral physicist and seismologists looking to understand the bulk, polycrystalline, properties of deep Earth minerals. It is possible to determine elastic properties of materials such as the adiabatic bulk modulus, [math]\displaystyle{ K_s }[/math], without first finding the complete elastic tensor through techniques such as the determination of an equation of state through a compression study. Elastic properties found in this way, however, do not scale well to bulk systems such as those found within rock assemblages in the Earth’s mantle. In order to calculate the elastic properties of bulk material with randomly oriented crystals the elastic tensor is needed. Using Equation 3, it is possible to determine the sound velocity through a material. In order to obtain the elastic tensor the Christoffel Equation, Equation 4, needs to be applied: [math]\displaystyle{ c_{ijkl} \Lambda_{kl}=\lambda_{kl} \delta_{kl} p_{kl} }[/math] The Christoffel Equation is essentially an eigenvalue problem which relates the elastic tensor, [math]\displaystyle{ c_{ijkl} }[/math], to the crystal orientation and the orientation of the incident light, [math]\displaystyle{ \Lambda_{kl} }[/math], to a matrix, [math]\displaystyle{ \lambda_{kl} }[/math], whose eigenvalues are equal to ρV2, where ρ is density and V is acoustic velocity.. The polarization matrix, [math]\displaystyle{ p_{kl} }[/math], contains the corresponding polarizations of the propagating waves.

Relationships between elastic constants and X for cubic systems depending upon the direction of propagation of the phonon, q, and the eigenvector of the phonon, U, where L = longitudinal and T = transverse acoustic waves.[5]

Using the equation, where [math]\displaystyle{ \Lambda_{kl} }[/math] and [math]\displaystyle{ p_{ij} }[/math] are known from the experimental setup and V is determined from the Brillouin spectra, it is possible to determine [math]\displaystyle{ c_{ijkl} }[/math], given the density of the material. For specific symmetries the relationship between a specific combination of elastic constants, X, and acoustic wave velocities, ρV2, have been determined and tabulated.[6] For example, in a cubic system [math]\displaystyle{ c_{ijkl} }[/math] reduces to 3 independent components. Equation 5 shows the complete elastic tensor for a cubic material.[5] The relations between the elastic constants and can be found in Table 1. In a cubic material it is possible to determine the complete elastic tensor from pure longitudinal and pure transverse phonon velocities. In order make the above calculations the phonon wavevector, q, must be pre-determined from the geometry of the experiment. There are three main Brillouin spectroscopy geometries: 90 degree scattering, backscattering, and platelet geometry.

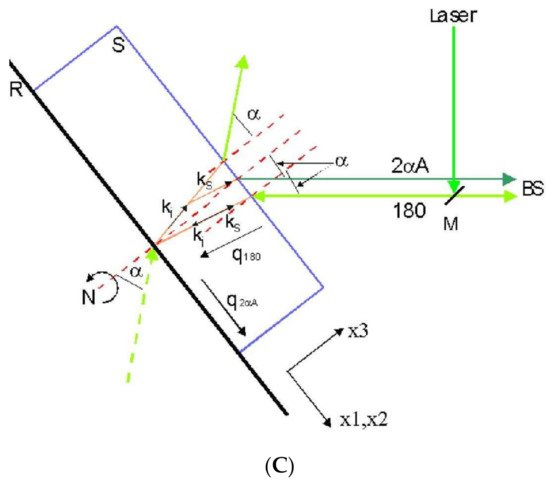
80 correspond to acoustic wave vectors. (B) Scattering geometry in an opaque material. (C) Scattering geometries in a film on a reflecting substrate. The reflected light beam acts as a virtual one from behind the sample. Two scattering geometries exist simultaneously: 180 and 2αA.
A compelling case concerns transparent film samples (thickness above 500 nm), either self-standing or resting on a reflecting substrate. As can be observed in Figure 3C, on the back surface of the plate, the incident light reflects and produces a supplementary light source that allows the simultaneous observation of two scattering geometries including the 180 (backscattering) and the other depending on the incident angle [24]. This second scattering geometry can be denoted as 2αA, similar to the 90A because its acoustic wave vector is independent of the refractive film index:
where αi is the incident angle.
In opaque materials with an excellent surface optical quality of mostly metallic or semiconductor materials, the light beam is reflected on the surface and cannot penetrate the inner part of the sample. Only the projection on the material’s surface of the incident and scattered light wave vectors are relevant for the scattering process. The acoustic wave vector remains on the material’s surface and can only couple to its surface acoustic waves (SAW) (Figure 3B). In this case, the acoustic wave vector reads as follows [25]:
where θi is the incident angle. In magnetic materials, the magnetic field of the incident light can couple to the magnetic modes of the material (magnons) to obtain information about its magnetic properties [26].

References

  1. Li, Y.; Moon, S.; Chen, J.J.; Zhu, Z.; Chen, Z. Ultrahigh-sensitive optical coherence elastography. Light Sci. Appl. 2020, 9, 58.
  2. Brillouin, L. Diffusion de la lumière et des rayons X par un corps transparent homogène. Ann. Phys. 1922, 9, 88–122.
  3. Brillouin, L. Influence de l’agitationthermique sur la viscosité des liquides. Propagationd’ondesélastiquesdans un milieu en mouvement. J. Phys. Radium 1922, 3, 362383.
  4. Carlotti, G. Elastic Characterization of Transparent and Opaque Films, Multilayers and Acoustic Resonators by Surface Brillouin Scattering: A Review. Appl. Sci. 2018, 8, 124.
  5. Gabriel, P. Light Scattering in Inhomogeneous Media; McGraw-Hill Education: New York, NY, USA, 2010.
  6. Mandelstam, L.I. Light scattering by inhomogeneus media. Zh. Russ. Fiz-Khim. Ova. 1926, 58, 381.
  7. Pechenkin, A. Leonid Isaakovich Mandelstam; Springer: Cham, Switzerland, 2014; ISBN 9783319005713.
  8. Gross, E. überÄnderung der WellenlÄngebeiLichtzerstreuung in Kristallen. Z. Fur Phys. 1930, 63, 685.
  9. Rank, D.H. Brillouin Effect in Liquids in the Prelaser Era. J. Acoust. Soc. Am. 1971, 49, 937–940.
  10. Harley, R.; James, D.F.V.; Miller, A.J.; White, J.W. Phonons and the elastic moduli of collagen and muscle. Nature 1977, 267, 285–287.
  11. Vaughan, J.M.; Randall, J.T. Brillouin scattering, density and elastic properties of the lens and cornea of the eye. Nature 1980, 284, 489–491.
  12. Shirasaki, M. Large angular dispersion by a virtually imaged phased array and its application to a wavelength demultiplexer. Opt. Lett. 1996, 21, 366–368.
  13. Koski, K.J.; Yarger, J.L. Brillouin imaging. Appl. Phys. Lett. 2005, 87, 061903.
  14. Coker, Z.; Troyanova-Wood, M.; Traverso, A.J.; Yakupov, T.; Utegulov, Z.N.; Yakovlev, V.V. Assessing performance of modern Brillouin spectrometers. Opt. Express 2018, 26, 2400–2409.
  15. Antonacci, G.; Beck, T.; Bilenca, A.; Czarske, J.; Elsayad, K.; Guck, J.; Kim, K.; Krug, B.; Palombo, F.; Prevedel, R.; et al. Recent progress and current opinions in Brillouin microscopy for life science applications. Biophys. Rev. 2020, 12, 615–624.
  16. Kragh, H. The Lorenz-Lorentz formula: Origin and early history. Substantia 2018, 2, 7–18.
  17. Carpenter, D.K. Dynamic Light Scattering with Applications to Chemistry, Biology, and Physics (Berne, Bruce J.; Pecora, Robert). J. Chem. Educ. 1977, 54, A430.
  18. Berne, B.J.; Pecora, R. Dynamic Light Scattering: With Applications to Chemistry, Biology, and Physics; Dover Publications: Mineola, NY, USA, 1976.
  19. Garmire, E. Stimulated Brillouin Review: Invented 50 Years Ago and Applied Today. Int. J. Opt. 2018, 2018, 2459501.
  20. Remer, I.; Shaashoua, R.; Shemesh, N.; Ben-Zvi, A.; Bilenca, A. High-sensitivity and high-specificity biomechanical imaging by stimulated Brillouin scattering microscopy. Nat. Methods 2020, 17, 913–916.
  21. Freudiger, C.W.; Min, W.; Saar, B.G.; Lu, S.; Holtom, G.R.; He, C.; Tsai, J.C.; Kang, J.X.; Xie, X.S. Label-Free Biomedical Imaging with High Sensitivity by Stimulated Raman Scattering Microscopy. Science 2008, 322, 1857–1861.
  22. Scarponi, F.; Mattana, S.; Corezzi, S.; Caponi, S.; Comez, L.; Sassi, P.; Morresi, A.; Paolantoni, M.; Urbanelli, L.; Emiliani, C.; et al. High-Performance Versatile Setup for Simultaneous Brillouin-Raman Microspectroscopy. Phys. Rev. X 2017, 7, 031015.
  23. Krüger, J.K. Optical Techniques to Characterize Polymer Systems; Bassler, H., Ed.; Elsevier: New York, NY, USA, 1989; 610p.
  24. Krüger, J.K.; Embs, J.; Brierley, J.; Jiménez, R. A new Brillouin scattering technique for the investigation of acoustic and opto-acoustic properties: Application to polymers. J. Phys. D Appl. Phys. 1998, 31, 1913–1917.
  25. Mutti, P.; Bottani, C.; Ghislotti, G.; Beghi, M.; Briggs, G.; Sandercock, J. Surface Brillouin Scattering—Extending Surface Wave Measurements to 20 GHz. In Advances in Acoustic Microscopy; Springer: Boston, MA, USA, 2011.
  26. Sebastian, T.; Schultheiss, K.; Obry, B.; Hillebrands, B.; Schultheiss, H. Micro-focused Brillouin light scattering: Imaging spin waves at the nanoscale. Front. Phys. 2015, 3.
More
ScholarVision Creations