Extinction-Coefficient Modulation of MoO3 Films: Comparison
Please note this is a comparison between Version 2 by Beatrix Zheng and Version 1 by Michael Morales Luna.

This entry focused on the application of the effective medium theory to describe the extinction coefficient (Qext) in molybdenum trioxide (MoO3) doped with different kinds of plasmonic nanoparticles, such as silver (Ag), gold (Au), and copper (Cu). Usually, in studies of these materials, it is normal to analyze the transmission or absorption spectra. However, the effect of this type or size of nanoparticles on the spectra is not as remarkable as the effect that is found by analyzing the Qext of MoO3. It was shown that the β-phase of MoO3 enhanced the intensity response of the Qext when compared to the α-phase of MoO3. With a nanoparticle size of 5 nm, the Ag-doped MoO3 was the configuration that presents the best response in Qext. On the other hand, Cu nanoparticles with a radius of 20 nm embedded in MoO3 was the configuration that presented intensities in Qext similar to the cases of Au and Ag nanoparticles. Therefore, implementing the effective medium theory can serve as a guide for experimental researchers for the application of these materials as an absorbing layer in photovoltaic cells. 

  • extinction coefficient
  • effective medium theory
  • solar cells

1. Absorbance and Extinction Coefficients of MoO3 Thin Films Doped by Resonant NPs

1.1. α-Phase of MoO

3

Doped with Ag, Au, and Cu-NPs

Figure 21a,b, depicts the absorbance and the extinction coefficients; respectively, at different thicknesses of the un-doped MoO3 thin film at the α-phase.
Figure 21. (a) Absorbance coefficient for different thicknesses of the MoO3 thin film without resonant NPs. (b) Extinction coefficient for different thicknesses of the un-doped MoO3 thin film.
As Figure 21 shows, there is no great difference in the absorbance spectra at different thicknesses of the MoO3 thin films. However, greater changes can be seen in the extinction coefficient. One thing that is important to highlight in the absorbance spectra is that it shows a shift exactly in the absorbance zero value. This absorbance zero value means that at this wavelength the reflected light is small compared with the transmittance. It is essential to emphasize this behavior, because if the medium was switched to a non-absorbing medium, this behavior could be modified [47][1]. Remember that the effective refractive index proposed by van de Hulst considers the whole contribution of the matrix medium (MoO3). For this oxide, the refractive index has a real and an imaginary part, which indicates that the main contribution of this phenomenon is the thin film of the MoO3. This can be seen in Figure 21, where the cases of un-doped MoO3 films are presented. The figure shows the evolution of the extinction coefficient zero value as the thickness of the film increases. It is well known that the plasmonic nanoparticles (in this case silver, gold and copper) have real and imaginary refractive indices that are also considered in the computed transmission and reflection coefficients of the system but the contribution of the metallic nanoparticles at these wavelengths can be negligible and we can conclude that this phenomenon occurs due to the molybdenum trioxide. In our case, all the calculations considered a MoO3 matrix, which is an absorbing medium. As can be seen in Figure 21a, the absorbance zero value shifts to higher wavelengths as the film thickness increases, for example, in the case of 80 nm, the absorbance zero value is at 440 nm, when the thickness is 100 nm, this value is 510 nm. It is necessary to point out that for the case of a film with a thickness of 140 nm, there are three absorbance zero values. In Figure 21a this tendency is not so clear, but in Figure 21b the phenomenon can be clearly seen, with extinction or absorption equal to zero at wavelengths of 420 nm, 520 nm, and 670 nm. On the other hand, Figure 21b depicts the evolution of the Qext where it can be seen that there is a bigger shift in where the absorbance becomes zero.
Now we examine what happens to the absorbance spectrum in a simulated orthorhombic MoO3 thin film with different thicknesses and doped with Ag–nanoparticles with different values of radii and volume filling fractions. Figure 32a,b depicts the absorbance coefficient of MoO3 thin films at different thicknesses at two different volume filling fractions, one and five percent, respectively. As can be seen in Figure 32a, the absorbance coefficient shows a peak centered at 520 nm which is characteristic of the resonant NPs, and additionally, the same peculiar behavior (redshift) in the absorbance zero value is observed as mentioned above. For example, for the 80 nm thickness, the absorbance zero value was found at 565 nm, for 10 nm of thickness this value shifts to 585 nm and for the other two cases, the absorbance zero value is not well defined. Furthermore, the SPR signal is more intense as the volume filling fraction increases, which was expected to obtain due to previous studies, see Figure 32b. Now the absorbance zero value redshift is not so marked as in the lowest volume filling fraction. As can be seen in Figure 32, the SPR signal does not suffer as much modification as the thickness of the MoO3 film increases. Due to this behavior the thickness was set at 120 nm for the following simulations.
Figure 32. Absorbance coefficient of the MoO3 thin film doped with Ag-NPs of radius of 5 nm, (a) volume filling fraction of Ag-NPs is 1% and (b) the volume filling fraction of Ag-NPs is 5%. The different thicknesses are labeled.
Figure 43a,b displays the absorbance coefficient of Ag NPs embedded in the MoO3 thin films for two different filling fractions, one and five percent, respectively. As can be seen in this figure, the variation of the nanoparticle radius significantly modifies the resonant signal; as the nanoparticle size increases, the intensity of the resonant signal decreases. The absorbance zero values in this Figure are still redshifted. In Figure 43b when the nanoparticle size increases and the volume filling fraction increases, the resonant signal increases, as was mentioned above, and the maximum of the peak undergoes a redshift around 65 nm in this case, the absorbance zero value still displays a redshift.
Figure 43. Absorbance coefficient of the MoO3 thin film doped with Ag-NPs with a thickness value of 120 nm, (a) volume filling fraction of 1% and (b) volume filling fraction of 5%. The different NPs radii are indicated.
The absorbance spectra of Au and Cu NPs show a similar behavior in both phases of MoO3 (alpha and beta) as the absorbance spectra of silver NPs. For simplicity, only the Au nanoparticle absorbance spectra was shown. Therefore, we can begin to analyze the absorbance coefficient using different radii of Au NPs. Figure 54a,b shows the absorbance coefficient of MoO3 thin films doped with Au NPs at one and five percent of the volume filling fraction, respectively. As was mentioned, Figure 54a shows similar behavior to that presented by the Ag nanoparticles embedded in the MoO3 matrix. The obtained redshift of SPR peaks is 25 nm, and the obtained shift for the absorbance zero value is 36 nm. A peculiar aspect that can see in this figure is the highest intensity of the SPR peak for a radius of 10 nm of the NPs, after this value the intensity of the SPR peaks decreases. Figure 54b displays the evolution of the absorbance as the radius increases at 5% of Au NPs, here the maximum intensity of absorbance peaks is for a radius of 10 nm. It is important to note at this point that the behavior of the absorbance spectra with the changing radii of NPs is similar to the case of MoO3 films doped with Ag NPs. Analyzing this figure, the SPR signal displays a redshift of 27 nm and the obtained redshift for the absorbance coefficient zero value is 47 nm. When Figure 54 is compared with the case of silver nanoparticles (Figure 43), the maximum value of the resonance peak is redshifted by 40 nm, which is lower than the Ag NPs case. For the absorbance zero value, the redshift is 23 nm less than the case of molybdenum trioxide doped with silver nanoparticles.
Figure 54. Absorbance coefficient of the MoO3 thin film doped with Au-NPs with a thickness of 120 nm, (a) volume filling fraction of 1% and (b) volume filling fraction of 5%. The different NPs radii are indicated.
As already mentioned, there is a dependence of the radius of the NPs on the absorbance coefficient principally in the intensity of the SPR signal. A difference of 15 nm in NP radius, shifts the resonant maximum peak around 60 nm. In this case, the thickness was fixed at 120 nm and again a redshift can be seen in the absorbance zero value from 620 to 660 nm. As was discussed, this behavior is due to the presence of the NPs that affect the shifts of the maximum absorbance peaks as the volume filling fraction increases. These characteristics in the absorption spectra indicates the need to study in a more precise way the interaction between the light and the MoO3 thin films with the extinction coefficient as an alternative to the absorbance studies. Therefore, as already mentioned, analyzing the Qext could be a novel alternative to study the behavior of the NPs embedded in the MoO3 matrix.
Figure 65a–c shows the behavior of the extinction coefficient of the MoO3 thin film doped with Ag, Au, and Cu NPs, respectively. The thickness was fixed to 120 nm and different radii of nanoparticles are displayed. The behavior of Qext is similar to the absorbance coefficient but the peak intensity in this coefficient is more intense than the absorbance. If Figure 65a, Ag NPs doped MoO3, is compared with Figure 43a, it can be seen that analyzing the extinction coefficient could be more useful for a better description of the optical properties because the effects on the spectra are amplified. From Figure 65a, the Qext zero values present a redshift of around 50 nm from the smallest radius (5 nm) to the highest radius (20 nm) additionally the maximum of the SPR peak shows a redshift of 45 nm. Figure 65b corresponds to the Au nanoparticles doped onto the MoO3 film, this figure displays a redshift of the extinction coefficient zero value of 36 nm and the obtained redshift for the maximum of the SPR, ΔSPR-α, peak is 27 nm. The ΔSPR-α value was calculated by the difference in the maximum peak value for the case of the 5nm radius nanoparticles and the maximum peak value for the 20 nm radius nanoparticles. Comparing the redshift of the Au NPs at a 1% filling fraction with the Ag NPs; using the Qext, the SPR redshift for the Au NPs is around 36 nm, while in the case of silver it is around 45 nm. Therefore, depending on the application it could be useful to change both resonances. In addition to the redshift of the resonant signal, there is also a change of intensity of the resonant signal, showing the importance of analyzing the extinction coefficient. Figure 65c displays the evolution of Qext as the radii of the nanoparticles changes for the Cu nanoparticles embedded in MoO3 films. The obtained redshift value of the SPR peak is 28 nm and the obtained shift value of the zero of extinction coefficient is 31 nm. On the other hand, the intensity increases as the radius increases up to a radius of 15 nm where the highest intensity SPR peak occurs, after this value the SPR signal decreases.
Figure 65. The extinction coefficient of the MoO3 thin film doped with (a) Ag-NPs, (b) Au-NPs, and (c) Cu-NPs for a volume filling fraction of 1%. In all spectra, the thickness was fixed to a value of 120 nm, and different NPs radii are labeled.
Figure 76a–c depicts the evolution of Qext at a fixed volume filling fraction of 5% for the Ag, Au, and Cu NPs, respectively. If these plots are compared with Figure 43b it can be seen that the intensities of the peaks are higher. Analyzing the extinction coefficient zero values for the MoO3 film doped with Ag nanoparticles, see Figure 76a, it is observed that the redshift is around 70 nm and the shift in the maximum of the SPR peaks is around 43 nm. As has been shown, the resonant NPs have an important effect on the optical properties of the MoO3 thin film. Figure 76b depicts the evolution of Qext as the radius of the Au-NPs is increased. The highest value of Qext is for NPs with a radius of 10 nm. The obtained redshifts of the maximum of the SPR peak and for the extinction coefficient zero value are 26 and 47 nm, respectively. Figure 76c shows the Qext evolution for a volume filling fraction of 5% of copper nanoparticles with different nanoparticles radius. As was observed in the other cases, the intensity of the SPR signals are greater than the ones shown in Figure 65c. It is evident that the MoO3 film doped with 5% of Cu NPs with a radius of 15 nm, is the sample that shows the most intense SPR signal. This behavior cannot be observed for gold and silver nanoparticles, so from these results, it can be seen that the nanoparticle radius correlates with the maximum SPR signal intensity and additionally with the type of nanoparticle embedded in MoO3 film. Hence, in the α-phase of MoO3, the intensity of the SPR signal in the extinction coefficient was modified by the presence of different radii of nanoparticles. In the case of Ag NPs doped MoO3 thin films, the signal with the highest value of the SPR signal is for a sample doped with nanoparticles with a radius of 5 nm. For the Au NPs doped MoO3 thin film the highest intensity of the SPR signal is for the doped thin film with nanoparticles with a radius of 10 nm. Finally, for Cu NPs doped MoO3 thin film the best response in the SPR signal is for nanoparticles with a radius of 15 nm.
Figure 76. The extinction coefficient of the MoO3 thin film doped with (a) Ag-NPs, (b) Au-NPs, and (c) Cu-NPs for a volume filling fraction of 5%. In all spectra, the thickness was fixed to a value of 120 nm, and different NPs radii are labeled.

1.2. β-Phase of MoO

3

Doped with Ag, Au and Cu-NPs

Figure 87a–c depicts the evolution of the Qext of the β-MoO3 thin film (for a f = 1%) as the embedded nanoparticles change. The β-phase displays an amorphous structure; this feature is different from the α-phase which is displays a crystal structure. From the Figure, we can observe significant differences with respect to the α-MoO3 phase in two important points. The first one (see Figure 87a) is the redshift of the maximum resonance peak between the nanoparticles radii of 5 and 20 nm (ΔSPR-β). As can been seen, just changing the phase of the MoO3 the maximum resonance value was shifted by around 56 nm. Additionally, the extinction coefficient zero value undergoes a shift around 55 nm. The second point, is the width of the peak. To quantify this feature, the full width at half maximum (FWHM) was calculated. The obtained values range from 43.19 nm for a nanoparticle radius of 5 nm to 88.96 nm for a nanoparticle radius of 20 nm, the difference between these values being 45.77 nm (ΔFWHM-β). MoO3 doped with Au NPs, Figure 87b, displays a similar demeanor in the shift of the resonance peak to that presented in the silver nanoparticles cases. The ΔSPR-β is 39 nm, which is bigger than the case of the α-phase at 27 nm. The value of the ΔFWHM-β shift is 23.71 nm. Finally, the extinction coefficient zero value from this Figure changes by 51 nm. As we have already mentioned, the maximum resonance peak for the copper nanoparticles, undergoes a redshift from 642 nm to 679 nm (ΔSPR-β = 37 nm) for a nanoparticle radius of 5 and 20 nm, respectively for the case of 1 % of volume filling fraction, see Figure 87c. The ΔFWHM-β value was 17.08 nm which is 11.89 nm greater than the presented changes in the α-phase. The obtained zero value change of Qext in this case is 42 nm.
Figure 87. The extinction coefficient of the MoO3 thin film doped with (a) Ag-NPs, (b) Au-NPs, and (c) Cu-NPs for a volume filling fraction of 1%. In all spectra, the thickness was fixed to a value of 120 nm, and different NPs radii are labeled.
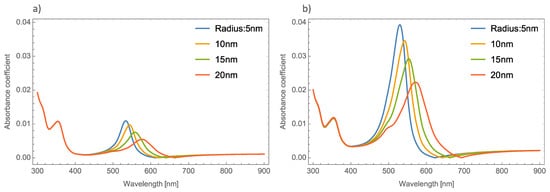
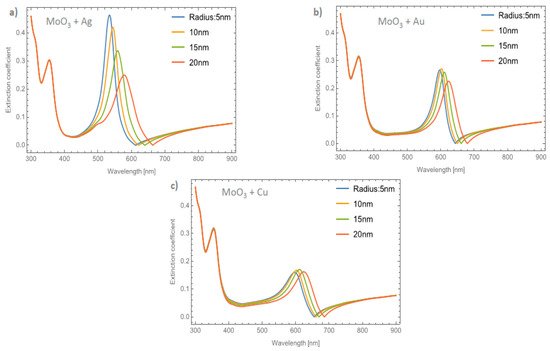
Figure 98a–c displays the evolution of the Qext of the β-MoO3 thin film as the embedded nanoparticles change at a volume filling fraction of 5%, for Ag, Au, and Cu respectively. From Figure 98a for Ag doped MoO3, the ΔSPR-β value is 54 nm. Additionally, the redshift value of the extinction coefficient zero value is 83 nm and the obtained ΔFWHM-β value for this case is 40.63 nm. As can been seen, the redshift value on the maximum resonant peak and the FWHM values of the peaks are strongly affected by the type and features of the nanoparticle. For the MoO3 doped with Au nanoparticles, see Figure 98b, the ΔSPR-β and ΔFWHM-β values are 37 and 24.01 nm, respectively. The change in the extinction coefficient zero values for this case is 81 nm. 
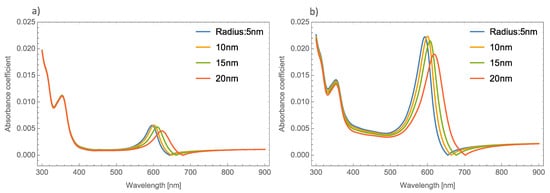
Figure 98c displays the evolution of the Qext as the nanoparticle radius changes at 5% of Cu NPs. The obtained values are ΔSPR-β = 36 nm, the Qext zero value shows a shift of 58 nm, and finally the ΔFWHM-β = 17.72 nm. Notably, the behavior of the copper NPs that was presented in the α-phase is not present in this case. For the α-phase analysis there is an increase in the SPR signal intensity with the maximum depending on the doping nanoparticles used and the radius of the nanoparticles. In the β-phase, the maximum of the SPR signal of the extinction coefficient partially decreases as the radius of the NPs increases. As can been observed, there is a maximum for the Qext for nanoparticles of 10 nm radius. One of the most important things, in this case, is that the resonance peaks are similar to the cases of the gold nanoparticles embedded in the MoO3 films but the widths of the spectra are greater than the gold NPs case. For the silver and gold NPs, the resonance peaks are narrower than the resonance peaks associated with the copper NPs. This demeanor in the extinction coefficient makes the copper NPs a good candidate for solar radiation absorber layer applications as in solar cells or solar condensers, instead of using silver or gold nanoparticles as dopants which are more expensive than copper nanoparticles. So, the range of the absorbance response of the MoO3 thin films doped with Cu NPs could be greater than the Au or Ag doped MoO3 thin films due to the wider extinction coefficient peaks covering more wavelengths of the spectrum.
Figure 98. The extinction coefficient of the MoO3 thin film doped with (a) Ag-NPs, (b) Au-NPs, and (c) Cu-NPs for a volume filling fraction of 5%. In all spectra, the thickness was fixed to a value of 120 nm, and different NPs radii are labeled.
Table 1 is presented where the resonant peak redshift values of the MoO3 thin films doped with different types and characteristics of NPs, as labeled in the table, are reported. A demeanor that is easy to observe from this table is that the Ag nanoparticles present the highest ΔSPR values compared to the Au and Cu nanoparticles. On the other hand, the MoO3 thin films doped with Cu nanoparticles display the lowest changes in the ΔSPR values in both phases of MoO3. As a complement to the discussion and to Table 1, Table 2 is reported, where the change in the FWHM values can be seen for the different doping configurations of the MoO3 thin film. From this table, it can be seen that the greatest broadening of the SPR signal occurs for Ag nanoparticles, as the radius of the nanoparticles increases and when the MoO3 is in its beta phase. In the same way as was observed for the displacement of the maximum resonant peak, the FWHM values that demonstrated lower changes are the cases of MoO3 thin films doped with Cu NPs.
Table 1.
Centered resonant peak values at different phases of MoO
3
thin films doped with different nanoparticles at different volume filling fractions (
f).
).
  Resonant Peak Redshift [nm]
  α-Phase Radii NPsβ-Phase Radii NPs
Nanoparticlef (%)5101520ΔSPR-α
Nanoparticlef (%)5101520Δ5FWHM-101520ΔSPR-β
α
5101520ΔFWHM-β
Ag15355455595804559761063065356
Ag137.1240.4450.865.8128.6943.1951.2366.1588.9645.7735325425565764459460662665056
42.24553154155457443593
560546.9262464754
49.4461.1377.8530.9353.5259.6272.9994.1540.63Au15976036116242764265166468139
Au138.9238.7842.9451.5112.5937.3838.5745.2661.0923.7135966016096222664064866167838
342.5742.6546.9256.7714.2040.3342.2148.6864.0923.765594
56006086202663964866067637
45.6145.8649.8960.3714.7643.9646.2652.9867.9724.01Cu16006056136262664265066367937
Cu161.6260.5762.266.815.1958.5259.0763.8375.617.083598604
36126252764.5264064866167737
63.9966.155976026106232663964765967536
Table 2.
Full width at half maximum values of resonant peaks at different phases of MoO
3
thin films doped with different nanoparticles at different volume filling fractions (
f).
).
  Full Width at Half Maximum (FWHM) [nm]
  α-Phase Radii NPsβ-Phase Radii NPs
341.9444.8956.5572.1430.2047.6854.1468.5289.92
71.56
7.04
57.57
58.563.6174.4916.92
567.1166.8869.1575.318.2060.0161.1666.5277.7317.72

References

  1. Ortiz, G.P.; Mochán, W.L. Nonadditivity of Pointing vector within opaque media. J. Opt. Soc. Am. A 2005, 22, 2827–2837.
More