Unicompartmental knee arthroplasty (UKA) is a valid treatment for end-stage knee osteoarthritis (OA), affecting a single femoro-tibial compartment. The popularity of unicompartmental knee replacement (UKR) has increased as excellent functional outcomes and survival have been reported in long-term follow-up studies. UKA has important advantages compared to total knee arthroplasty (TKA), including lower intraoperative blood loss and risk of transfusionas well as accelerated recovery.
- unicompartmental knee replacement
- obesity
- body mass index
- revisions
- infections
1. Introduction
Unicompartmental knee arthroplasty (UKA) is a valid treatment for end-stage knee osteoarthritis (OA), affecting a single femoro-tibial compartment [1]. The popularity of unicompartmental knee replacement (UKR) has increased as excellent functional outcomes and survival have been reported in long-term follow-up studies. UKA has important advantages compared to total knee arthroplasty (TKA), including lower intraoperative blood loss and risk of transfusion [2][3][2,3] as well as accelerated recovery [4]. In addition, UKA is associated with a decreased length of stay in hospital, lower readmission rates [5], lower infection rates and fewer major medical complications, such as thromboembolism, stroke and myocardial infarction, compared to patients undergoing TKA [6]. Some authors have reported that UKA produces more natural knee biomechanics and healing of physiological gait pattern [7], with superior patient-reported clinical and functional outcomes [8][9][10][11][8,9,10,11]. Despite these advantages, data from national joint registries showed a higher risk or revision in patients undergoing UKA [12]. Correct patient selection is paramount to achieve good outcomes for UKA, reducing the risk of UKA failure and revision surgery. According to the Kozinn and Scott criteria proposed in 1989, body weight over 82 kg is a contraindication to UKA [13]. More recently, it has been demonstrated that many of the “traditional” contraindications to UKA are not necessary, including a high BMI [14][15][16][14,15,16]. However, the role of BMI and its influence on the results of UKA and TKA is still being debated. Over the last few decades, the number of obese patients needing treatment for end-stage knee arthritis has significantly increased. Body weight has been shown as a modifiable risk factor for knee osteoarthritis and disease progression [17][18][19][17,18,19]. In addition, adverse events such as dislocation, aseptic loosening, superficial and deep infection and revision surgery are more common in obese patients undergoing TKA [20][21][22][20,21,22]. In contrast, the impact of obesity on the results of UKA is still unclear, with some surgeons offering UKA to both obese and non-obese patients, while others consider a high BMI as a contraindication and a reason of concern for potential early failure. The aim of this systematic review and meta-analysis is to compare the results of obese and non-obese patients in terms of clinical and functional scores and risk of revision. Our hypothesis is that a higher BMI would be associated with lower functional outcome scores and higher risk of septic and aseptic failures.
2. Analysis on Results
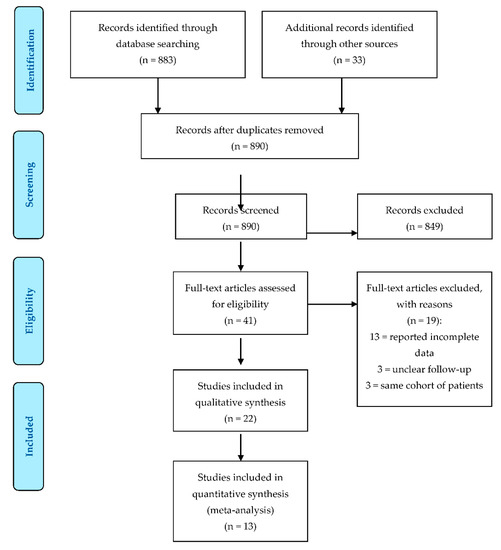
The PRISMA flowchart for study selection is shown in Figure 1 . The literature search resulted in a total of 916 references. After abstract evaluation, 875 papers were excluded due to duplication (26) or being off-topic (849). After full-text evaluation, 16 further papers were excluded because they did not meet the inclusion criteria or reported incomplete data. Three studies [15][23][24][15,24,25] reported the results of the same cohort (or similar cohorts) of patients. When present in the same analysis, only the study with the longest follow-up was considered. Therefore, 22 papers were included in the final systematic review: 12 of these studies were retrospective studies [25][26][27][28][29][30][31][32][33][34][35][36][26,27,28,29,30,31,32,33,34,35,36,37], 5 were prospective studies [37][38][39][40][41][38,39,40,41,42] and 5 were case series [24][42][43][44][45][25,43,44,45,46]. Thirteen studies showed adequate information on revisions and functional outcomes to be included in the meta-analysis.
Patient demographics for each study are summarized in Table 1 . Eleven studies [24][25][26][27][28][29][32][34][37][38][41][25,26,27,28,29,30,33,35,38,39,42] provided mean age, mean BMI and mean follow-up time for all BMI subgroups. Other studies reported mean age, BMI or follow-up time for the whole study population and not for each BMI subgroup. Two studies [42][44][43,45] only considered patients with BMI > 40 and BMI > 30, respectively. One study [27][28] divided patients according BMI but did not report the mean BMI of each subgroup. One study [30][31] did not report the number of procedures, mean age or mean BMI but only the division of patients according to BMI and rate of revision. The reported follow-up periods ranged from a minimum of 2 years to a maximum of 12 years.
| Study | Year | Study Design | LOE | Cohort | Patients | Number of UKA | Mean Age, Years (Range) | Mean BMI, kg/m2 (Range) | Mean Follow-Up (Range) |
|---|---|---|---|---|---|---|---|---|---|
| Nettrour et al. | 2019 | RS | II | Not Morbidly Obese (BMI < 40) | 81 | 101 | 57.6 ± 8.3 (40–83) | 33.1 ± 5 (20–39) | 3.5 ± 1.3 years (2–6.8) |
| Morbidly Obese (BMI ≥ 40) | 71 | 89 | 55.3 ± 9.1 (40–79) | 45.8 ± 5.6 (>40) | 3.2 ± 1.1 years (2–6.8) | ||||
| Polat et al. | 2019 | RS | II | Normal and Overweight (BMI < 30) | 86 | 26 | 61.5 ± 7.3 | 27.3 ± 2.3 | 42.7 ± 14.1 months |
| Obese (BMI = 30–34.9) | 40 | 60.5 ± 7.7 | 32.7 ± 1.5 | 40.6 ± 13.5 months | |||||
| Morbidly Obese (BMI ≥ 35) | 38 | 59.0 ± 7.1 | 40.9 ± 5.6 | 53.9 ± 12.7 months | |||||
| Seth et al. | 2019 | CS | IV | Morbidly Obese (BMI ≥ 40) | 103 | 121 | 58 (43–75) | 43 (40–51) | 7 years (2 months–15 y) |
| Molloy et al. | 2019 | PS | III | Normal (BMI < 25) | 202 | 207 | 70.3 ± 10 | 22.6 ± 3 | 10.2 years (5–16) |
| Overweight (BMI = 25–29.9) | 427 | 433 | 66.4 ± 10 | 27.3 ± 1 | |||||
| Obese (BMI = 30–34.9) | 218 | 220 | 64.9 ± 9 | 32.1 ± 1 | |||||
| Morbidly Obese (BMI ≥ 35) | 94 | 96 | 61.7 ± 8 | 39.0 ± 4 | |||||
| Affatato et al. | 2019 | RS | III | Normal (BMI < 30) | 3976 | 3250 | 67.8 (24–90) | NR | 6.5 years (0–16.3) |
| Obese (BMI = 30–39.9) | 1636 | 65.7 (28–89) | NR | ||||||
| Morbidly Obese (BMI ≥ 40) | 78 | 61.2 (47–79) | NR | ||||||
| Xu et al. | 2019 | PS | I | Control (BMI < 30) | 142 | 142 | 62.4 ± 7.8 | 25.6 ± 2.9 | minimum 10 years |
| Obese (BMI≥ 30) | 42 | 42 | 56.5 ± 6.4 | 33.4 ± 3 | |||||
| Venkatesh et al. | 2019 | PS | I | BMI < 30 | 148 | 117 | 61.7 (44–80) | 29.2 kg/m2 (21–38) | 5.6 years (2–10) |
| BMI ≥ 30 | 58 | ||||||||
| Plate et al. | 2017 | CS | IV | Underweight (BMI < 18.5) | 672 | 1 | 64 ± 11 | 32.1 ± 6.5 | 34.6 ± 7.8 months |
| Normal (BMI = 18.5–24.9) | 91 | ||||||||
| Overweight (BMI = 25–29.9) | 229 | ||||||||
| Obese (BMI = 30–34.9) | 227 | ||||||||
| Severely Obese (BMI = 35–39.9) | 115 | ||||||||
| Morbidly Obese (BMI = 40–44.9) | 42 | ||||||||
| Super Obese (BMI ≥ 45) | 41 | ||||||||
| Woo et al. | 2017 | RS | II | Normal (BMI <25) | 230 | 230 | 65 ± 8 | 22.6 ± 1.8 | 5.4 years (2.5–8.5) |
| Overweight (BMI = 25–29.9) | 289 | 289 | 62 ± 8 | 27.4 ± 1.3 | |||||
| Obese (BMI = 30–34.9) | 124 | 124 | 61 ± 8 | 31.9 ± 1.4 | |||||
| Severely Obese (BMI = 35–39.9) | 30 | 30 | 58 ± 9 | 38.5 ± 3.6 | |||||
| Zengerink et al. | 2015 | RS | II | Not Obese (BMI < 30) | 122 | 63 | 60.0 (± 8.1) | 26.9 (± 2.3) | 3.9 years (2.0–12.2) |
| Obese (BMI ≥ 30) | 64 | 60.9 (± 6.6) | 33.6 (± 3.2) | 5.1 years (2.0–10.8) | |||||
| Kandil et al. | 2015 | RS | II | Non-Obese (BMI < 30) | 12,928 | NR | NR | NR | 7 years |
| Obese (BMI = 30–39.9) | 1823 | NR | NR | NR | |||||
| Morbidly Obese (BMI ≥ 40) | 1019 | NR | NR | NR | |||||
| Cepni et al. | 2014 | CS | IV | BMI > 30 | 67 | 67 | 61 ± 7.3 | 35.7 ± 2.6 | 67.5 months ± 15.4 |
| Murray et al. | 2013 | CS | IV | Normal (BMI < 25) | 2438 | 378 | 69 (38–91) | 23 (15–24.9) | 4.6 years (1–12) |
| Overweight (BMI = 25–29.9) | 856 | 65 (33–89) | 27 | ||||||
| Obese (BMI = 30–34.9) | 712 | 61 (34–88) | 32 | ||||||
| Severely Obese (BMI = 35–39.9) | 286 | 61 (34–87) | 37 | ||||||
| Morbidly Obese (BMI = 40–44.9) | 126 | 58 (41–87) | 42 | ||||||
| Super Obese (BMI ≥ 45) | 80 | 59 (41–78) | 50 (45–69) | ||||||
| Thompson et al. | 2013 | RS | II | BMI < 35 | 173 | 229 | 66 (33–89) | 29.3 (18.4–48.7) | 2 years |
| BMI ≥ 35 | 32 | ||||||||
| Cavaignac et al. | 2013 | RS | II | Not Obese (BMI < 30) | 254 | 200 | 66.5 (39–92) | 27 (19–29) | 12 years (7–22) |
| Obese (BMI ≥ 30) | 90 | 65.8 (55–84) | 34 (30–43.2) | 11.4 years (7–17) | |||||
| Xing et al. | 2012 | RS | II | BMI < 30 | 140 | 178 | 67 (36–90) | 28.8 (19.7–48.5) | 54 months (24–77) |
| BMI = 30–34.9 | |||||||||
| BMI = 35–39.9 | |||||||||
| BMI ≥ 40 | |||||||||
| Bonutti et al. | 2011 | RS | II | Not Obese (BMI < 35) | 33 | 40 | 68 (48–79) | 28 (23–34) | 3 years (2–7) |
| Obese (BMI ≥ 35) | 34 | 40 | 65 (45–81) | 38 (35–47) | 3 years (2–6) | ||||
| Kuipers et al. | 2010 | RS | II | BMI < 30 | 437 | 437 | 62.8 (39.3–84.6) | 30.1 (17.7–47.3) | 2.6 years (0.1–7.9) |
| BMI ≥ 30 | |||||||||
| Seyler et al. | 2009 | PS | IV | Not Obese (BMI < 30) | 68 | 58 | 72 (44–91) | 27 (17–39) | 60 months (24–68) |
| Obese (BMI ≥ 30) | 22 | ||||||||
| Naal et al. | 2009 | RS | II | Normal (BMI = 18.5–24.9) | 77 | 13 | 66 (46–84) | 27.8 (20.2–39.2) | 2 years |
| Overweight (BMI = 25–29.9) | 47 | ||||||||
| Obese (BMI = 30–34.9) | 23 | ||||||||
| Berend et al. | 2005 | CS | IV | Not Obese (BMI < 32) | 61 | 73 | 66.3 (43–83) | 31.65 (19–50) | 40 months (24–69) |
| Obese (BMI ≥ 32) | |||||||||
| Mohammad et al. | 2021 | PS | I | Normal (BMI = 18.5–24.9) | 756 | 186 | 69.1 ± 10.4 | 23.2 ± 1.4 | 6.6 years (5–10) ± 2.7 |
| Overweight (BMI = 25–29.9) | 434 | 66.5 ± 10.1 | 27.5 ± 1.4 | ||||||
| Obese Class 1 (BMI = 30–34.9) | 213 | 64.6 ± 9.4 | 32.2 ± 1.4 | ||||||
| Obese Class 2 (BMI ≥ 35) | 127 | 63.6 ± 8.6 | 38.3 ± 3.5 |
Survival rate, revision rate and cause of revision are described in Table 23 . Not all studies reported survival rate or distinguished revision causes by patient BMI subgroup.
| Study | Cohort | Survival Rate | Number of Revision (%) | Causes of Failure, Reoperation |
|---|---|---|---|---|
| Nettrour | Not Morbidly Obese (BMI < 40) | NR | 6 (6%) | Minor procedures-aseptic: 2 (2%) |
| Lateral/anterior compartment progression: 1 (1%) | ||||
| Loose tibial component: 2 (2%) | ||||
| Infection: 1 (1%) | ||||
| Morbidly Obese (BMI ≥ 40) | NR | 19 (21.3%) | Minor procedures-aseptic: 3 (3.4%) | |
| Lateral/anterior compartment progression: 7 (7.8%) | ||||
| Bearing instability: 5 (5.6%) | ||||
| Loose tibial component: 2 (2.2%) | ||||
| Infection: 2 (2.2%) | ||||
| Polat | Normal and Overweight (BMI < 30) | NR | 0 | - |
| Obese (BMI = 30–34.9) | NR | 3 (27%) | Tibial + femoral loosening: 3 | |
| Morbidly Obese (BMI ≥ 35) | NR | 8 (72.7%) | Tibial loosening: 3 | |
| Tibial + femoral loosening: 3 | ||||
| Tibial component collapse: 2 | ||||
| Seth | Morbidly Obese (BMI ≥ 40) | 91.7% at 2 years, 86.3% at 5 years | 19 | Improper patient selection: 1 |
| OA progression: 4 | ||||
| Issue in technique: 9 | ||||
| Unexplained pain: 2 | ||||
| Aseptic loosening of tibial component: 2 | ||||
| Traumatic liner dislocation: 1 | ||||
| Molloy | Normal (BMI < 25) | 92% at 10 years | 13 (6.3%) | OA progression: 26 |
| Unexplained pain: 7 | ||||
| Overweight (BMI = 25–29.9) | 95% at 10 years | 18 (4.2%) | Bearing dislocation: 7 | |
| Infection: 6 | ||||
| Obese (BMI = 30–34.9) | 94% at 10 years | 10 (4.5%) | Aseptic loosening: 2 | |
| Instability: 1 | ||||
| Morbidly Obese (BMI ≥ 35) | 93% at 10 years | 6 (6.3%) | Malposition: 1 | |
| ACL injury: 1 | ||||
| Unknown: 1 | ||||
| Affatato | Normal (BMI < 30) | 92.6% at 5 years, 87.4% at 10 years | 265 (8.1%) | Total aseptic loosening: 121 |
| Pain without loosening: 53 | ||||
| Tibial aseptic loosening: 35 | ||||
| Septic loosening: 17 | ||||
| Femoral aseptic loosening: 16 | ||||
| Insert wear: 12 | ||||
| Breakage of prosthesis: 7 | ||||
| Dislocation: 4 | ||||
| Obese (BMI = 30–39.9) | 91.4% at 5 years, 86.7% at 10 years | 145 (8.8%) | Total aseptic loosening: 55 | |
| Pain without loosening: 41 | ||||
| Tibial aseptic loosening: 27 | ||||
| Septic loosening: 12 | ||||
| Femoral aseptic loosening: 1 | ||||
| Insert wear: 1 | ||||
| Breakage of prosthesis: 3 | ||||
| Dislocation: 5 | ||||
| Morbidly Obese (BMI ≥ 40) | 95.5% at 5 years, 87.5% at 10 years | 5 (6.4%) | Total aseptic loosening:2 | |
| Pain without loosening:1 | ||||
| Tibial aseptic loosening:1 | ||||
| Dislocation:1 | ||||
| Xu | Control (BMI < 30) | 98.6% at 10 years | 2 | OA progression: 2 |
| Obese (BMI ≥ 30) | 88.1% at 10 years | 5 | OA progression: 2 | |
| Subsidence of tibial component: 2 | ||||
| Polyetilene wear:1 | ||||
| Plate | Underweight (BMI < 18.5) | NR | 0–0 | Revision to TKA: Persistent knee pain (46%), Unknown (21%), Tibial component loosening (12%), Progression of DJD to adjacent compartment (9%), Tibial component subsidence (7%), Infection (5%) |
| Normal (BMI = 18.5–24.9) | 2 (2.2%)–1 (1.1%) | |||
| Overweight (BMI = 25–29.9) | 14 (6.1%)–3 (1.3%) | |||
| Obese (BMI = 30–34.9) | 13 (5.7%)–4 (1.8%) | Conversion from InLay to OnLay: Tibial component subsidence (46%), Tibial component loosening (27%), Persistent knee pain (9%), Undersized tibial component (9%), Infection (9%) | ||
| Severely Obese (BMI = 35–39.9) | 10 (8.7%)–2 (1.7%) | |||
| Morbidly Obese (BMI = 40–44.9) | 4 (9.5%)–0 | |||
| Super Obese (BMI ≥ 45) | 0–1 (2.4%) | |||
| Woo | Normal (BMI < 25) | NR | 1 | Subsidence: 1 |
| Overweight (BMI = 25–29.9) | 4 | OA progression: 3 | ||
| Persisiting pain: 1 | ||||
| Obese (BMI = 30–34.9) | 2 | OA progression: 2 | ||
| Severely Obese (BMI = 35–39.9) | 2 | OA progression: 1 | ||
| Fracture: 1 | ||||
| Zengerink | Not Obese (BMI < 30) | 87% | 18 | Unexplained pain: 8 |
| OA progression: 2 | ||||
| Instability: 3 | ||||
| Aseptic loosening: 2 | ||||
| Obese (BMI ≥ 30) | Traumatic loosening of tibial component: 1 | |||
| Atraumatic migration of tibial component: 1 | ||||
| Unknown reason: 1 | ||||
| Kandil | Non-Obese (BMI < 30) | NR | 345 (2.7%) | Major complications: 303 (2.3%) |
| Minor complications: 532 (4.1%) | ||||
| Local complications: 439 (3.4%) | ||||
| Medical complications: 256 (2.0%) | ||||
| Obese (BMI = 30–39.9) | 84 (4.6%) | Major complications: 97 (5.3%) | ||
| Minor complications: 179 (9.8%) | ||||
| Local complications: 68 (3.7%) | ||||
| Medical complications: 142 (7.8%) | ||||
| Morbidly Obese (BMI ≥ 40) | 57 (5.6%) | Major complications: 73 (7.2%) | ||
| Minor complications: 132 (13%) | ||||
| Local complications: 68 (6.7%) | ||||
| Medical complications: 106 (10.4%) | ||||
| Cepni | BMI > 30 | 95.6% at 5 years | 3 | Insert dislocation: 3 |
| Murray | Normal (BMI < 25) | 97.6% at 5 years, 94.9% at 10 years | 9 | Unexplained pain: 3 |
| Infection: 2 | ||||
| OA progression: 2 | ||||
| Aseptic loosening: 1 | ||||
| Bearing dislocation: 1 | ||||
| Overweight (BMI = 25–29.9) | 96.8% at 5 years, 93% at 10 years | 25 | Unexplained pain: 7 | |
| Aseptic loosening: 5 | ||||
| Infection: 4 | ||||
| OA progression: 3 | ||||
| Bearing dislocation: 3 | ||||
| Traumatic ACL rupture: 1 | ||||
| AVN of lateral femoral condyle: 1 | ||||
| Fracture: 1 | ||||
| Obese (BMI = 30–34.9) | 95.3% at 5 years, 95.3% at 10 years | 18 | Unexplained pain: 6 | |
| Aseptic loosening: 5 | ||||
| OA progression: 3 | ||||
| Bearing dislocation: 3 | ||||
| Periprothetic fracture: 1 | ||||
| Severely Obese (BMI = 35–39.9) | 93.8% at 5 years, 93.8% at 10 years | 7 | Aseptic loosening: 4 | |
| Unexplained pain: 1 | ||||
| Infection: 1 | ||||
| Bearing dislocation: 1 | ||||
| Morbidly Obese (BMI = 40–44.9) | 95.2% at 5 years | 4 | Aseptic loosening: 2 | |
| Unexplained pain: 1 | ||||
| Infection: 1 | ||||
| Super Obese (BMI ≥ 45) | 100% at 5 years | 0 | - | |
| Thompson | BMI < 35 BMI ≥ 35 | NR | 8 (3.5%) | OA progression: 2 |
| Tibial plateau fracture: 2 | ||||
| Persistent pain: 2 | ||||
| Subsidence of tibial component: 1 | ||||
| Malposition of components: 1 | ||||
| Cavaignac | Not Obese (BMI < 30) | 92% at 10 years | 11 | Aseptic tibial loosening: 3 |
| OA progression: 4 | ||||
| Polyethylene wear: 1 | ||||
| Unexplained pain: 1 | ||||
| Impingement with LCM: 1 | ||||
| Impingement with intercondylar eminence: 1 | ||||
| Obese (BMI ≥ 30) | 94% at 10 years | 4 | OA progression: 3 | |
| Unexplained pain: 1 | ||||
| BMI < 30 | 96.2% | 6 (3.8%) | Implant loosening: 3 | |
| (BMI = 30–34.9) | Persisiting pain: 1 | |||
| BMI = 35–39.9 | OA progression: 2 | |||
| BMI ≥ 40 | ||||
| Bonutti | Not Obese (BMI < 35) | 88% | 5 | Progression of OA: 2 |
| Tibial component loosening: 2 | ||||
| Intractabile pain: 1 | ||||
| Obese (BMI ≥ 35) | 100% | 0 | ||
| Kuipers | BMI > 30 BMI ≥ 30 | 84.7% at 5 years | 45 (10.3%) | Persisiting pain: 13 |
| Aseptic loosening: 12 | ||||
| OA progression: 9 | ||||
| Recurrent luxation of meniscal bearing: 4 | ||||
| Deep infection: 2 | ||||
| Periprosthetic fracture: 3 | ||||
| Traumatic instability of MCL: 1 | ||||
| Malpositioning of tibial component: 1 | ||||
| Seyler | Not Obese (BMI < 30) | 92% at 5 years, 84% at 10 years | 5 | Aseptic loosening: 2 |
| Patellofemoral/lateral pain: 3 | ||||
| Obese (BMI ≥ 30) | 4 | Polyethylene wear: 2 | ||
| Progression of OA: 1 | ||||
| Tibial plateau fracture: 1 | ||||
| Naal | Normal (BMI <25) | NR | 3 (3.6%) | Loosening of the tibial component: 1 |
| Overweight (BMI = 25–29.9) | Loosening of the femoral component: 1 | |||
| Obese (BMI ≥ 30) | Intractabile pain: 1 | |||
| Berend | Not Obese (BMI < 32) Obese (BMI ≥ 32) | 78% at 3 years | 16 | Deep infection: 2 (2.7%) |
| Tibial plateau fracture: 3 (4.1%) | ||||
| Intractabile pain: 4 (5.5%) | ||||
| Progression of OA: 1 (1.4%) | ||||
| Aseptic loosening: 6 (8.2%) | ||||
| Venkatesh | BMI < 30 | 96% at 10.9 years | 5 (4.27%) | Unexplained pain: 2 |
| Loosening of component: 2 | ||||
| Polyethylene wear: 1 | ||||
| BMI ≥ 30 | 2 | Unexplained pain: 2 | ||
| Mohammad | Normal (BMI < 25) | 97.3% at 10 years | 4 | Bearing dislocation: 1 |
| Tibial avascular necrosis: 1 | ||||
| Disease progression: 1 | ||||
| Lateral meniscal tear: 1 | ||||
| Overweight (BMI = 25–29.9) | 96.2% at 10 years | 13 | Bearing dislocation: 4 | |
| Disease progression: 3 | ||||
| Suspected infection: 1 | ||||
| Pain: 2 | ||||
| Loose body: 1 | ||||
| Sweling: 1 | ||||
| Wound dehiscence: 1 | ||||
| Obese (BMI = 30–34.9) | 94.8% at 10 years | 9 | Bearing dislocation: 3 | |
| Pain: 4 | ||||
| Femoral component loosening: 1 | ||||
| Disease progression: 1 | ||||
| Severely Obese (BMI = 35–39.9) | 98.3% at 10 years | 2 | Lateral tibial fracture: 1 | |
| Disease progression: 1 |
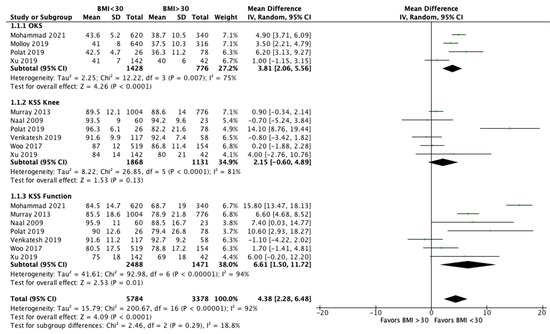
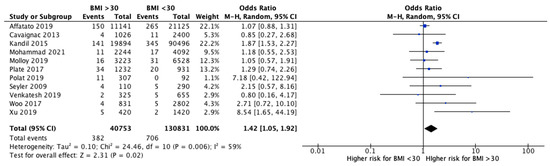
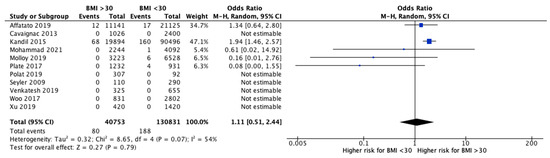
The meta-analysis performed a comparison between patients with a BMI < 30 and with a BMI > 30 for functional outcomes and revision rates. Eight studies [24][26][28][36][37][38][39][41][25,27,29,37,38,39,40,42] analyzed the clinical outcomes after UKR between obese and non-obese patients ( Figure 2 ). OKS was significantly higher in patients with a BMI < 30 compared to those with a BMI > 30 (MD 3.81, 95% CI, 2.06 to 5.56, p < 0.0001). The KSS knee showed better improvements in non-obese patients, but no significant differences (MD 2.15, 95% CI, −0.60 to 4.89, p = 0.13). KKS function increased significantly after UKA in non-obese group (MD 6.61, 95% CI, 1.50 to 11.72, p = 0.01). Finally, evaluating all the reported clinical outcomes, a significant difference was shown in favor of patients with a BMI < 30 compared to patients with BMI > 30 (MD 4.38, 95% CI, 2.28 to 6.48, p < 0.0001). Moreover, 11 studies [26][27][28][30][32][37][38][39][40][41][43][27,28,29,31,33,38,39,40,41,42,44] analyzed the revisions after UKA and showed a significantly increased likelihood for revision in patients with a BMI > 30 (OR 1.42, 95% CI, 1.05 to 1.92, p = 0.02) ( Figure 3 ). Instead, the rate of septic revisions did not show significant differences between the two groups (OR 0.90, 95% CI, 0.41 to 1.97, p = 0.79) ( Figure 4 ).
3. CDiscurrent Insightsssion
4. Conclusions
Our systematic review and meta-analysis demonstrated that the risk of revision was greater in obese patients (BMI > 30). However, the difference was lower than reported by similar studies on TKA. The risk of revision for infection in patients with a BMI > 30 was not significantly higher than that of non-obese patients. Although the improvements in OKS and KSS function were statistically significant for patients with a BMI < 30, obese and non-obese patients experienced similar improvements after UKA. Therefore, this meta-analysis suggests that all patients undergoing UKA benefit from the intervention, regardless of BMI. Accordingly, BMI should not be considered as a contraindication for UKA. However, obese patients should be informed about the increased risk of failure and inferior functional outcome of joint replacement surgery and should lose weight prior to undergoing surgery.