A common feature of tumor pathological metabolism is an increased glucose uptake, together with its fermentation to lactate, even under aerobic conditions. This behavior is known as Warburg effect. 2-deoxy-2-[18F]fluoro-D-glucose (FDG) is a glucose analog that is systematically utilized as a radioactive tracer in nuclear medicine. FDG Positron Emission Tomography (FDG-PET) is a functional imaging modality that utilizes FDG as a tracer in order to quantitative assess FDG metabolism in tumors (but other pathologies are systematically investigated as well, by means of this imaging technique). FDG-PET measures the radiation emitted by the tracer injected in the organism, and these measurements encode, in a very indirect way, two kinds of information: the localization of FDG accumulation in the body and the rate with which FDG changes its metabolic status along time. In order to decode such sophisticated information, two inverse problems must be solved: (1) Image reconstruction inverse problem: to reconstruct the spatio-temporal distribution of FDG inside the tissue by solving the integral equation that connects the FDG density to the measured radiation by means of the Radon transform. (2) Compartmental inverse problem: to model the tracer kinetics by solving the non-linear time-dependent equation that connects the tracer coefficients to the reconstructed FDG concentration.
A common feature of tumor pathological metabolism is an increased glucose uptake, together with its fermentation to lactate, even under aerobic conditions. This behavior is known as Warburg effect. 2-deoxy-2-[18F]fluoro-D-glucose (FDG) is a glucose analog that is systematically utilized as a radioactive tracer in nuclear medicine. FDG Positron Emission Tomography (FDG-PET) is a functional imaging modality that utilizes FDG as a tracer in order to quantitative assess FDG metabolism in tumors (but other pathologies are systematically investigated as well, by means of this imaging technique). FDG-PET measures the radiation emitted by the tracer injected in the organism, and these measurements encode, in a very indirect way, two kinds of information: the localization of FDG accumulation in the body and the rate with which FDG changes its metabolic status along time. In order to decode such sophisticated information, two inverse problems must be solved: (1) Image reconstruction inverse problem: to reconstruct the spatio-temporal distribution of FDG inside the tissue by solving the integral equation that connects the FDG density to the measured radiation by means of the Radon transform. (2) Compartmental inverse problem: to model the tracer kinetics by solving the non-linear time-dependent equation that connects the tracer coefficients to the reconstructed FDG concentration.
The focus of the present review is on the compartmental inverse problem.
- Positron Emission Tomography (PET)
- FDG
- tracer kinetics
- compartmental analysis
1. The Experimental Data in the Compartmental Game
[1]
[7]
[8]
[7]
[9]
[10]
t
1.1. Standardized Uptake Value
[11]

[10]
1.2. Input Function
[12][13]. In the present work, the concentration Cb of the tracer available for input to tissues is identified with the measured concentration in arterial blood, which means in particular that the bound tracer is disregarded. Considerations about bound tracer are discussed in Reference
[13]
[14]
[15]
1.3. Activity Concentration of Target Tissue
The target tissue (TT) is the tissue selected for measuring the activity concentration Ct [kBq/mL]. Specifically, the tissue response is the time course of Ct , which is computed by realizing a ROI-based analysis of a dynamical series of reconstructed PET images
[2][16]. Of course, these data are corrected for attenuation and possible systematic errors, and the resulting Ct depends on several factors like the injected dose, the shape of the IF, the characteristics of the TT, and the pato-physiological conditions of the patient.
2. The Construction of Compartmental Models
2.1. Generalities
[16]
[19]
2.2. Basic Applicability Conditions
- Transport of tracer molecules and related composites between compartments follows a first order kinetics, which ultimately leads to linear ODEs.
-
Bound tracer in blood is disregarded, and the arterial concentration of tracer available for tissue uptake is regarded as a valuable approximation of capillary concentration.
-
Tracer is administered in trace amounts. The number of injected molecules is supposed to be sufficiently high so that diffusion may described by application of a continuous model. However, such a number is not so high as to influence physiological processes and molecular interactions. In particular, tracer does not affect glucose metabolism.
-
During an experiment, physiologic conditions are in a steady state which is not affected by measurement devices of tracer concentration. This holds true, in particular, for glucose metabolism.
-
The well-mixing condition holds for each compartment. In practice, this means that equilibrium is reached in a time interval, which is rather short with respect to the time of data acquisition. As a consequence, the spatial homogeneity condition follows, which implies that the tracer concentration in each compartment depends only on time.
-
Transport of tracer molecules and related composites between compartments follows a first order kinetics, which ultimately leads to linear ODEs.
-
Bound tracer in blood is disregarded, and the arterial concentration of tracer available for tissue uptake is regarded as a valuable approximation of capillary concentration.
-
Tracer is administered in trace amounts. The number of injected molecules is supposed to be sufficiently high so that diffusion may described by application of a continuous model. However, such a number is not so high as to influence physiological processes and molecular interactions. In particular, tracer does not affect glucose metabolism.
-
During an experiment, physiologic conditions are in a steady state which is not affected by measurement devices of tracer concentration. This holds true, in particular, for glucose metabolism.
-
The well-mixing condition holds for each compartment. In practice, this means that equilibrium is reached in a time interval, which is rather short with respect to the time of data acquisition. As a consequence, the spatial homogeneity condition follows, which implies that the tracer concentration in each compartment depends only on time.
2.3. Examples
Figure 1 depicts a standard 2-compartment model (2-CM) that has been used to model the intracellular processes of phosphorylation and dephosphorylation of FDG through two compartments, Cf and Cp , accounting for free and phosphorylated tracers, respectively
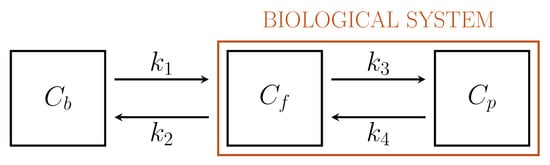
Figure 1.
[22]
[23]
[24]
Driven by biochemical reactions involving FDG molecules, a 3-compartment model (3-CM) has been developed, which is formed by the following compartments: Cf , accounting for free tracer in the cytosol and possibly in the interstitial space, Cp for phosphorylated FDG in cytosol, and Cr for phosphorylated FDG in ER
Figure 2
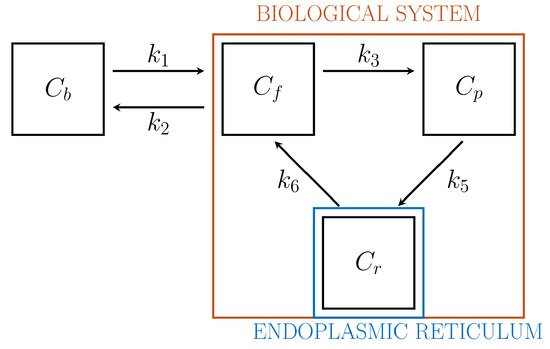
Figure 2.
In our paper we also review a number of more complex, biologically-driven comparment models, specifically devised to model FDG kinetics in a reference tissue
[26]
[9]
3. Some Numerics: Optimization Schemes
In experimental applications, the input data is given by the time series CT =CT(t) , which is determined by computing the pixel content in Regions of Interest (ROIs) of the reconstructed PET data at different time points; Cb =Cb(t) is the input function, which is also determined from PET data; and the unknown is represented by the vector k, whose components are the tracer coefficients, and byVb , the volume fraction of tissue occupied by blood. We define

where α is a constant row vector of order n, with components possibly depending on the physiological parameters. The computational problem of compartmental analysis is the one to determine, at each time point,

In this optimization equation, || · || denotes the topology with which the distance between the experimental and predicted total concentrations is measured. Naive approaches to the computational solution of such a problem are typically characterized by three
main drawbacks:
-
They typically suffer numerical instabilities related to the non-uniqueness and sensitivity limitations.
-
They may suffer local minima as the operator F is non linear and the space where possible minimizers can be searched for is typically big.
-
Particularly, in the case of three-compartment models, the number of kinetic parameters to determine is high, which implies that they are computationally demanding.
Several numerical methods have been applied for the solution of the comparment inverse problem, whose reliability and computational effectiveness depend on the choice of the topology || · || and
by the way possible prior information on the solution are encoded in the optimization process. Further, the computational algorithms utilized for solving the minimization problem typically belong to three general approaches: the deterministic, statistical, and biology-inspired ones. In our review, we provide a sketch of the main computational aspects of these three approaches, assuming that Vb is known thanks to either experimental or physiological information (the generalization to the case when also Vb is an unknown parameter is straightforward).
In order to show how some of these methods behave in action,
In experimental applications, the input data is given by the time series \( C_T = C_T(t) \), which is determined by computing the pixel content in Regions of Interest (ROIs) of the reconstructed PET data at different time points; \( C_b = C_b(t) \) is the input function, which is also determined from PET data; and the unknown is represented by the vector \( \mathbf{k} \), whose components are the tracer coefficients, and by \( V_b \), the volume fraction of tissue occupied by blood. We define
where \( \alpha \) is a constant row vector of order \( n \), with components possibly depending on the physiological parameters. The computational problem of compartmental analysis is the one to determine, at each time point,
In this optimization equation, \( \| \cdot \| \) denotes the topology with which the distance between the experimental and predicted total concentrations is measured. Naive approaches to the computational solution of such a problem are typically characterized by three
main drawbacks:
- They typically suffer numerical instabilities related to the non-uniqueness and sensitivity limitations.
- They may suffer local minima as the operator \( {\cal{F}} \) is non linear and the space where possible minimizers can be searched for is typically big.
- Particularly, in the case of three-compartment models, the number of kinetic parameters to determine is high, which implies that they are computationally demanding.
Several numerical methods have been applied for the solution of the comparment inverse problem, whose reliability and computational effectiveness depend on the choice of the topology \( \| \cdot \| \) and
by the way possible prior information on the solution are encoded in the optimization process. Further, the computational algorithms utilized for solving the minimization problem typically belong to three general approaches: the deterministic, statistical, and biology-inspired ones. In our review, we provide a sketch of the main computational aspects of these three approaches, assuming that \( V_b \) is known thanks to either experimental or physiological information (the generalization to the case when also \( V_b \) is an unknown parameter is straightforward).
In order to show how some of these methods behave in action,
Figure 3 summarizes some results obtained in the literature by using experimental measurements recorded by means of a PET scanner for small animals.
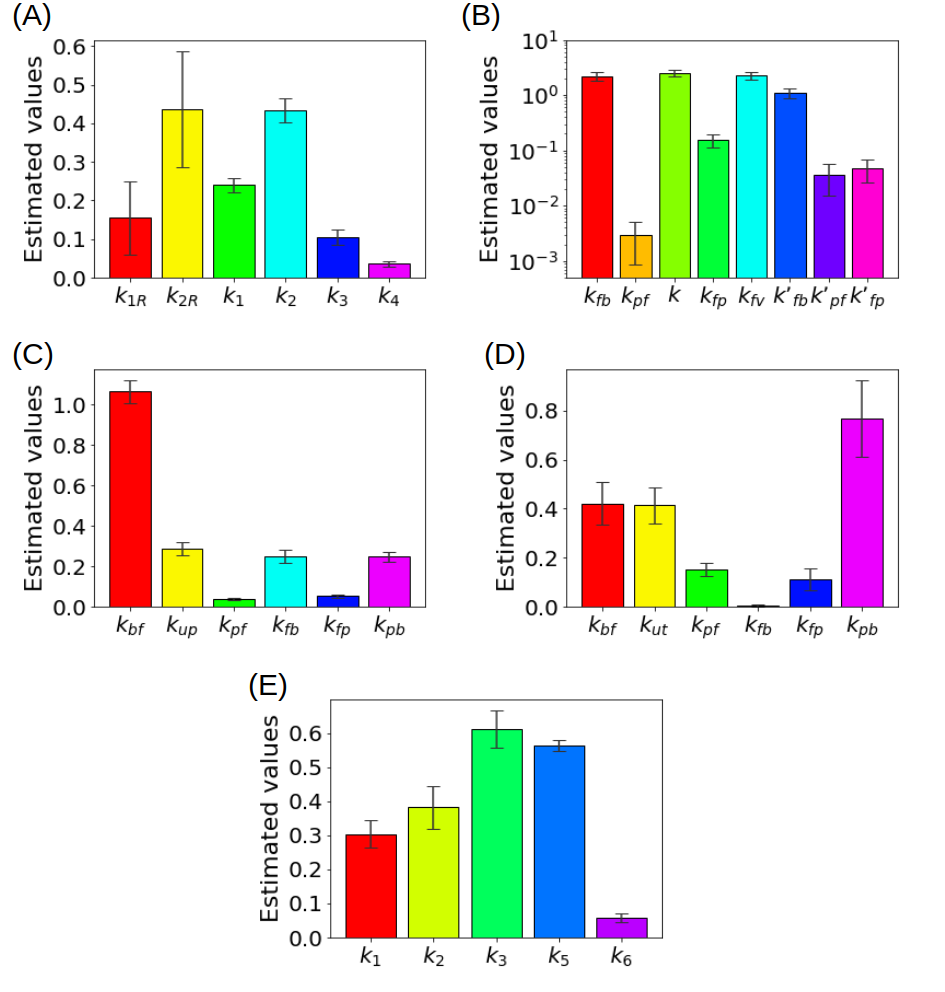
summarizes some results obtained in the literature by using experimental measurements recorded by means of a PET scanner for small animals.
Figure 3.
https://github.com/theMIDAgroup/ CompartmentalAnalysis
https://github.com/theMIDAgroup/ReferenceTissue_CompartmentalAnalysis
https://github.com/theMIDAgroup/BCM_CompartmentalAnalysis contains the Matlab code for the analysis of the 3-CM accounting for the endoplasmic reticulum.
4
3. Conclusion
Compartmental analysis is a well-established approach to the interpretation of dynamical FDG-PET data and this review paper has aimed to point out the fact that numerical algorithms for the reduction of compartmental models play a crucial role for the comprehension of cancer glucose metabolism from a quantitative viewpoint. Yet, some technical issues are still open, whose solution would imply a further significant improvement in the comprehension of glucose dynamics in cancerous tissues.
Compartmental analysis is a well-established approach to the interpretation of dynamical FDG-PET data and this review paper has aimed to point out the fact that numerical algorithms for the reduction of compartmental models play a crucial role for the comprehension of cancer glucose metabolism from a quantitative viewpoint. Yet, some technical issues are still open, whose solution would imply a further significant improvement in the comprehension of glucose dynamics in cancerous tissues.
References
- Vander Heiden, M.G.; Cantley, L.C.; Thompson, C.B. Understanding the Warburg effect: The metabolic requirements of cell proliferation. Science 2009, 324, 1029–1033.
- Cherry, S.R.; Sorenson, J.A.; Phelps, M.E. Physics in Nuclear Medicine; Elsevier Health Sciences: Amsterdam, The Netherlands, 2012.
- Muzi, M.; Freeman, S.D.; Burrows, R.C.; Wiseman, R.W.; Link, J.M.; Krohn, K.A.; Graham, M.M.; Spence, A.M. Kinetic characterization of hexokinase isoenzymes from glioma cells: Implications for FDG imaging of human brain tumors. Nucl. Med. Biol. 2001, 28, 107–116.
- Maddalena, F.; Lettini, G.; Gallicchio, R.; Sisinni, L.; Simeon, V.; Nardelli, A.; Venetucci, A.A.; Storto, G.; Landriscina, M. Evaluation of glucose uptake in normal and cancer cell lines by positron emission tomography. Mol. Imag. 2015, 14, 490–498.
- Williams, S.P.; Flores-Mercado, J.E.; Port, R.E.; Bengtsson, T. Quantitation of glucose uptake in tumors by dynamic FDG-PET has less glucose bias and lower variability when adjusted for partial saturation of glucose transport. Eur. J. Nucl. Med. Mol. Imag. Res. 2012, 2, 1–13.
- Scussolini, M.; Bauckneht, M.; Cossu, V.; Bruno, S.; Orengo, A.M.; Piccioli, P.; Capitanio, S.; Yosifov, N.; Ravera, S.; Morbelli, S.; et al. G6Pase location in the endoplasmic reticulum: Implications on compartmental analysis of FDG uptake in cancer cells. Sci. Rep. 2019, 9, 1–14.
- Garbarino, S.; Caviglia, G.; Sambuceti, G.; Benvenuto, F.; Piana, M. A novel description of FDG excretion in the renal system: Application to metformin-treated models. Phys. Med. Biol. 2014, 59, 2469.
- Signorini, M.; Paulesu, E.; Friston, K.; Perani, D.; Colleluori, A.; Lucignani, G.; Grassi, F.; Bettinardi, V.; Frackowiak, R.; Fazio, F. Rapid assessment of regional cerebral metabolic abnormalities in single subjects with quantitative and nonquantitative [18F]FDG PET: A clinical validation of statistical parametric mapping. Neuroimage 1999, 9, 63–80.
- Garbarino, S.; Vivaldi, V.; Delbary, F.; Caviglia, G.; Piana, M.; Marini, C.; Capitanio, S.; Calamia, I.; Buschiazzo, A.; Sambuceti, G. A new compartmental method for the analysis of liver FDG kinetics in small animal models. EJNMMI Res. 2015, 5, 35.
- Büsing, K.A.; Schönberg, S.O.; Brade, J.; Wasser, K. Impact of blood glucose, diabetes, insulin, and obesity on standardized uptake values in tumors and healthy organs on 18F-FDG PET/CT. Nucl. Med. Biol. 2013, 40, 206–213.
- Adams, M.C.; Turkington, T.G.; Wilson, J.M.; Wong, T.Z. A systematic review of the factors affecting accuracy of SUV measurements. AJR Am. J. Roentgenol. 2010, 195, 310–320.
- Schmidt, K.C.; Turkheimer, F.E. Kinetic modeling in positron emission tomography. Quart J. Nucl. Med. 2002, 46, 70–85.
- Schain, M.; Fazio, P.; Mrzljak, L.; Amini, N.; Al-Tawil, N.; Fitzer-Attas, C.; Bronzova, J.; Landwehrmeyer, B.; Sampaio, C.; Halldin, C.; et al. Revisiting the Logan plot to account for non-negligible blood volume in brain tissue. Eur. J. Nucl. Med. Mol. Imag. Res. 2017, 7, 1–12.
- Zanotti-Fregonara, P.; Chen, K.; Liow, J.S.; Fujita, M.; Innis, R.B. Image-derived input function for brain PET studies: Many challenges and few opportunities. J. Cer. Blood Flow Metab. 2011, 31, 1986–1998.
- Vriens, D.; de Geus-Oei, L.F.; Oyen, W.J.; Visser, E.P. A curve-fitting approach to estimate the arterial plasma input function for the assessment of glucose metabolic rate and response to treatment. J. Nucl. Med. 2009, 50, 1933–1939.
- Wernick, M.N.; Aarsvold, J.N. Emission Tomography: The Fundamentals of PET and SPECT; Elsevier: Amsterdam, The Netherlands, 2004.
- Watabe, H.; Ikoma, Y.; Kimura, Y.; Naganawa, M.; Shidahara, M. PET kinetic analysis–compartmental model. Ann. Nucl. Med. 2006, 20, 583–588.
- Lawson, R.S. Application of mathematical methods in dynamic nuclear medicine studies. Phys. Med. Biol. 1999, 44, R57–R98.
- Gunn, R.N.; Gunn, S.R.; Cunningham, V.J. Positron emission tomography compartmental models. J. Cer. Blood Flow Metab. 2001, 21, 635–652.
- Bertoldo, A.; Rizzo, G.; Veronese, M. Deriving physiological information from PET images: From SUV to compartmental modelling. Clin. Transl. Imaging 2014, 2, 239–251.
- Sokoloff, L.; Reivich, M.; Kennedy, C.; Rosiers, M.D.; Patlak, C.; Pettigrew, K.E.A.; Sakurada, O.; Shinohara, M. The [14C]deoxyglucose method for the measurement of local cerebral glucose utilization: Theory, procedure, and normal values in the conscious and anesthetized albino rat. J. Neurochem. 1977, 28, 897–916.
- Ghosh, A.; Shieh, J.J.; Pan, C.J.; Sun, M.S.; Chou, J.Y. The catalytic center of glucose-6-phosphatase. HIS176 is the nucleophile forming the phosphohistidine-enzyme intermediate during catalysis. J. Biol. Chem. 2002, 277, 32837–32842.
- Marini, C.; Ravera, S.; Buschiazzo, A.; Bianchi, G.; Orengo, A.M.; Bruno, S.; Bottoni, G.; Emionite, L.; Pastorino, F.; Monteverde, E.; et al. Discovery of a novel glucose metabolism in cancer: The role of endoplasmic reticulum beyond glycolysis and pentose phosphate shunt. Sci. Rep. 2016, 6, 1–13.
- Csala, M.; Marcolongo, P.; Lizák, B.; Senesi, S.; Margittai, É.; Fulceri, R.; Magyar, J.É.; Benedetti, A.; Bánhegyi, G. Transport and transporters in the endoplasmic reticulum. Biochim. Biophys. Acta Biomembr. 2007, 1768, 1325–1341.
- Sommariva, S.; Scussolini, M.; Cossu, V.; Marini, C.; Sambuceti, G.; Caviglia, G.; Piana, M. The role of endoplasmic reticulum in in vivo cancer FDG kinetics. PLoS ONE 2021, 16, e0252422.
- Scussolini, M.; Garbarino, S.; Piana, M.; Sambuceti, G.; Caviglia, G.; Reference tissue models for FDG-PET data: Identifiability and solvability. IEEE Trans. Rad. Plasma Med. Sci. 2018, 2, 177–186..
- Garbarino, S.; Caviglia, G.; Brignone, M.; Massollo, M.; Sambuceti, G.; Piana, M.; Estimate of FDG excretion by means of compartmental analysis and ant colony optimization of nuclear medicine data. Comput. Math. Methods Med. 2013, 2013, 793142.