Sustainable development (SD) has become a primary objective in enterprise strategy systems, and is achieved via the integration and balancing of the three dimensions of sustainable development: economic, social, and environmental [1]. Increasingly complex global-scale production, transportation networks, and value chains extend SD to entire supply chains. All the partners in a network, not only a single company, must confront future environmental challenges. The manufacturing industry accounts for 30% of Taiwan’s GDP and encompasses industries, such as IC and computer products, that are exported worldwide [2,3]. The manufacturing industry is the driving force of Taiwan’s economy, aiding its ability to meet stakeholder expectations of environmental regulations and compliance. It is critical for manufacturers to develop a high-value manufacturing strategy to ensure the sustainability of the national economy. The concept of sustainable supply chain management is very important to the business strategies of small- and medium-sized enterprises [4]. Companies can enhance added value through numerous methods, among which one of the most crucial is the enhancement of both their corporate image and customer loyalty by the demonstration of a contribution to society through products, services, or local care [5].
1. Introduction
Sustainable development (SD) has become a primary objective in enterprise strategy systems, and is achieved via the integration and balancing of the three dimensions of sustainable development: economic, social, and environmental
[1]. Increasingly complex global-scale production, transportation networks, and value chains extend SD to entire supply chains. All the partners in a network, not only a single company, must confront future environmental challenges. The manufacturing industry accounts for 30% of Taiwan’s GDP and encompasses industries, such as IC and computer products, that are exported worldwide
[2][3][2,3]. The manufacturing industry is the driving force of Taiwan’s economy, aiding its ability to meet stakeholder expectations of environmental regulations and compliance. It is critical for manufacturers to develop a high-value manufacturing strategy to ensure the sustainability of the national economy. The concept of sustainable supply chain management is very important to the business strategies of small- and medium-sized enterprises
[4]. Companies can enhance added value through numerous methods, among which one of the most crucial is the enhancement of both their corporate image and customer loyalty by the demonstration of a contribution to society through products, services, or local care
[5].
Most enterprises have recognized the importance of SD, but ambiguity about the methods of its implementation and its impact on corporate performance has hampered applications by various enterprises to establish long-term SD plans. Originally, supply chain management was perceived as process-oriented and customer-focused, with material flowing from upstream suppliers to downstream customers
[6][7][6,7]. Currently, companies are developing supply chain management strategies in order to boost supply chain cooperation in response to market changes and complexities
[8]. Supply chain management has had a positive and significant impact on sustainable performance
[9]. Therefore, most enterprises have a practical understanding of how to establish internal SD operations from an environmental perspective, including production process improvement, green procurement, and product greening.
SD is a long-term strategic objective to sustain business continuity without impacting the ability to meet the needs of future generations
[10]. Enterprises may contribute to SD through three steps: the first stage is to address their internal operations for achieving sustainability; the second stage is to develop an SD strategy, in particular, the integration of external supply chains that are conducive to SD; and the third stage is the extension of sustainable issues outside of an enterprise, something that requires an explicit commitment to social responsibility, as well as environmental and economic factors
[11]. Therefore, this study aimed to address the issue of how to increase the sustainability of supply chain cooperation and performance through the expansion of sustainable programs or activities in a company’s internal operations. Although numerous topics can be evaluated through qualitative research
[12][13][14][15][16][12,13,14,15,16], such research may be limited by the sample size. Therefore, this study used quantitative research methods to explore covariation and fitting model patterns as an intermediary in sustainability supply chain (SSC) relationships.
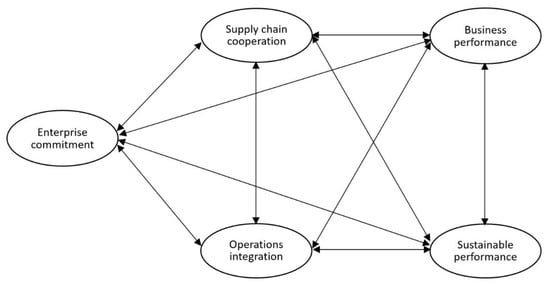
This study explored the realization of SSCs in small- and medium-sized enterprises. First, a literature review was conducted to identify the sustainable operation practices of enterprises in the context of SSCs and to develop a research framework. Second, the research framework was employed to develop questionnaires and hypotheses. Finally, the structural equation modeling was applied to analyze the research samples. Questionnaires were administered to test the fit in terms of covariation and mediation and to identify the consistency of various facets, as well as to determine the relationship between sustainable performance and business performance. The contributions of previous authors are list in Table 1. Therefore, this study developed the concept model of SEM, which is shown in Figure 1.
Figure 1. The concept model of SEM.
Table 1. The contributions of previous authors.
87]:
-
Factor loads must be higher than 0.7; however, 0.6–0.7 is acceptable under validation analysis. Values lower than 0.6 are deleted;
-
Composite reliability (CR) must be higher than 0.7 but not exceed 0.95;
-
Average variance extracted (AVE) must be higher than 0.5;
-
Square multiple correlations (SMCs) must be higher than 0.5.
| Author(s) |
Sustainability |
Enterprise |
Manufacturing |
Supply Chain |
Methods |
| Desa [1] |
Include |
Include |
Include |
Include |
|
|
|
|
The factors CR, AVE, and SMCs (
Table 35) are examined, which must be compliant with the basic requirements of CFA.
Table 35. Confirmatory factory analysis table.
| |
Model Parameter Estimation |
Convergence |
| Facial Surface |
Item |
Non-Standard Factor Load |
S.E. |
C.R. |
p |
Standardization Factor Load |
SMC |
C.R |
AVE |
| NA |
| Enterprise commitment |
A. 1 |
1.000 |
|
|
|
0.834 |
0.461 |
0.748 |
0.654 |
Chow et al. [2] |
Supply chain cooperationNA |
Include |
| A. 2 | Include |
Include |
0.458SEM |
| 1 |
|
|
|
1.126 |
0.084 |
13.426 |
*** |
0.897 |
0.805 |
Koh et al. [3] |
Part |
Part |
Part |
Green |
Case |
| Operations integration |
0.766 |
0.586 |
1 |
|
|
| A. 3 |
0.710 |
0.062 |
11.540 |
*** |
0.679 |
0.695 |
Kot [4] |
Include |
Include |
Include |
| Sustainable performance |
0.609 | Include |
Survey analysis |
| 0.475 |
0.680 |
| Supply chain cooperation |
B. 1 |
1.000 |
|
|
|
0.683 |
0.530 |
0.747 |
0.611 |
| B. 2 |
1.304 |
0.127 |
10.247 |
*** |
0.914 |
*** |
0.608 |
0.433 |
Confirmatory factory analysis table.
2.3. Discriminant Validity Analysis
In an effective model, items should only be highly correlated with specific constructs. Therefore, performing differential value analysis requires verifying whether two elements are statistically correlated. Accordingly, AVE is employed in order to compare the related coefficients between AVE and its constructs
[19][88]. The AVE method involves evaluating the index of different constructs and should be lower than the indicator of the same surface. In this study, the AVE value of the diagonal was higher than the square of the standardization correlation coefficient of the lower triangle, indicating that the model had adequate discriminant ability.
Table 46 presents the results of the discriminant validity analysis.
Table 46. Discriminant validity analysis table.
| |
Enterprise Commitment |
Supply Chain Cooperation |
Operations Integration |
Sustainable Performance |
Business Performance |
| Enterprise commitment |
0.654 |
|
|
|
|
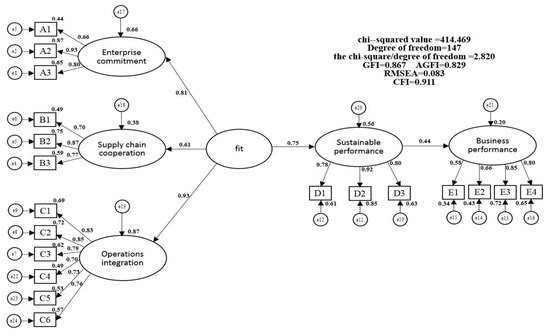
90]. The comparative fit index (CFI) is the difference between the hypothetical model and the noncovariant-associated independent model. In this study, CFI > 0.9 was favorable. The root mean square error of approximation (RMSEA) lacks moderate indicators; therefore, a smaller RMSEA value is desirable. In this study, RMSEA < 0.8 indicated a favorable degree of modeling. As presented in
Figure 24, chi-squared/degrees of freedom = 2.820, CFI = 0.911, GFI = 0.867, AGFI = 0.829, and RMSEA = 0.083. The RMSEA was slightly higher than desired. This extremity was due to the number of samples estimated (300–500 samples)
[22][91].
Figure 24. SEM analysis diagram.
As presented in
Table 57, in terms of the 95% rule, the
p-value was lower than 0.05, which supported H1 and H2. The level of organizational strategy and corporate operation, including upstream suppliers, internal operational mechanisms, and enterprise commitments, positively influences a company’s sustainable performance, which further positively influences business performance.
Table 57. Statistical model path coefficient of supply chain.
| Facial Surface |
Direction |
Facial Surface |
Non-Standard Coefficient |
Standardization Coefficient |
S.E. |
C.R. |
p-Value |
| Sustainable performance |
← |
Goodness of fit |
1.053 |
0.749 |
0.116 |
9.071 |
*** |
Supply chain cooperation |
0.210 |
0.611 |
|
|
|
| Enterprise commitment |
← |
Goodness of fit |
1.000 |
0.814 |
- |
- |
- |
Operations integration |
0.587 |
0.343 |
0.606 |
|
| Supply chain cooperation | |
| ← |
Goodness of fit |
0.630 |
0.614 |
0.084 |
7.463 |
*** |
Sustainable performance |
0.371 |
0.226 |
0.462 |
0.700 |
|
| Operations integration | 1 |
|
Martineau [5] |
NA |
NA |
NA |
Reverse
logistics |
OR |
| Business performance |
0.383 |
0.654 |
0.374 |
0.419 |
1 |
Fleischmann et al. [6] |
Recycle |
NA |
Part |
Reverse
logistics |
Review |
| Cooper et al. [7] |
NA |
Part |
NA |
SCM |
Review |
| Paulraj and de Jong [8] |
ISO-14001 |
Include |
NA |
NA |
Event-study |
| Li et al. [9] |
Include |
Part |
Part |
SCM |
SEM |
| WCED [10] |
Include |
Include |
Include |
Include |
NA |
| van Marrewijk [11] |
Include |
Include |
NA |
NA |
Review |
| Jayaram and Avittathur [12] |
Include |
Include |
Include |
Include |
Review |
| Paliwal et al. [13] |
Include |
Include |
NA |
Block chain |
Review |
| Bui et al. [14] |
Include |
Include |
NA |
SSC |
Data-driven literature review |
| Khan et al. [15] |
Sustainability-related risks |
Planning-related risks |
NA |
Logistic and outsourcing related risks |
Fuzzy Delphi and fuzzy DEMATEL |
| Signori [16] |
Include |
Include |
NA |
SSC |
Theory-building grounded |
| This study |
Include |
Include |
Include |
Include |
SEM Mediation fit model |
The contributions of previous authors.
Section 2 presents a literature review investigating high-value manufacturing, enterprise and sustainability, SSCs, and performance.
Section 3 describes the questionnaires developed, sampling, and methods used.
Section 4 analyzes the results through the relevant aspects by using SEM.
Section 5 presents the conclusions, the academic as well as management implications, and recommendations for future research.
2. Results and Discussion
The confidence validity of the proposed model was verified using Pearson’s correlation coefficient analysis, confirmatory factor analysis (CFA), differential validity analysis, the SSC structural equation model, and matching path analysis to confirm the degree of model fit and thus verify the proposed hypotheses.
2.1. Pearson Correlation Analysis
The Pearson product-moment coefficient is a standardized correlation coefficient that removes the unit from the covariance and examines the multicollinearity problem. Collinear problems with correlation coefficients higher than 0.85 may result in model miscalculations
[17][86]. The results of the Pearson correlation analysis (
Table 24) revealed that the correlation between the various facets was lower than 0.85, indicating that the proposed model was acceptable and that it had no multicollinearity problems.
Table 24. Pearson correlation matrix.
| |
Enterprise Commitment |
Supply Chain Cooperation |
Operations Integration |
Sustainable Performance |
Business Performance |
| Enterprise commitment |
1 |
Pearson correlation matrix.
2.2. CFA
A measurement model must meet the following conditions to have convergent validity
[18][
Statistical model path coefficient of supply chain.
The results of the covariant standardization adaptation (
Figure 24) strongly support the relationships among supply chain cooperation, enterprise commitment, and operating mechanism integration. If the manufacturing industry wishes to strengthen SSCs and improve sustainability and business performance, these three pillars must be improved. In contrast, if supply chain cooperation is low, the other two pillars are likely to be limited as well. Therefore, path analysis is used to examine other relationships between manufacturers and upstream suppliers.
2.5. SSC Path Analysis
Path analysis explores the relationships among enterprise commitment, supply chain cooperation, and operation integration.
2.5.1. Manufacturer Mediation Fit Model: Process Fit
This study examined whether manufacturing has a significant mediation fit and verified whether the hypotheses are valid. The results of the analysis and the path coefficients are presented in
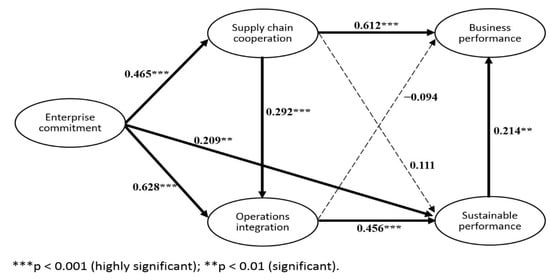
Table 68. The results of the analysis validated H3. Only H4b and H4c of H4 were validated. Specifically, operation integration impacts sustainable performance but not business performance. Finally, H5 was assumed to be supported. On the basis of the literature review, this study inferred that sustainable performance can only be generated in products and processes if the knowledge and experience shared among enterprises and their upstream and downstream partners are applied to improve the internal operations of the enterprise.
Figure 35 presents the mediation fit process adaptation model, which had a moderate GFI = 0.884, AGFI = 0.846, CFI = 0.928, and RMSEA= 0.076. In
Figure 35, significant routes are indicated by bold lines and nonsignificant paths are indicated by dashed lines.
Figure 35. Mediation fit: standardized results of the process fit model.
Table 68. Mediation fit model–process fit path coefficient table.
| Path |
Path Coefficient |
C.R. |
p |
| Enterprise commitment |
| 0.612 |
| 6.227 |
| *** |
| Operations integration |
→ |
Business performance |
−0.094 |
−0.993 |
0.321 |
| Sustainable performance |
→ |
Business performance |
0.214 |
2.465 |
0.014 * |
Mediation fit model–process fit path coefficient table.
2.5.2. Manufacturer Mediation Fit Model: Industry Value Point
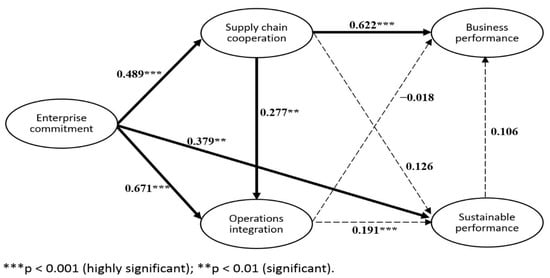
This study classified industries into two groups: those with an added value of ≥25% (high-value manufacturing) and those with an added value of <25% (general manufacturing). High-value manufacturing included ready-to-wear apparel, leather, fur and its manufactured goods, wood and bamboo products, printing and data storage, pharmaceuticals, nonmetallic minerals, metal products, electronic components, computers, electronic products, and optical products. In total, 165 and 102 samples were obtained for the high-value and general manufacturing groups, respectively. Path analysis determined whether differences existed in the mediation fit model between enterprises with different added values (
Table 79). For both high-value and general manufacturers, commitment had a positive impact on sustainable performance and sustainable growth.
Table 79. Mediation fit model–process fit path coefficient table.
| Path |
High-Value Manufacturing |
General Manufacturing |
| Path Coefficient |
C.R. |
Path Coefficient |
C.R. |
| → |
Supply chain cooperation |
| Enterprise commitment |
→0.465 |
5.965 |
Supply chain cooperation |
0.520 |
4.415 ****** |
| 0.489 |
Enterprise commitment |
→ |
Operations integration |
0.628 |
8.110 |
*** |
| 3.861 *** |
| Enterprise commitment |
→ |
Operations integration |
0.595 |
5.248 *** |
0.671 |
5.238 *** |
Supply chain cooperation |
→ |
Operations integration |
0.292 |
4.798 |
*** |
| Supply chain cooperation) |
→ |
Operations integration |
0.308 |
3.269 ** |
0.277 |
2.951 ** |
Supply chain cooperation |
→ |
Sustainable performance |
0.111 |
1.569 |
0.117 |
| Supply chain cooperation |
→ |
Sustainable performance |
0.093 |
0.943 |
0.126 |
1.029 |
0.836 |
| Business performance |
0.147 |
Operations integration |
→ | 0.428 |
Sustainable performance |
0.456 |
4.325 |
*** |
B. 3 |
1.043 |
0.100 |
| Operations integration |
→ |
Sustainable performance |
0.486 |
3.373 *** |
0.191 |
1.015 |
10.457 |
Enterprise commitment | *** |
0.728 |
0.466 |
| → |
Sustainable performance |
0.209 |
2.293 |
0.022 * |
| Enterprise commitment |
→ |
Sustainable performance |
0.264 |
2.079 ** |
0.379 |
2.127 ** |
Operations integration |
C. 1 |
1.000 |
|
|
|
0.856 |
0.520 |
0.857 |
0.606 |
| Supply chain cooperation |
| Supply chain cooperation→ |
→Business performance |
Business performance |
0.565 |
3.972 *** |
0.622 |
3.856 *** |
C. 2 |
0.817 |
0.062 |
13.191 |
*** |
0.713 |
| Operations integration | 0.547 |
| → |
C. 3 |
0.890 |
0.055 |
16.168 |
*** |
0.819 |
0.656 |
| 0.140 |
0.176 |
1 |
Business performance |
−0.082 |
−0.538 |
−0.018 |
−0.131 |
| Sustainable performance |
→ |
Business performance |
0.270 |
1.899 |
0.106 |
0.937 |
C. 4 |
0.913 |
0.057 |
15.900 |
*** |
0.810 |
0.670 |
Mediation fit model–process fit path coefficient table.
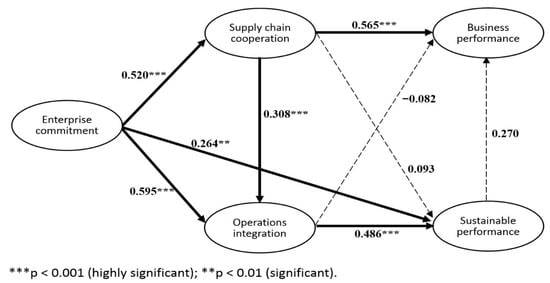
However, for high-value manufacturing alone, enterprise commitment can act as an intermediary for sustainable performance through supply chain cooperation and operation integration. The positive impact of sustainable performance supports H6. This study also posits that manufacturing industries with high added value are more consistent with this model.
Figure 46 and
Figure 57 illustrate different value-added enterprises under the mediation fit–process adaptation model. The high-value manufacturing model exhibited a moderate fit (RMSEA = 0.08, GFI = 0.84, AGFI = 0.78, and CFI = 0.91). The general manufacturing path model also had a moderate fit (RMSEA = 0.087, GFI = 0.810, AGFI = 0.748, and CFI = 0.908). Solid lines are significant paths, and dashed lines are nonsignificant paths.
Figure 46. Mediation fit: process adaptation model (high-value manufacturing).
Figure 57. Mediation fit: process adaptation model (general manufacturing).
2.6. Results
The proposed model comprised three parts: namely, the covariation model, the mediation model, and the industry-oriented intermediary mediation model. These three models were used to test the six hypotheses. The results are presented in
Table 810.
Table 810. Test results.
| |
Hypothesis |
p-Value |
Support or Not |
| Covariation Fit Model |
H1: In a sustainable manufacturing supply chain, supply chain cooperation, enterprise commitment, and operation integration have a positive impact on sustainable performance. |
*** |
Support |
| H2: Sustainable performance has a positive impact on an enterprise’s business performance. |
*** |
Support |
| Mediation Fit Model |
H3: Enterprise commitment has a direct positive impact on sustainable performance. |
** |
Support |
| H4a: Enterprise commitment has a direct positive impact on sustainable performance through supply chain cooperation. |
0.117 |
Not support |
| H4b: Enterprise commitment has a direct positive impact on business performance through supply chain cooperation. |
*** |
Support |
| H4c: Enterprise commitment has a positive impact on sustainable performance through operation integration. |
*** |
Support |
| H4d: Enterprise commitment has a positive impact on operating performance through operation integration. |
0.321 |
Not support |
| H5: Enterprise commitment forms an intermediary mediation fit with supply chain cooperation and operation integration, which has a positive impact on sustainable performance and a subsequent effect on business performance. |
** |
Support |
| Mediation Fit Model—industry perspective |
H6: The supply chain structure adaptation model differs for diverse value-added industries. |
- |
Support |
C. 5 |
0.874 |
0.063 |
13.889 |
*** |
0.739 |
0.508 |
| C. 6 |
0.827 |
0.062 |
13.410 |
*** |
0.721 |
0.734 |
Sustainable
performance |
D. 1 |
1.000 |
|
|
|
0.757 |
0.593 |
0.747 |
0.700 |
Discriminant validity analysis table.
2.4. SEM Analysis of SSCs
2.4. SEM Analysis of SSCs
Analysis of the verification factors and differential values verifies various components; the results indicate that the proposed model is appropriate. Subsequent SEM analysis verifies the integration model and the hypotheses. In the relevant matching moderation indicator, the chi-squared/degree of freedom should be lower than three. The goodness-of-fit index (GFI) indicates the similarities between the model and the sample data. A value closer to one indicates a higher degree of applicability. In this study, GFI > 0.8 was favorable
[20][89]. Adjusted GFI (AGFI) is a moderate index for adjusting GFI with a degree of freedom. A value closer to one is desirable; for this study, AGFI > 0.8 was favorable
[21][| ← |
| Goodness of fit |
| 1.357 |
0.935 |
0.141 |
9.646 |
*** |
| Business performance |
← |
Sustainable performance |
0.299 |
0.442 |
0.048 |
6.279 |
*** |
| D. 2 |
| 1.270 |
| 0.091 |
| 13.912 |
| *** |
0.966 |
0.933 |
| D. 3 |
1.042 |
0.079 |
13.177 |
*** |
0.770 |
0.574 |
| Business performance |
E. 1 |
1.000 |
|
|
|
0.658 |
0.370 |
0.797 |
0.543 |
| E. 2 |
1.043 |
0.097 |
10.724 |
*** |
0.860 |
0.630 |
| E. 3 |
0.998 |
0.095 |
10.459 |
*** |
0.794 |
0.740 |
| E. 4 |
0.830 |
0.097 |
8.509 |
Test results.