Your browser does not fully support modern features. Please upgrade for a smoother experience.
Please note this is a comparison between Version 1 by Marco Montalti and Version 2 by Lindsay Dong.
COVID-19 infection has represented a major health plague worldwide since 2020, for which vaccination currently appears to be the only efficacious strategy to achieve disease control. In this context, vaccine hesitancy (VH), responsible for outbreaks and epidemics of other infectious diseases (i.e., measles) secondary to the drop of immunized people under the herd immunity threshold [109], represents a major threat, deserving rapid identification of predisposing factors, and targeted countermeasures.
- coronavirus
- COVID-19
- global vaccination
- healthcare workers
- SARS-CoV-2
- vaccination attitude
- vaccine acceptance rate
- vaccine hesitancy
- vaccine intention
- vaccine rejection
1. Introduction
Vaccine hesitancy (VH), defined by the SAGE working group as “delay in acceptance or refusal of vaccination despite availability of vaccination services” [1], has been recognized as a major threat to the effectiveness of this public health strategy aimed at containing and eradicating infectious diseases, deserving inclusion among major health concerns by the World Health Organization (WHO) in 2019 [2].
The potential consequences of VH are currently considered even more alarming because of the ongoing COVID-19 pandemic, against which vaccination appears to be the most efficacious strategy. Indeed, in addition to the considerable logistic and financial challenges implied in the organization of mass vaccination campaigns, VH could significantly limit or delay vaccination spread, thus preventing the rapid achievement of immunization rates required in the population (estimated at around 70% for COVID-19) [3] to fight the pandemic.
2. Anti-COVID19 Vaccine Acceptance Rate in the General Population and in Specific Target Populations
2.1. General Population
3.2.1. General Population
According to the analysis performed in the general population, the lowest rates of vaccine confidence were found in Hong Kong (4.2–38%), Middle East Area (Jordan and Kuwait, 29.4% and 36.8%, respectively [4][5][79,80]) followed by the Democratic Republic of Congo (15.4%) [6][7][76,90]. On the other hand, the highest acceptance rate (94.3%) was reported in Malaysia [8][99].
23.2.1. General Population
According to the analysis performed in the general population, the lowest rates of vaccine confidence were found in Hong Kong (4.2–38%), Middle East Area (Jordan and Kuwait, 29.4% and 36.8%, respectively [4][5][79,80]) followed by the Democratic Republic of Congo (15.4%) [6][7][76,90]. On the other hand, the highest acceptance rate (94.3%) was reported in Malaysia [8][99].
23.2.2. Specific Populations
In the group of HCWs, the lowest confidence rate (27.7%) was reported in the Democratic Republic of Congo [9][77], followed by the US (36%) [10][30], while the highest rate (96.2%) was reported in Asia (China, India, Republic of Indonesia, Singapore, Vietnam and Bhutan) [11][102].
When considering patients affected by chronic diseases and caregivers, the lowest confidence rate was found among American adults affected by substance use diseases (45%) [12][32], while the highest (85.6%) was reported in elderly affected by chronic respiratory diseases [13][44].
Among university students, the lowest acceptance rate (34.9%) was found in Egypt [14][37], and the highest in the US (98%) [15][78].
Gender distribution was analyzed in 84 (84%) studies, while 2 (2%) studies analyzed vaccine acceptance in the female population and 14 (14%) studies did not report this data.
Finally, Skjefte et al. reported a confidence rate of 52% among pregnant women and of 75.8% among parents/guardians in Australia [16][104].
2.2. Differences among WHO Regional Areas: General Population and HCWs
3.3. Differences among WHO Regional Areas: General Population and HCWs
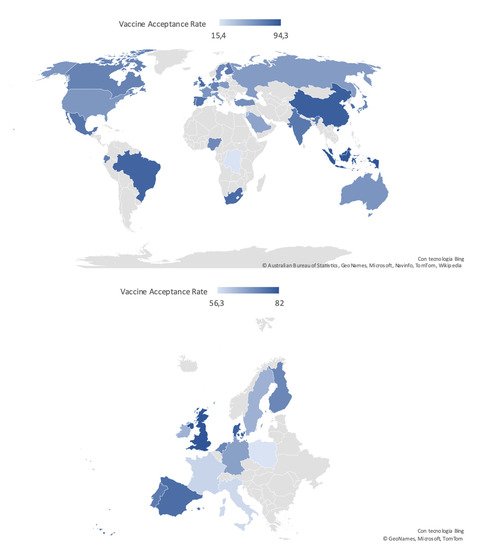
Most of the studies were conducted in the Region of the Americas (n = 35, 35%; 33 in the US; one in the US and Canada, and one in Mexico), followed by the European Region (n = 31; 31%), the Western Pacific Region (n = 15; 15%), the Eastern Mediterranean Region (n = 7; 7%), the African Region (n = 3; 3%) and the Southeastern Asian Region (n = 2; 2%). Finally, seven studies included patients from more than one region (Table 1). In the European Region, the confidence rate varied from 40.9% to 92.3% in the general population, and from 54.9% to 95.1% in HCWs [17][18][19][20][56,64,65,66]. In the Region of the Americas, vaccine confidence varied between 36% and 98% in the general population and HCWs [10][14][30,37]. For the African Region, it was only identified by a study by Dinga et al. showing a confidence rate of 15.4% in the general population [6][76], and another by Kabamba Nzaji et al. reporting an acceptance rate of 27.7% in HCWs [9][77]. In the Eastern Mediterranean Region, confidence rate in the general population varied from 29.4% to 64.7% [5][21][80,82]; no study focused on HCWs. In the Western Pacific Region, the various studies reported confidence rates from 4.2% to 94.3% in the general population [7][8][90,99]; a single study focusing on nurses showed a confidence rate of 40% [22][89]. According to the two studies available for the South Eastern Asian Region, confidence rates were 94.3% in HCWs and 93.3% for the general population [23][24][100,101]. Studies including more than one Region showed confidence rates of 71.6–96.2% for HCWs, and of 71.5–80% for the general population [11][25][26][27][102,103,106,107]. Acceptance rate distribution reported in the general population worldwide and in the European Countries is depicted in Figure 12.Figure 12. Worldwide and European distribution of COVID-19 vaccine acceptance rates in the general population, defined according to the most recent available data.
3. Global COVID-19 Vaccine Acceptance in Different Populations
Largely variable rates of vaccine acceptance worldwide, in the general population, as well as in specific sub-populations.
3.1. Gender Distribution
In most of the selected studies females were more represented than males. A higher prevalence of VH for the different vaccines has been widely reported in literature [28][110], and it has been hypothesized that this may be due to a lower trust in the Institutions and in the scientific community, an important driver of VH, in women [29][111]. With regards to COVID-19, the higher prevalence of severe infections and death among males [30][112] could have increased male risk perception and, subsequently, vaccine acceptance. At the same time, it has to be remarked that this study did not show a clear correlation between the number of males included in the studies surveys and vaccine acceptance. Therefore, several other factors might have influenced this relation.
3.2. Health Care Workers
Extremely variable vaccine confidence rates were reported among health care workers (HCWs). Following the geographical distribution, the lowest rates were observed in the Democratic Republic of Congo (27.7%) and the US (36.0%), and the highest (96.2%) in Eastern Asian countries (China, India, Republic of Indonesia, Singapore, Vietnam, and Bhutan) [10][9][11][30,77,102]. High rates of VH among HCWs are particularly alarming for their crucial role during the SARS-CoV-2 pandemic, in terms of daily patient care but also health literacy promotion for the general population. The wide range of confidence rates towards the COVID-19 vaccination found globally could be explained considering the different roles and relation to the patients played by the different HCWs (e.g., physician, nurse, pharmacist or clerical worker) [31][113]. Indeed, HCWs involved in direct patient care were found to be more confident, suggesting that an increased vaccine hesitancy could be related to a less direct contact with the patient and, consequently, a reduced risk perception of COVID-19 associated morbidity [32][34]. At the same time, the high rates of VH reported even in HCWs directly involved in patient care [10][30] underlines the need of interventions specifically addressed to this category of workers to increase their awareness towards the risk of unsuccessful vaccine campaigns [33][114].
3.3. Patients Affected by Specific Diseases
Some studies showed a higher vaccine confidence rate in patients with chronic diseases as compared to the general population, as might be expected (i.e., 80.9% and 84.5% in patients with multiple sclerosis from Portugal and the US, respectively; or 85.6% in those with chronic respiratory diseases from UK), possibly secondary to the perception of frailty towards severe disease and death [34][35][115,116], which is true especially for respiratory diseases [36][117] and MS [37][118].
Other studies, focusing on oncologic (53.7%) and rheumatologic patients (54.9%), showed acceptance rates similar to the general population living in the same countries. Remarkably, some subpopulations showed particularly low acceptance rates, i.e., black adults with HIV (46%), people with drug addiction (45%), adults undergoing chronic dialysis (49%), and, finally, SARS-CoV-2 positives. Patients who had already been infected by the virus could possibly perceive themselves as immunized against COVID-19, independently from its variants, thus reducing the perceived advantages associated with vaccination and the willingness to be vaccinated. In the remaining categories, reluctance to accept a vaccine against COVID-19 might be due to the confounding effect of low income and education, which have been shown to be risk factors for chronic kidney disease, substance abuse, and HIV infection [38][39][40][119,120,121], or, finally, to the possible wariness of frail patients towards potential side effects of the vaccines.
3.4. Surveys Administration Setting
4.4. Surveys Administration Setting
Almost all surveys were conducted online, sending questionnaires via e-mail or using other social media. The dissemination of these versatile information tools has undoubtedly facilitated and speeded up the data collection process, especially during COVID-19 pandemics, in the targeted populations. On the other hand, their use could be responsible for population selection bias, e.g., exclusion of the elderly, and problems in questionnaire filling/misunderstandings, due to the lack/difficulty of interaction with researchers.
Finally, online platforms (in particular the new social media) are considered by some recent studies as carriers of disbelief and skepticism about vaccines [41][42][43][122,123,124], potentially leading to higher rates of hesitancy in the average users of these online platforms.
All these aspects could contribute to the variability of vaccine confidence rates.
3.5. Geographical Distribution
The prevalence of vaccine acceptance/refusal widely varied across countries and WHO Regions, supporting the definition of VH given by the SAGE Group as “complex and context specific, varying across time, place and vaccines” [1]. This could be explained by the complex and unpredictable interaction of demographic, cultural, and social factors, including previously mentioned demographic and educational ones, but also people’s confidence in health and other governmental institutions, and, on the other hand, the tightness of governmental control on social and information media.
The lowest acceptance rates among the general population were observed in Hong Kong, ranging from 4.2% to 38% depending on the type of vaccine evaluated in the study, and in the Democratic Republic of the Congo, corresponding to 15.4%. These two countries present vastly different cultures and demographic features, but share a recent history of political instability that should be considered while examining VH rate under a socio-political perspective.
Conversely, the highest rates were found in China (91.9%), Malaysia (94.3%), and Indonesia (93.3%). These results could reflect a higher awareness toward the terrible consequences of SARS-CoV-2 virus diffusion, as these Asian countries were among the first to be hit by the COVID-19 pandemic, and have consequent confidence in vaccines.
The European Region was characterized by a very broad variability of vaccine acceptance rates, with the highest rates reported in United Kingdom (82%), and the lowest in Italy (40.9%) and in France (53.7%), reflecting once again the impact of cultural and sociodemographic heterogeneity of the examined geographical area on VH [44][12].
4. Conclusions
VH is a global and increasingly wide-spreading phenomenon. Nonetheless, remarkable differences in vaccine acceptance rates can be observed across countries and subpopulations, supporting the underlying complex and unpredictable interplay among demographic, geopolitical and cultural aspects, which are hard to be understood and discriminated. At the same time, focused research aimed at formulating targeted strategies to improve vaccine awareness, confidence and acceptance prevalence is of utmost importance.
Since communication, especially via social media, has been clearly demonstrated to play a pivotal role in determining adherence to vaccination, these instruments should be better exploited by the governmental institutions and the scientific community to increase people trust in the evidence-based rationale and rigorous production process, as well as expected short and long-term benefits of universal vaccination for the ongoing COVID-19 and potential future pandemics.