Image-based fashion recommendation systems (FRSs) have attracted a huge amount of attention from fast fashion retailers as they provide a personalized shopping experience to consumers. With the technological advancements, this branch of artificial intelligence exhibits a tremendous amount of potential in image processing, parsing, classification, and segmentation.
- fashion recommendation system
- e-commerce
- filtering techniques
- algorithmic models
- performance
1. Introduction
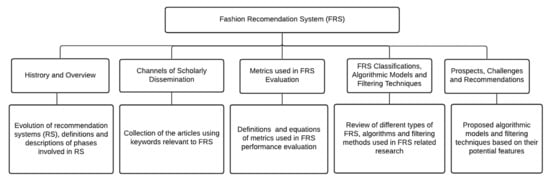
2. History and Overview of Recommendation System
Year | Recommendation System Approach | Properties | ||||||
|---|---|---|---|---|---|---|---|---|
Before 1992 | Mafia, developed in 1990 |
| ||||||
1992 to 1998 | Tapestry, developed in 1992 |
| ||||||
Grouplens, first used in 1994 |
| |||||||
Movielens, proposed in 1997 |
| |||||||
1999 to 2005 | PLSA (Probabilistic Latent Semantic Analysis), proposed in 1999 |
| ||||||
2005 to 2009 | Several Latent Factor Models such as Singular Value Decompositions (SVD), Robust Singular Value Decomposition (RSVD), Normalized Singular Value Deviation (NSVD). |
| ||||||
2010 to onwards | Context-aware-based, instant-personalization-based |
|
3. Channels of Scholarly Dissemination Related to Fashion Recommendation System (FRS)
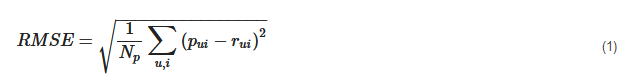
4. Metrics Used in Fashion Recommendation System Evaluation
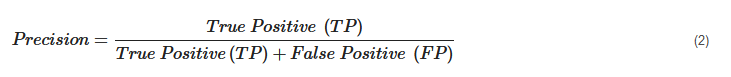 It is also defined as the ratio of the number of relevant recommended items to the number of recommended items expressed as percentages.
Recall. Recall can be defined as the fraction of correct recommendations or predictions (known as True Positive) to the total number of correct relevant recommendations provided, which can be as represented as follows:
It is also defined as the ratio of the number of relevant recommended items to the number of recommended items expressed as percentages.
Recall. Recall can be defined as the fraction of correct recommendations or predictions (known as True Positive) to the total number of correct relevant recommendations provided, which can be as represented as follows:
 It is also defined as the ratio of the number of relevant recommended items to the total number of relevant items expressed as percentages.
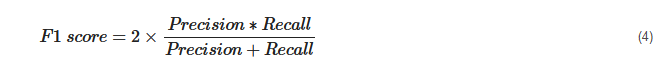
F1 Score. F1 score is an indicator of the accuracy of the model and ranges from 0 to 1, where a value close to 1 represents higher recommendation or prediction accuracy. It represents precision and recall as a single metric and can be as represented as follows:
It is also defined as the ratio of the number of relevant recommended items to the total number of relevant items expressed as percentages.
F1 Score. F1 score is an indicator of the accuracy of the model and ranges from 0 to 1, where a value close to 1 represents higher recommendation or prediction accuracy. It represents precision and recall as a single metric and can be as represented as follows:
 Coverage. Coverage is used to measure the percentage of items which are recommended by the algorithm among all of the items.
Accuracy. Accuracy can be defined as the ratio of the number of total correct recommendations to the total recommendations provided, which can be as represented as follows:
Coverage. Coverage is used to measure the percentage of items which are recommended by the algorithm among all of the items.
Accuracy. Accuracy can be defined as the ratio of the number of total correct recommendations to the total recommendations provided, which can be as represented as follows:
 Intersection over union (IoU). It represents the accuracy of an object detector used on a specific dataset [70][62].
 ROC. ROC curve is used to conduct a comprehensive assessment of the algorithm’s performance [57].
AUC. AUC measures the performance of recommendation and its baselines as well as the quality of the ranking based on pairwise comparisons [5].
Rank aware top-N metrics. The rank aware top-N recommendation metric finds some of the interesting and unknown items that are presumed to be most attractive to a user [71][63]. Mean reciprocal rank (MRR), mean average precision (MAP) and normalized discounted cumulative gain (NDCG) are three most popular rank aware metrics.
MRR. MRR is calculated as a mean of the reciprocal of the position or rank of first relevant recommendation [72,73][64][65]. MRR as mentioned by [72,73][64][65] can be expressed as follows:
ROC. ROC curve is used to conduct a comprehensive assessment of the algorithm’s performance [57].
AUC. AUC measures the performance of recommendation and its baselines as well as the quality of the ranking based on pairwise comparisons [5].
Rank aware top-N metrics. The rank aware top-N recommendation metric finds some of the interesting and unknown items that are presumed to be most attractive to a user [71][63]. Mean reciprocal rank (MRR), mean average precision (MAP) and normalized discounted cumulative gain (NDCG) are three most popular rank aware metrics.
MRR. MRR is calculated as a mean of the reciprocal of the position or rank of first relevant recommendation [72,73][64][65]. MRR as mentioned by [72,73][64][65] can be expressed as follows:
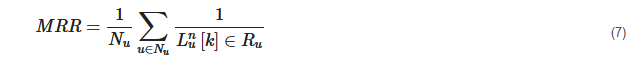 where u, Nu and Ru indicate specific user, total number of users and the set of items rated by the user, respectively. L indicates list of ranking length (n) for user (u) and k represents the position of the item found in the he lists L.
MAP: MAP is calculated by determining the mean of average precision at the points where relevant products or items are found. MAP as mentioned by [73][65] can be expressed as follows.
where u, Nu and Ru indicate specific user, total number of users and the set of items rated by the user, respectively. L indicates list of ranking length (n) for user (u) and k represents the position of the item found in the he lists L.
MAP: MAP is calculated by determining the mean of average precision at the points where relevant products or items are found. MAP as mentioned by [73][65] can be expressed as follows.
 where Pu represents precision in selecting relevant item for the user.
NDCG: NDCG is calculated by determining the graded relevance and positional information of the recommended items, which can be expressed as follows [73][65].
where Pu represents precision in selecting relevant item for the user.
NDCG: NDCG is calculated by determining the graded relevance and positional information of the recommended items, which can be expressed as follows [73][65].
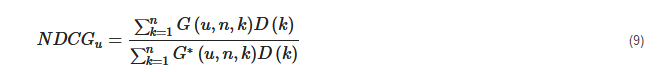 where D (k) is a discounting function, G (u, n, k) is the gain obtained recommending an item found at k-th position from the list L and G* (u, n, k) is the gain related to k-th item in the ideal ranking of n size for u user.
5. Fashion Recommendation System (FRS), Algorithmic Models and Filtering Techniques
FRS can be defined as a means of feature matching between fashion products and users or consumers under specific matching criteria. Different research addressed apparel attributes such as the formulation of colors, clothing shapes, outfit or styles, patterns or prints and fabric structures or textures [10,58,74,75][10][58][66][67]. Guan et al. studied these features using image recognition, product attribute extraction and feature encoding. Researchers have also considered user features such as facial features, body shapes, personal choice or preference, locations and wearing occasions in predicting users’ fashion interests [31,75,76,77,78][31][67][68][69][70]. A well-defined user profile can differentiate a more personalized or customized recommendation system from a conventional system [28,79][28][71]. Various research projects on apparel recommendation systems with personalized styling guideline and intelligent recommendation engines have been conducted based on similarity recommendation and expert advisor recommendation systems [10,58,61][10][58][72]. Image processing, image parsing, sensory engineering, computational algorithms, and computer vision techniques have been extensively employed to support these systems [32,80,81,82,83,84][32][73][74][75][76][77].References
- Barnard, M. Fashion as Communication, 2nd ed.; Routledge: London, UK, 2008.
- Chakraborty, S.; Hoque, S.M.A.; Kabir, S.M.F. Predicting fashion trend using runway images: Application of logistic regression in trend forecasting. Int. J. Fash. Des. Technol. Educ. 2020, 13, 376–386.
- Karmaker Santu, S.K.; Sondhi, P.; Zhai, C. On application of learning to rank for e-commerce search. In Proceedings of the 40th International ACM SIGIR Conference on Research and Development in Information Retrieval, Shinjuku, Tokyo, Japan, 7–11 August 2017; pp. 475–484.
- Garude, D.; Khopkar, A.; Dhake, M.; Laghane, S.; Maktum, T. Skin-tone and occasion oriented outfit recommendation system. SSRN Electron. J. 2019.
- Kang, W.-C.; Fang, C.; Wang, Z.; McAuley, J. Visually-aware fashion recommendation and design with generative image models. In Proceedings of the 2017 IEEE International Conference on Data Mining (ICDM), New Orleans, LA, USA, 18–21 November 2017; pp. 207–216.
- Sachdeva, H.; Pandey, S. Interactive Systems for Fashion Clothing Recommendation. In Emerging Technology in Modelling and Graphics; Mandal, J.K., Bhattacharya, D., Eds.; Springer: Singapore, 2020; Volume 937, pp. 287–294.
- Sun, G.-L.; Wu, X.; Peng, Q. Part-based clothing image annotation by visual neighbor retrieval. Neurocomputing 2016, 213, 115–124.
- Zhang, Y.; Caverlee, J. Instagrammers, Fashionistas, and Me: Recurrent Fashion Recommendation with Implicit Visual Influence. In Proceedings of the 28th ACM International Conference on Information and Knowledge Management, Beijing, China, 3–7 November 2019; pp. 1583–1592.
- Matzen, K.; Bala, K.; Snavely, N. StreetStyle: Exploring world-wide clothing styles from millions of photos. arXiv 2017, arXiv:1706.01869.
- Guan, C.; Qin, S.; Ling, W.; Ding, G. Apparel recommendation system evolution: An empirical review. Int. J. Cloth. Sci. Technol. 2016, 28, 854–879.
- Hu, Y.; Manikonda, L.; Kambhampati, S. What We Instagram: A First Analysis of Instagram Photo Content and User Types. Available online: http://www.aaai.org (accessed on 1 May 2014).
- Gao, G.; Liu, L.; Wang, L.; Zhang, Y. Fashion clothes matching scheme based on Siamese Network and AutoEncoder. Multimed. Syst. 2019, 25, 593–602.
- Liu, Y.; Gao, Y.; Feng, S.; Li, Z. Weather-to-garment: Weather-oriented clothing recommendation. In Proceedings of the 2017 IEEE International Conference on Multimedia and Expo. (ICME), Hong Kong, China, 31 August 2017; pp. 181–186.
- Chakraborty, S.; Hoque, M.S.; Surid, S.M. A comprehensive review on image based style prediction and online fashion recommendation. J. Mod. Tech. Eng. 2020, 5, 212–233.
- Chen, W.; Huang, P.; Xu, J.; Guo, X.; Guo, C.; Sun, F.; Li, C.; Pfadler, A.; Zhao, H.; Zhao, B. POG: Personalized outfit generation for fashion recommendation at Alibaba iFashion. In Proceedings of the 25th ACM SIGKDD International Conference on Knowledge Discovery & Data Mining, Anchorage, AK, USA, 4–8 August 2019; Association for Computing Machinery: New York, NY, USA, 2019; pp. 2662–2670.
- Street Style Fashion. Available online: http://www.chictopia.com/browse/people (accessed on 12 July 2021).
- Lindig, S. Outfit Recommendation Algorithm for Better Instagram Photos—Fashion Algorithm for Instagram. Available online: https://www.harpersbazaar.com/fashion/trends/a11271/fashion-algorithm-suggests-outfits-for-better-instagram-photos/ (accessed on 13 July 2021).
- Lookbook. Available online: https://lookbook.nu/ (accessed on 13 July 2021).
- Park, J.; Ciampaglia, G.L.; Ferrara, E. Style in the age of Instagram: Predicting success within the fashion industry using social media. In Proceedings of the 19th ACM Conference on Computer-Supported Cooperative Work & Social Computing—CSCW ’16, San Francisco, CA, USA, 27 February–2 March 2016; pp. 64–73.
- Shopstyle: Search and Find the Latest in Fashion. Available online: https://www.shopstyle.com/ (accessed on 13 July 2021).
- Spiller, L.; Tuten, T. Integrating Metrics Across the Marketing Curriculum: The digital and social media opportunity. J. Mark. Educ. 2015, 37, 114–126.
- Tsujita, H.; Tsukada, K.; Kambara, K.; Siio, I. Complete fashion coordinator: A support system for capturing and selecting daily clothes with social networks. In Proceedings of the International Conference on Advanced Visual Interfaces—AVI ’10, Rome, Italy, 26–28 May 2010; p. 127.
- Lakkaraju, H.; Ajmera, J. Attention prediction on social media brand pages. In Proceedings of the 20th ACM International Conference on Information and Knowledge Management–CIKM ’11, Glasgow, UK, 24–28 October 2011; p. 2157.
- Stieglitz, S.; Dang-Xuan, L. Emotions and Information Diffusion in Social Media—Sentiment of Microblogs and Sharing Behavior. J. Manag. Inf. Syst. 2013, 29, 217–248.
- Jagadeesh, V.; Piramuthu, R.; Bhardwaj, A.; Di, W.; Sundaresan, N. Large scale visual recommendations from street fashion images. In Proceedings of the 20th ACM SIGKDD International Conference on Knowledge Discovery and Data Mining—KDD ’14, New York, NY, USA, 24–27 August 2014; pp. 1925–1934.
- Ma, Y.; Yang, X.; Liao, L.; Cao, Y.; Chua, T.-S. Who, where, and what to wear?: Extracting Fashion knowledge from social media. In Proceedings of the 27th ACM International Conference on Multimedia, Nice, France, 21–25 October 2019; pp. 257–265.
- Yamaguchi, K.; Kiapour, M.H.; Ortiz, L.E.; Berg, T.L. Parsing clothing in fashion photographs. In Proceedings of the 2012 IEEE Conference on Computer Vision and Pattern Recognition, Providence, RI, USA, 16–21 June 2012; pp. 3570–3577.
- An, H.; Kwon, S.; Park, M. A case study on the recommendation services for customized fashion styles based on artificial intelligence. J. Korean Soc. Cloth. Text. 2019, 43, 349–360.
- Jain, G.; Rakesh, S.; Nabi, M.K.; Chaturvedi, K. Hyper-personalization–fashion sustainability through digital clienteling. Res. J. Text. Appar. 2018, 22, 320–334.
- Yin, R.; Li, K.; Lu, J.; Zhang, G. Enhancing Fashion Recommendation with Visual Compatibility Relationship. In Proceedings of the The World Wide Web Conference on—WWW ’19, San Francisco, CA, USA, 13–17 May 2019; pp. 3434–3440.
- Jo, J.; Lee, S.; Lee, C.; Lee, D.; Lim, H. Development of fashion product retrieval and recommendations model based on deep learning. Electronics 2020, 9, 508.
- Cui, P.; Wang, F.; Liu, S.; Ou, M.; Yang, S.; Sun, L. Who should share what?: Item-level social influence prediction for users and posts ranking. In Proceedings of the 34th International ACM SIGIR Conference on Research and Development in Information-SIGIR ’11, Beijing, China, 24–28 July 2011; p. 185.
- Lu, H.; Chen, Y.; Dai, H.Q. Clothing recommendation based on fuzzy mathematics. Int. J. Adv. Oper. Manag. 2013, 5, 14.
- Mohammed Abdulla, G.; Singh, S.; Borar, S. Shop your right size: A system for recommending sizes for fashion products. In Proceedings of the Companion Proceedings of the 2019 World Wide Web Conference on—WWW ’19, San Francisco, CA, USA, 13–17 May 2019; pp. 327–334.
- Polania, L.F.; Gupte, S. Learning Fashion Compatibility Across Apparel Categories for Outfit Recommendation. In Proceedings of the 2019 IEEE International Conference on Image Processing (ICIP), Taipei, Taiwan, 22–25 September 2019; pp. 4489–4493.
- Sonie, O.; Chelliah, M.; Sural, S. Concept to code: Deep learning for fashion recommendation. In Proceedings of the Companion Proceedings of The 2019 World Wide Web Conference on—WWW ’19, San Francisco, CA, USA, 13–17 May 2019; pp. 1319–1320.
- Stefani, M.A.; Stefanis, V.; Garofalakis, J. CFRS: A trends-driven collaborative fashion recommendation system. In Proceedings of the 2019 10th International Conference on Information, Intelligence, Systems and Applications (IISA), Patras, Greece, 15–17 July 2019; pp. 1–4.
- Sun, G.-L.; Cheng, Z.-Q.; Wu, X.; Peng, Q. Personalized clothing recommendation combining user social circle and fashion style consistency. Multimed. Tools Appl. 2017, 77, 17731–17754.
- Kwon, Y.-B.; Ogier, J.-M. (Eds.) Graphics recognition. new trends and challenges: 9th international workshop. In GREC 2011, Seoul, Korea, 15–16 September 2011; Revised Selected Papers; Springer: Berlin/Heidelberg, Germany, 2011; Volume 7423.
- Lakshmi Pavani, M.; Bhanu Prakash, A.V.; Shwetha Koushik, M.S.; Amudha, J.; Jyotsna, C. Navigation through eye-tracking for human–computer interface. In Information and Communication Technology for Intelligent Systems; Satapathy, S.C., Joshi, A., Eds.; Springer: Singapore, 2019; Volume 107, pp. 575–586.
- Li, J.; Li, Y. Cognitive model based fashion style decision making. Expert Syst. Appl. 2012, 39, 4972–4977.
- Li, J.; Zhong, X.; Li, Y. A Psychological Decision Making Model Based Personal Fashion Style Recommendation System. In Proceedings of the International Conference on Human-centric Computing 2011 and Embedded and Multimedia Computing 2011; Park, J.J., Jin, H., Liao, X., Zheng, R., Eds.; Springer: Dordrecht, The Netherlands, 2011; Volume 102, pp. 57–64.
- Li, R.; Zhou, Y.; Mok, P.Y.; Zhu, S. Intelligent clothing size and fit recommendations based on human model customisation technology. In Proceedings of the WSCG ’2017: Short Communications Proceedings: The 25th International Conference in Central Europe on Computer Graphics, Visualization and Computer Vision 2016 in Co-Operation with EUROGRAPHICS, Plzen, Czech Republic, 29 May–2 June 2017; pp. 25–32.
- Lin, Y.; Ren, P.; Chen, Z.; Ren, Z.; Ma, J.; de Rijke, M. Improving Outfit Recommendation with Co-supervision of Fashion Generation. In Proceedings of the The World Wide Web Conference on—WWW ’19, San Francisco, CA, USA, 13–17 May 2019; pp. 1095–1105.
- Akabane, T.; Kosugi, S.; Kimura, S.; Arai, M. Method to consider familiarity in clothing coordination recommender systems. In Proceedings of the 2011 3rd International Conference on Computer Research and Development, Shanghai, China, 11–13 March 2011; Volume 1, pp. 22–26.
- Chae, Y.; Xu, J.; Stenger, B.; Masuko, S. Color navigation by qualitative attributes for fashion recommendation. In Proceedings of the 2018 IEEE International Conference on Consumer Electronics (ICCE), Las Vegas, NV, USA, 12–15 January 2018; pp. 1–3.
- Chung, W.; Shin, C.S. (Eds.) Advances in affective and pleasurable design. In Proceedings of the AHFE 2017 International Conference on Affective and Pleasurable Design, Los Angeles, CA, USA, 17–21 July 2017; Springer International Publishing: New York, NY, USA, 2018; Volume 585.
- Faria, A.P.; Cunha, J.; Providência, B. Fashion communication in the digital age: Findings from interviews with industry professionals and design recommendations. Procedia CIRP 2019, 84, 930–935.
- Gu, X.; Wong, Y.; Peng, P.; Shou, L.; Chen, G.; Kankanhalli, M.S. Understanding fashion trends from street photos via neighbor-constrained embedding learning. In Proceedings of the MM 2017-Proceedings of the 2017 ACM Multimedia Conference, Mountain View, CA, USA, 23–27 October 2017; pp. 190–198.
- Heinz, X.S.; Bracher, C.; Vollgraf, R. An LSTM-Based Dynamic Customer Model for Fashion Recommendation. Available online: https://arxiv.org/abs/1708.07347v1 (accessed on 12 July 2021).
- Hu, Z.-H.; Li, X.; Wei, C.; Zhou, H.-L. Examining collaborative filtering algorithms for clothing recommendation in e-commerce. Text. Res. J. 2018, 89, 2821–2835.
- Suganeshwari, G.; Syed Ibrahim, S.P.A. Survey on collaborative filtering based recommendation system. In Proceedings of the 3rd International Symposium on Big Data and Cloud Computing Challenges (ISBCC–16’); Vijayakumar, V., Neelanarayanan, V., Eds.; Springer International Publishing: New York, NY, USA, 2016; Volume 49, pp. 503–518.
- Rana, M.K.C. Survey paper on recommendation system. Int. J. Comput. Sci. Inf. Technol. 2012, 3, 3460–3462.
- Alag, S. Collective Intelligence in Action; Manning: Greenwich, CT, USA, 2009.
- Bhatnagar, V. (Ed.) Collaborative Filtering Using Data Mining and Analysis; IGI Global: Hershey, PE, USA, 2016.
- Bobadilla, J.; Ortega, F.; Hernando, A.; Gutiérrez, A. Recommender systems survey. Knowl. Based Syst. 2013, 46, 109–132.
- Isinkaye, F.; Folajimi, Y.; Ojokoh, B. Recommendation systems: Principles, methods and evaluation. Egypt. Inform. J. 2015, 16, 261–273.
- Plumbaum, T.; Kille, B. Personalized Fashion Advice. In Smart Information Systems; Hopfgartner, F., Ed.; Springer International Publishing: New York, NY, USA, 2015; pp. 213–237.
- Schafer, J.B.; Konstan, J.; Riedl, J. (Eds.) Recommender Systems in E-Commerce. In Proceedings of the ACM Conference on Electronic Commerce, Denver, CO, USA, 3–5 November 1999; ACM Press: New York, NY, USA, 1999.
- Dalgleish, A.R. An Item Recommendation System. U.S. Patent No. US20110184831A1, 28 July 2011.
- Wei, Z.; Yan, Y.; Huang, L.; Nie, J. Inferring intrinsic correlation between clothing style and wearers’ personality. Multimed. Tools Appl. 2017, 76, 20273–20285.
- Rosebrock, A. Intersection over Union (IoU) for Object Detection; Pyimagesearch, 2016. Available online: https://www.pyimagesearch.com/2016/11/07/intersection-over-union-iou-for-object-detection/ (accessed on 13 July 2021).
- Cremonesi, P.; Koren, Y.; Turrin, R. Performance of recommender algorithms on top-n recommendation tasks. In Proceedings of the Fourth ACM Conference on Recommender Systems, Barcelona, Spain, 26–30 September 2010; Association for Computing Machinery: New York, NY, USA, 2010; pp. 39–46.
- Taifi, M. MRR vs MAP vs NDCG: Rank-Aware Evaluation Metrics and when to Use Them. 2019. Available online: https://medium.com/swlh/rank-aware-recsys-evaluation-metrics-5191bba1683221 (accessed on 13 July 2021).
- Valcarce, D.; Bellogín, A.; Parapar, J.; Castells, P. Assessing ranking metrics in top-N recommendation. Inf. Retr. 2020, 23, 411–448.
- Guan, C.; Qin, S.; Long, Y. Apparel-based deep learning system design for apparel style recommendation. Int. J. Cloth. Sci. Technol. 2019, 31, 376–389.
- Zempo, K.; Sumita, U. Identifying Colors of Products and Associated Personalized Recommendation Engine in e-Fashion Business. In Proceedings of the International Conference on Social Modeling and Simulation, Plus Econophysics Colloquium 2014; Takayasu, H., Ito, N., Noda, I., Takayasu, M., Eds.; Springer International Publishing: New York, NY, USA, 2015; pp. 335–346.
- Hidayati, S.C.; Hsu, C.-C.; Chang, Y.-T.; Hua, K.-L.; Fu, J.; Cheng, W.-H. What dress fits me best?: Fashion recommendation on the clothing style for personal body shape. In Proceedings of the 2018 ACM Multimedia Conference on Multimedia Conference—MM ’18, Yokohama, Japan, 11–14 June 2018; pp. 438–446.
- Piazza, A.; Kröckel, P.; Bodendorf, F. Emotions and fashion recommendations: Evaluating the predictive power of affective information for the prediction of fashion product preferences in cold-start scenarios. In Proceedings of the International Conference on Web Intelligence, Amantea, Italy, 19–22 June 2017; pp. 1234–1240.
- Vecchi, A. (Ed.) Advanced Fashion Technology and Operations Management; IGI Global: Hershey, PE, USA, 2017.
- Sharma, S.; Koehl, L.; Bruniaux, P.; Zeng, X. Garment fashion recommendation system for customized garment. In Proceedings of the 2019 International Conference on Industrial Engineering and Systems Management (IESM), Shanghai, China, 25–27 September 2019; pp. 1–6.
- Rashid, A.M.; Albert, I.; Cosley, D.; Lam, S.K.; McNee, S.M.; Konstan, J.A.; Riedl, J. Getting to know you: Learning new user preferences in recommender systems. In Proceedings of the 7th International Conference on Intelligent User Interfaces—IUI ’02, San Francisco, CA, USA, 13–16 January 2002; p. 127.
- Guigourès, R.; Ho, Y.K.; Koriagin, E.; Sheikh, A.-S.; Bergmann, U.; Shirvany, R. A hierarchical bayesian model for size recommendation in fashion. In Proceedings of the 12th ACM Conference on Recommender Systems, Columbia, BC, Canada, 2 October 2018; pp. 392–396.
- Hou, M.; Wu, L.; Chen, E.; Li, Z.; Zheng, V.W.; Liu, Q. Explainable fashion recommendation: A semantic attribute region guided approach. arXiv 2019, arXiv:1905.12862.
- Tuinhof, H.; Pirker, C.; Haltmeier, M. Image-based fashion product recommendation with deep learning. In Machine Learning, Optimization, and Data Scienc; Nicosia, G., Pardalos, P., Giuffrida, G., Umeton, R., Sciacca, V., Eds.; Springer International Publishing: New York, NY, USA, 2019; Volume 11331, pp. 472–481.
- Verma, S.; Anand, S.; Arora, C.; Rai, A. Diversity in Fashion Recommendation Using Semantic Parsing. In Proceedings of the 2018 25th IEEE International Conference on Image Processing (ICIP), Athens, Greece, 7–10 October 2018; pp. 500–504.
- Cardoso, Â.; Daolio, F.; Vargas, S. Product characterisation towards personalisation: Learning attributes from unstructured data to recommend fashion products. In Proceedings of the 24th ACM SIGKDD International Conference on Knowledge Discovery & Data Mining, London, UK, 19–23 August 2018; Association for Computing Machinery: New York, NY, USA, 2018; pp. 80–89.