Your browser does not fully support modern features. Please upgrade for a smoother experience.
Please note this is a comparison between Version 1 by hao Ding and Version 2 by Rita Xu.
The growth and development of skeletal muscle determine the meat production performance of pigeons and are regulated by complex gene networks. To explore the genes involved in regulating the growth and development of pigeon skeletal muscle, RNA sequencing (RNA−seq) was used to characterise gene expression profiles during the development and growth of pigeon breast muscle and identify differentially expressed genes (DEGs) among different stages.
- pigeon
- skeletal muscle
- development and growth
1. Introduction
Pigeon meat is rich in nutrition, high in protein, low in fat, and high in medicinal value. In China, pigeon meat is called “animal ginseng” and is considered an advanced nourishment product that is increasingly favoured by consumers [1]. Meat production performance is an important index to measure the economic value of pigeons. However, the genetic improvement of the meat production performance of pigeons is relatively lagging in comparison with other poultry. The growth and development of skeletal muscle determine the meat production performance of pigeons [2]. Therefore, understanding the molecular regulation mechanism of pigeon skeletal muscle growth and development is an important prerequisite for improving meat production performance by molecular breeding technology [3].
The development of skeletal muscle is closely related to skeletal muscle cell differentiation. Myogenic regulatory factor family (MRF) members play essential roles in the process of skeletal muscle cell differentiation, including MyoD (myogenic determining factor), MyoG (myogenin), MRF4 (myogenic regulatory factor 4), and Myf5 (myogenic factor 5) [4]. However, the process of skeletal muscle growth and development involves multi−gene expression, signal transduction, and network regulation, and there are still a large number of regulatory factors to be identified.
RNA sequencing (RNA−seq) can explore the differences of gene types and expression levels at the overall level and directly link the changes of gene expression levels with phenotypic changes. In recent years, to explore the molecular mechanism of critical economic traits, considerable transcriptome studies on livestock and poultry were carried out using RNA−seq technology [5]. Xing et al. revealed essential genes related to muscle fat and abdominal fat deposition in chickens during the development process and identified 21 key genes in total, using RNA−Seq analysis [6]. Hu et al. identified several genes and pathways that may regulate skeletal muscle growth in the black Muscovy duck using RNA−seq [7]. RNA−seq technology has also been applied to pigeon transcriptome analysis. Wang et al. performed a comprehensive investigation into miRNA transcriptomes in livers across three pigeon developmental stages using RNA−seq and identified several vital target genes (e.g., TNRC6B, FRS2, PTCH1, etc.) of DE miRNA, which is closely linked to liver development [8]. Ye et al. compared the transcriptomes of muscle and liver tissues between squabs of two breeds to identify candidate genes associated with the differences in the capacity of fat deposition. A total of 27 genes were identified as a basis for further investigations to screen markers closely associated with intramuscular fat content and fatty acid composition in squabs [9].
2. Weighted Gene Co−Expression Network Analysis
To investigate the relationship between DEGs and muscle development and growth, we performed a WGCNA analysis based on the expression of 11,311 DEGs. WGCNA categorised 11,311 DEGs into 12 modules with a soft power of 5 (Figure 12A,B). Among the 12 modules, black and brown were significantly correlated with day 1 and 10 stages, while turquoise and cyan were significantly correlated with embryonic development stages of days 8 and 13 (r > 0.4) (Figure 12C).
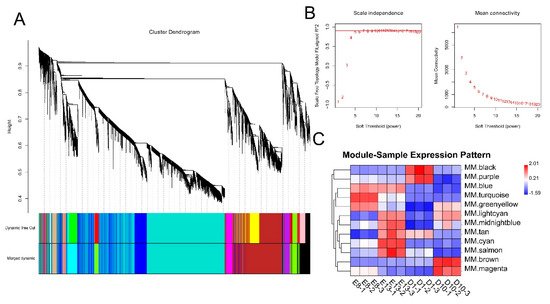
Figure 12. WGCNA analysis of DEGs. (A) Clustering dendrogram of DEGs with dissimilarity based on the topological overlap. Dynamic tree cutting was applied to identify modules by dividing the dendrogram at significant branch points. Modules are displayed with different colours in the horizontal bar immediately below the dendrogram. (B) Determination of soft−thresholding power for WGCNA analysis. The graph indicates that soft thresholding power above 5 meets scale−free topology above 0.85. (C) Heatmap of the correlation between samples and gene modules. Each row corresponds to a module eigengene, each column to a sample. Each cell contains the corresponding correlation value. Red and blue colours represent positive and negative correlations, respectively. The darker the colour, the higher the correlation.
3. Visualisation of the Pigeon Muscle Development and Growth−Related Modules
To further explore candidate DEGs that regulate pigeon skeletal muscle growth and development, we visualised the four significant modules identified by WGCNA based on the top 1000 mRNA−mRNA interaction pairs in each module. Four mRNA−mRNA regulatory networks were constructed, corresponding to black, brown, cyan, and turquoise modules, respectively. The black, brown, cyan and turquoise modules contained 265, 308, 276, and 402 mRNAs, respectively (Figure 23).
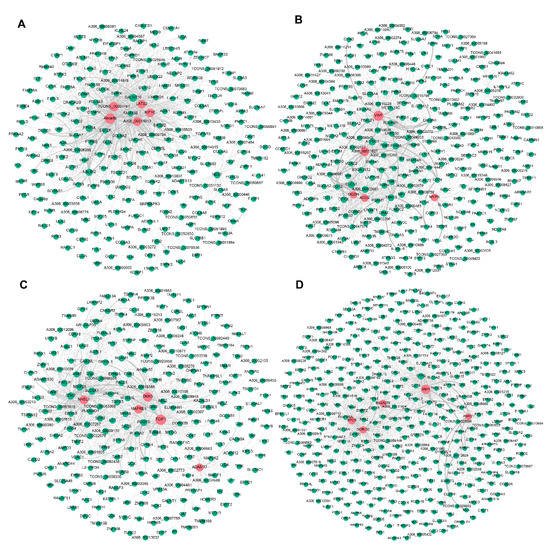
Figure 23. Visualisation of the four modules related to pigeon muscle development and growth. Networks (A–D) represent visualisations of gene interactions of black, brown, cyan and turquoise modules, respectively. The node size indicates the node degree. The line thickness indicates the strength of the correlation. Red nodes represent hub DEGs in each module.