Image-based fashion recommendation systems (FRSs) have attracted a huge amount of attention from fast fashion retailers as they provide a personalized shopping experience to consumers. With the technological advancements, this branch of artificial intelligence exhibits a tremendous amount of potential in image processing, parsing, classification, and segmentation.
- fashion recommendation system
- e-commerce
- filtering techniques
- algorithmic models
- performance
1. Introduction
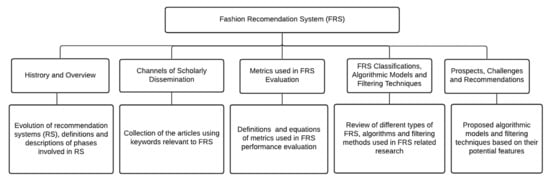
2. History and Overview of Recommendation System
Year | Recommendation System Approach | Properties | ||||||
|---|---|---|---|---|---|---|---|---|
Before 1992 | Mafia, developed in 1990 |
| ||||||
1992 to 1998 | Tapestry, developed in 1992 |
| ||||||
Grouplens, first used in 1994 |
| |||||||
Movielens, proposed in 1997 |
| |||||||
1999 to 2005 | PLSA (Probabilistic Latent Semantic Analysis), proposed in 1999 |
| ||||||
2005 to 2009 | Several Latent Factor Models such as Singular Value Decompositions (SVD), Robust Singular Value Decomposition (RSVD), Normalized Singular Value Deviation (NSVD). |
| ||||||
2010 to onwards | Context-aware-based, instant-personalization-based |
|
3. Channels of Scholarly Dissemination Related to Fashion Recommendation System (FRS)
4. Metrics Used in Fashion Recommendation System Evaluation
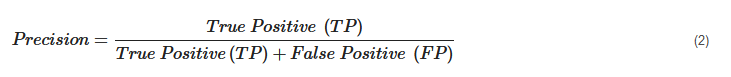 It is also defined as the ratio of the number of relevant recommended items to the number of recommended items expressed as percentages.
Recall. Recall can be defined as the fraction of correct recommendations or predictions (known as True Positive) to the total number of correct relevant recommendations provided, which can be as represented as follows:
It is also defined as the ratio of the number of relevant recommended items to the number of recommended items expressed as percentages.
Recall. Recall can be defined as the fraction of correct recommendations or predictions (known as True Positive) to the total number of correct relevant recommendations provided, which can be as represented as follows:
 It is also defined as the ratio of the number of relevant recommended items to the total number of relevant items expressed as percentages.
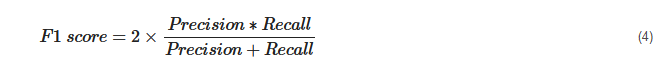
F1 Score. F1 score is an indicator of the accuracy of the model and ranges from 0 to 1, where a value close to 1 represents higher recommendation or prediction accuracy. It represents precision and recall as a single metric and can be as represented as follows:
It is also defined as the ratio of the number of relevant recommended items to the total number of relevant items expressed as percentages.
F1 Score. F1 score is an indicator of the accuracy of the model and ranges from 0 to 1, where a value close to 1 represents higher recommendation or prediction accuracy. It represents precision and recall as a single metric and can be as represented as follows:
 Coverage. Coverage is used to measure the percentage of items which are recommended by the algorithm among all of the items.
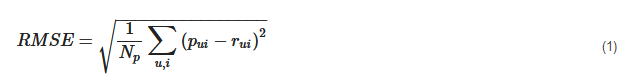
Accuracy. Accuracy can be defined as the ratio of the number of total correct recommendations to the total recommendations provided, which can be as represented as follows:
Coverage. Coverage is used to measure the percentage of items which are recommended by the algorithm among all of the items.
Accuracy. Accuracy can be defined as the ratio of the number of total correct recommendations to the total recommendations provided, which can be as represented as follows:
 Intersection over union (IoU). It represents the accuracy of an object detector used on a specific dataset [62][70].
 ROC. ROC curve is used to conduct a comprehensive assessment of the algorithm’s performance [57].
AUC. AUC measures the performance of recommendation and its baselines as well as the quality of the ranking based on pairwise comparisons [5].
Rank aware top-N metrics. The rank aware top-N recommendation metric finds some of the interesting and unknown items that are presumed to be most attractive to a user [63][71]. Mean reciprocal rank (MRR), mean average precision (MAP) and normalized discounted cumulative gain (NDCG) are three most popular rank aware metrics.
MRR. MRR is calculated as a mean of the reciprocal of the position or rank of first relevant recommendation [64][65][72,73]. MRR as mentioned by [64][65][72,73] can be expressed as follows:
ROC. ROC curve is used to conduct a comprehensive assessment of the algorithm’s performance [57].
AUC. AUC measures the performance of recommendation and its baselines as well as the quality of the ranking based on pairwise comparisons [5].
Rank aware top-N metrics. The rank aware top-N recommendation metric finds some of the interesting and unknown items that are presumed to be most attractive to a user [63][71]. Mean reciprocal rank (MRR), mean average precision (MAP) and normalized discounted cumulative gain (NDCG) are three most popular rank aware metrics.
MRR. MRR is calculated as a mean of the reciprocal of the position or rank of first relevant recommendation [64][65][72,73]. MRR as mentioned by [64][65][72,73] can be expressed as follows:
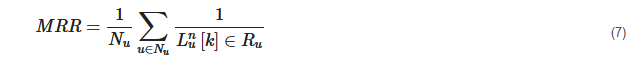 where u, Nu and Ru indicate specific user, total number of users and the set of items rated by the user, respectively. L indicates list of ranking length (n) for user (u) and k represents the position of the item found in the he lists L.
MAP: MAP is calculated by determining the mean of average precision at the points where relevant products or items are found. MAP as mentioned by [65][73] can be expressed as follows.
where u, Nu and Ru indicate specific user, total number of users and the set of items rated by the user, respectively. L indicates list of ranking length (n) for user (u) and k represents the position of the item found in the he lists L.
MAP: MAP is calculated by determining the mean of average precision at the points where relevant products or items are found. MAP as mentioned by [65][73] can be expressed as follows.
 where Pu represents precision in selecting relevant item for the user.
NDCG: NDCG is calculated by determining the graded relevance and positional information of the recommended items, which can be expressed as follows [65][73].
where Pu represents precision in selecting relevant item for the user.
NDCG: NDCG is calculated by determining the graded relevance and positional information of the recommended items, which can be expressed as follows [65][73].
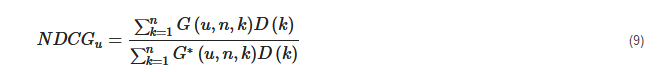 where D (k) is a discounting function, G (u, n, k) is the gain obtained recommending an item found at k-th position from the list L and G* (u, n, k) is the gain related to k-th item in the ideal ranking of n size for u user.