Ossification of the posterior longitudinal ligament (OPLL) is a multifactorial disease that develops under complex genetic and environmental conditions [1,2]. The ectopic ossification causes chronic compression of the spinal cord, which leads to neurological dysfunction below the level of compression [3]. Although the prevalence of OPLL in the general population is relatively low, ranging from 0.1 to 2.5% in the United States and 1.9 to 4.3% in Japan ,[1,4,5], OPLL accounts for 18 to 35% as an etiology of degenerative cervical myelopathy (DCM), which requires surgical treatment [6]. Thus, OPLL is a major etiology of DCM, irrespective of race or region [6,7].
OPLL is associated with an increased prevalence of diabetes mellitus (DM) [5,8,9]. The prevalence of DM in patients with OPLL is 27% in the United States [5]. DM increases the prevalence of comorbidities, such as obesity, hypertension, common infections, and systemic vascular diseases [10], thereby exerting a negative impact on spinal surgeries [11]. Several studies have investigated the impact of DM on surgical outcomes in patients undergoing surgical treatment for cervical spondylotic myelopathy (CSM) or DCM (CSM and OPLL) [12,13]. Despite the high prevalence of DM in patients with OPLL, only a few retrospective case series have analyzed DM as a prognostic factor for the surgical management of cervical OPLL [14].
1. Introduction
Ossification of the posterior longitudinal ligament (OPLL) is commonly associated with diabetes mellitus (DM); however, the impact of DM on cervical spine surgery for OPLL remains unclear. This study was performed to evaluate the influence of diabetes DM on the outcomes following cervical spine surgery for OPLL. In total, 478 patients with cervical OPLL who underwent surgical treatment were prospectively recruited from April 2015 to July 2017. Functional measurements were conducted at baseline and at 6 months, 1 year, and 2 years after surgery using JOA and JOACMEQ scores. The incidence of postoperative complications was categorized into early (≤30 days) and late (>30 days), depending on the time from surgery. From the initial group of 478 patients, 402 completed the 2-year follow-up and were included in the analysis. Of the 402 patients, 127 (32%) had DM as a comorbid disease. The overall incidence of postoperative complications was significantly higher in patients with DM than in patients without DM in both the early and late postoperative periods. The patients with DM had a significantly lower JOA score and JOACMEQ scores in the domains of lower extremity function and quality of life than those without DM at the 2-year follow-up.
2. Analysis on Results
2.1. Patients’ Characteristics and Baseline Functions
From the initial group of 478 participants, 402 completed the 2-year follow-up (follow-up rate: 84%) and were included in the analysis. Of the 402 patients, 127 (32%) had DM as a comorbid disease. The 127 patients with DM comprised 123 patients with non-insulin-dependent DM and 4 patients with insulin-dependent DM. The comparisons of patients’ demographics and baseline functions between patients with and without DM are summarized in Table 1. The patients with DM had a significantly higher body mass index (BMI) and rates of hypertension, myocardial infarction, and anticoagulant/antiplatelet medication than those without DM. Additionally, the patients with DM had significantly inferior lower extremity function measured using the JOACMEQ and significantly higher visual analog scale scores for neck pain than those without DM. Regarding surgical methods, the patients with DM had a significantly higher rate of PDF and a significantly higher number of surgical levels than those without DM.
Table 1. Patients’ characteristics and baseline functions.
| Characteristics |
With DM (N = 127) |
Without DM (N = 275) |
p Value * |
| 0.748 |
| No. of surgical levels |
| 4 (3–5) |
| 4 (3–4) |
| 0.029 |
2.2. Postoperative Complications
2.2. Postoperative Complications
The incidence of postoperative complications is shown in Table 2. Each early complication showed no significant difference between the groups, except urinary tract infection; however, the overall incidence of early complications was significantly higher in the patients with DM than in the patients without DM. Similarly, the overall incidence of late complications was significantly higher in the patients with DM than in the patients without DM.
Table 2. Incidence of early and late postoperative complications.
| Complication |
With DM (N = 127) |
Without DM (N = 275) |
p Value * |
| Age |
64.2 ± 11.0 |
| Early (≤30 days from surgery) |
| 64.0 ± 11.9 |
0.743 |
| |
|
Gender (Male/Female) |
90/37 |
| Neurological deterioration |
12 (9) | 208/67 |
0.328 |
| 30 (11) |
0.727 |
BMI |
26.5 ± 4.5 |
| CSF leakage |
6 (5) | 25.3 ± 4.3 |
0.006 |
| 14 (5) |
1.000 |
Medical comorbidities |
|
| Dysphasia |
3 (2) | |
|
| 8 (3) |
1.000 |
Hypertension |
59 (46) |
| Graft bone failure |
3 (2) | 94 (34) |
0.021 |
| 5 (2) |
0.712 |
Cerebral infarction |
11 (9) |
| Instrument failure |
2 (1.6) | 10 (4) |
0.051 |
| 5 (2) |
1.000 |
1 (6) |
0.086 |
Myocardial infarction |
8 (6) |
| † |
Wound infection |
2 (1.6)6 (2) |
0.044 |
| 4 (1.5) |
1.000 |
Musculoskeletal disease |
18(14) |
| Wound dehiscence |
2 (1.6) | 31 (11) |
0.416 |
| 2 (0.7) |
0.594 |
Connective tissue disease |
1 (0.8) |
| Epidural hematoma |
1 (0.8) | 3 (1.1) |
1.000 |
| 1 (0.4) |
0.533 |
Anticoagulant/antiplatelet medication |
26 (20) |
| Upper air way obstruction |
1 (0.8) | 34 (12) |
0.049 |
| 1 (0.4) |
0.533 |
Duration of symptoms (month) |
46.7 ± 62.3 |
| Urinary tract infection |
6 (5) | 41.4 ± 66.0 |
0.189 |
| 3 (1) |
0.031 |
JOA score |
10.5 ± 2.6 |
| Delirium |
4 (3) | 10.7 ± 3.0 |
0.341 |
| 5 (2) |
0.472 |
JOACMEQ |
|
| Deep vein thrombosis |
1 (0.8) | |
|
| 2 (0.7) |
1.000 |
| 19 (15) |
| 21 (8) |
| 0.031 |
2.3. Functional Outcomes
2.3. Functional Outcomes
The functional outcomes at the 2-year follow-up are presented in Table 3. The patients with DM had a significantly lower JOA score than those without DM. Furthermore, the patients with DM had significantly lower JOACMEQ scores in the domains of lower extremity function and QOL than the patients with DM. The comparisons of postoperative functional gain between the patients with and without DM are summarized in Table 4. The average postoperative gains of functional scores were consistently lower in the patients with DM than in those without DM; however, the difference did not reach statistical significance in any functional measures.
Table 3. Comparisons of functional outcomes between patients with and without diabetes mellitus at the 2-year follow-up.
| Outcome |
With DM (N = 127) |
Without DM (N = 275) |
p Value * |
Table 4. Comparisons of postoperative functional gain between patients with and without diabetes mellitus.
| Outcome |
With DM (N = 127) |
Without DM (N = 275) |
p Value * |
| JOA score |
13.1 ± 2.8 |
13.8 ± 2.5 |
0.024 |
| JOACMEQ |
|
|
|
| Cervical spine |
| Cervical spine |
| 60.8 ± 31.2 |
| 60.7 ± 20.1 |
62.8 ± 32.1 |
0.389 |
| Gastrointestinal bleeding |
| 0 (0) |
| Upper extremity |
| 61.5 ± 28.7 |
0.944 |
| 3 (1) |
0.555 |
Upper extremity |
68.8 ± 25.2 |
| 77.9 ± 20.0 |
81.1 ± 19.5 |
0.105 |
| Lower extremity |
61.0 ± 28.1 |
67.7 ± 28.1 |
0.026 |
| Bladder |
75.1 ± 22.4 |
77.1 ± 21.3 |
0.369 |
| QOL |
49.6 ± 18.7 |
54.1 ± 19.2 |
0.036 |
Heart failure |
1 (0.8) |
| Neck pain VAS |
40.6 ± 31.1 |
36.0 ± 30.0 |
0.197 |
0.094 |
| Postoperative change in neck pain VAS |
−5.8 ± 32.6 |
−3.2 ± 33.7 |
72.6± 24.3 |
0.126 |
| 1 (0.4) |
0.533 |
Lower extremity |
52.4 ± 29.4 |
| Liver dysfunction |
1 (0.8) | 59.4 ± 29.4 |
0.019 |
| 0 (0) |
| 2 (0.7) |
1.000 |
| Wound infection |
| Recovery rate of JOA score |
40.8 ± 33.6 |
48.7 ± 32.5 |
0.051 |
| Postoperative gain in JOA score |
2.6 ± 2.4 |
3.1 ± 2.5 |
0.151 |
| Postoperative gain in JOACMEQ |
|
|
|
| Cervical spine |
−3.1 ± 29.2 |
1.6 ± 34.1 |
0.230 |
| Upper extremity |
6.4 ± 23.1 |
8.4 ± 22.1 |
0.251 |
| 1 (0.4) |
| 0.533 |
| Bladder |
71.5 ± 23.6 |
| Brain infarction |
0 (0) | 72.9 ± 22.2 |
0.430 |
| 1 (0.4) |
1.000 |
QOL |
42.5 ± 19.8 |
| Pneumonia |
0 (0) | 44.4 ± 18.3 |
0.179 |
| 1 (0.4) |
1.000 |
Neck pain VAS |
47.6 ± 32.3 |
| Cholecystitis |
1 (0.8) | 39.8 ± 30.7 |
0.035 |
| 0 (0) |
0.316 |
Imaging finding |
|
| Any early complications |
43 (34) | |
|
| 66 (24) |
0.041 |
C2-C7 Cobb angle (degree) |
8.6 ± 12.9 |
| Late (>30 days from surgery) |
| 10.1 ± 10.5 |
0.258 |
| |
|
Range of motion (degree) |
24.7 ± 12.4 |
| Instrument failure |
6 (5) | 28.1 ± 14.4 |
0.051 |
| 5 (2) |
0.109 |
Occupancy ratio of OPLL (%) |
45.7 ± 15.6 |
| 0 (0) |
2 (0.7) |
1.000 |
| Dysphasia |
2 (1.6) |
0 (0) |
0.099 |
| Lower extremity |
6.2 ± 24.5 |
7.6 ± 24.2 |
0.826 |
| Bladder |
0.9 ± 20.7 |
3.0 ± 19.8 |
0.639 |
Lumbar spinal stenosis |
3 (2)43.3 ± 15.3 |
0.173 |
| 8 (3) |
1.000 |
K-line (−) |
42 (33) |
| Adjacent segment disease |
2 (1.6) | 93 (34) |
0.883 |
| 1 (0.4) |
0.236 |
Surgical method |
|
| Thoracic OPLL |
1 (0.8) |
Stroke |
2 (1.6) |
0 (0) |
0.099 |
| Urinary tract infection |
2 (1.6) |
1 (0.4) |
0.236 |
| QOL |
4.9 ± 16.7 |
9.3 ± 18.9 |
0.625 |
|
|
| 1 (0.4) |
0.533 |
ADF |
21 (17) |
68 (25) |
0.071 |
| C5 palsy |
1 (0.8) |
1 (0.4) |
0.528 |
PDF |
39 (31) |
52 (19) |
0.010 |
| LP |
| Non-union |
63 (50) |
148 (54) |
0.453 |
| APF |
4 (3) |
7 (3) |
Pneumonia |
2 (1.6) |
0 (0) |
0.099 |
| Parkinson’s disease |
0 (0) |
2 (0.7) |
1.000 |
2.4. Time-Dependent Change of Functional Outcomes
2.4. Time-Dependent Change of Functional Outcomes
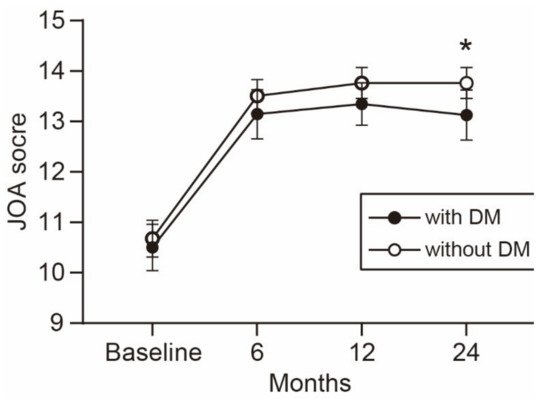
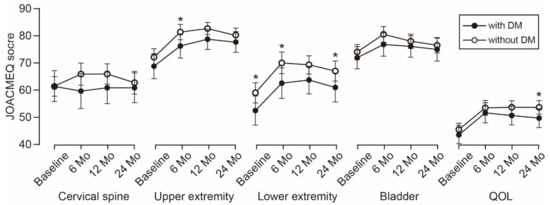
The time-dependent change in the JOA score is shown in Figure 1. The average JOA score was consistently lower in the patients with DM than in the patients without DM during the observation period. The difference between the groups increased over time and reached statistical significance at the 2-year follow-up. Similarly, the average scores of the five JOACMEQ domains were lower in the patients with DM than in the patients without DM (Figure 2). The difference in lower extremity function was significant during the observation period, except for the 1-year follow-up (p = 0.056). The difference in upper extremity function showed statistical significance at the 6-month follow-up and returned to a comparable level at the 1-year follow-up or later. Similar to the change in the JOA score, the difference in the QOL domain of the JOACMEQ between the groups increased over time and reached statistical significance at the 2-year follow-up.
Figure 1. Time-dependent change in the JOA score. The average JOA score was consistently lower in patients with than without DM during the observation period. The difference between the groups increased over time and reached statistical significance at the 2-year follow-up. * p < 0.05, unpaired t-test. JOA, Japanese Orthopedic Association; DM, diabetes mellitus.
Figure 2. Time-dependent change in JOACMEQ scores. The difference in lower extremity function was significant during the observation period, except for the 1-year follow-up. The difference in upper extremity function showed statistical significance at the 6-month follow-up. The difference in the QOL domain between the groups increased over time and reached statistical significance at the 2-year follow-up. * p < 0.05, unpaired t-test. JOACMEQ, Japanese Orthopedic Association Cervical Myelopathy Evaluation Questionnaire; DM, diabetes mellitus; QOL, quality of life.
2.5. Surgical Outcomes Stratified by Surgical Procedures
Surgical outcomes were compared among the four surgical procedures (Table 5). The PDF group had a significantly lower preoperative JOA score than the LP group (p = 0.007, one-way ANOVA followed by Tukey’s post hoc test). The ADF group showed a significantly higher postoperative JOA score than the PDF group (p = 0.011, one-way ANOVA followed by Tukey’s post hoc test). However, the recovery rate of the JOA score showed no significant difference among the groups. The incidence of early postoperative complications was significantly higher in the ADF and PDF groups than in the LP group.
Table 5. Comparisons of surgical outcomes stratified by surgical procedures.
| |
Surgical Procedure |
p Value |
| Value |
ADF (N = 89) |
LP (N = 211) |
PDF (N = 91) |
APF (N = 11) |
|---|
| Dietary Control (N = 32) |
Oral Antidiabetics (N = 78) |
Insulin Therapy (N = 17) |
|---|
| No. of levels decompressed |
3 |
4 |
| Preoperative HbA1c |
6.7 ± 1.3 |
6.7 ± 0.8 | 5 |
4 |
<0.001 * |
| 7.7 ± 1.1 |
<0.001 * |
No. of levels fused |
3 |
N/A |
5 |
4 |
<0.001 * |
| Preoperative JOA score |
10.9 ± 2.6 |
| Preoperative JOA score |
10.7 ± 3.3 |
10.5 ± 2.2 |
10.2 ± 3.1 |
10.9 ± 2.7 |
9.7 ± 3.3 |
9.5 ± 3.2 |
0.002 * |
| 0.788 * |
Recovery rate of JOA score |
53.1 ± 31.1 |
| Postoperative JOA score |
13.3 ± 3.5 |
13.1 ± 2.6 |
13.2 ± 2.7 |
0.917 * |
Postoperative JOA score |
14.1 ± 2.4 |
13.7 ± 2.4 |
12.9 ± 3.1 |
| Recovery rate of JOA score | 12.7 ± 2.7 |
42.6 ± 29.0 |
38.6 ± 36.9 |
47.6 ± 25.3 |
0.576 *0.010 * |
| 44.3 ± 33.7 |
44.9 ± 33.1 |
38.7 ± 30.4 |
0.157 * |
| Early (≤30 days from surgery) complications |
10 (31) |
Early complication |
34 (38) |
38 (18) |
34 (37) |
3 (27) |
<0.001 † |
| Late complication |
12 (13) |
15 (7) |
13 (14) |
0 (0) |
0.067 † |
| Multiple sclerosis |
| 0 (0) |
| 1 (0.4) |
| 1.000 |
| Any late complications |
2.6. Surgical Outcomes Stratified by Treatment Modalities for DM
2.6. Surgical Outcomes Stratified by Treatment Modalities for DM
Surgical outcomes were stratified into three groups based on the treatment modalities (Table 6). The preoperative HbA1c level differed significantly among the groups. The patients in the insulin therapy group had a significantly higher preoperative HbA1c level than the patients in the other groups (p < 0.001, one-way ANOVA followed by Tukey’s post hoc test). However, neither functional outcomes nor the incidence of postoperative complications showed significant differences among the groups.
Table 6. Comparisons of surgical outcomes stratified by treatment modalities for diabetes mellitus.
| |
Treatment Modality |
p |
| 29 (38) |
| 5 (24) |
| 0.518 | † |
| Late (>30 days from surgery) complication |
2 (6) |
16 (21) |
3. Discussion
DM substantially increases the risk of developing systemic complications after surgical interventions through several pathological mechanisms. First, DM impairs the function of endothelial and vascular smooth muscle cells, which leads to systemic atherosclerosis and its complications, such as cardiac infarction, cerebral infarction, peripheral vascular diseases, nephropathy, and retinopathy
[1]. Second, type 2 DM is associated with increased comorbid rates of obesity and hypertension, and the coexistence of these conditions further increases the risk of macrovascular and microvascular complications
[2]. Finally, DM increases patients’ susceptibility to infections, such as lower respiratory tract infection, urinary tract infection, and skin and mucous membrane infection, because of the impaired innate and adaptive immune responses against invading pathogens
[3]. Indeed, in this study, the patients with DM showed a significantly higher BMI and rate of hypertension, myocardial infarction, and anticoagulant/antiplatelet medication than those without DM at baseline. Furthermore, the patients with DM had a significantly higher incidence of urinary tract infection in the early postoperative period. These results indicate that patients with OPLL have an increased risk of systemic complications after surgery. Although we could not find statistical significance, except for urinary tract infection, the significantly higher overall incidence of complications may be attributed to various systemic comorbidities associated with DM.
The impact of DM on surgical outcomes after spine surgery remains controversial. Armaghani et al.
[4] demonstrated that DM is associated with worse patient-reported outcomes, such as the Neck Disability Index and EuroQOL-5 Dimensions, when patients with DM were compared with those without DM following elective cervical spine surgery. However, Arnold et al.
[5] concluded that the outcomes of surgical decompression for CSM are similar in patients with and without DM, except for the 36-Item Short Form Health Survey Physical Functioning scores. More recently, Nori et al.
[6] showed that patients with CSM who had DM experienced improvements in neurological function following posterior decompression to the same extent observed in those without DM. This study focused exclusively on patients with OPLL and showed comparable neurological improvements measured using both the JOA score and JOACMEQ scores between patients with and without DM, although the functional outcomes at the 2-year follow-up were significantly worse in patients with DM than in those without DM. The significantly worse functional outcomes at the endpoint were partly attributable to the significantly worse lower extremity function at baseline in patients with DM than in patients without DM. The significantly lower baseline physical function is consistent with that in past studies that demonstrate that older individuals with DM are associated with weaker muscle strength and a higher risk of impaired physical function than their age-matched counterparts without DM
[7][8]. Furthermore, the significantly higher rate of medical comorbidities and the significantly higher incidence of postoperative complications in patients with DM may interfere with functional outcomes. Although most of the medical comorbidities and postoperative complications are not directly associated with neurological functions, poorer general health conditions might impair not only physical functions but also QOL. Indeed, patients with DM had a significantly lower score in the QOL domain of the JOACMEQ than patients without DM.
A recent systematic review demonstrated that HbA1c is predictive for postoperative infection and functional outcomes in patients undergoing spine surgery and that an HbA1c level of >6.5 to 6.9% is associated with an increased risk of postoperative complications. However, in the present study, the preoperative HbA1c level showed no significant association with either functional outcomes or the incidence of postoperative complications. One possible explanation for this inconsistency may be the small number of patients with DM in the present study. Our sample size may be insufficient to detect the predictive value of HbA1c on surgical outcomes. Consistent with our results, Nagoshi et al.
[9] recently showed no significant correlation between the preoperative HbA1c level and postoperative JOA score in 47 patients with concurrent OPLL and DM. Furthermore, some patients with a high preoperative HbA1c level received perioperative insulin therapy. Rigorous glycemic control during the perioperative period might reduce the risk of postoperative complications associated with poorly controlled DM, resulting in a reduced predictive accuracy of the preoperative HbA1c level. A further large-scale prospective study is required to clarify the predictive value of HbA1c and its optimal cut-off point to identify patients with an increased risk of postoperative complications.